Abstract
Thiol groups play a significant role in various cellular functions. Cellular thiol concentrations can be affected by various physiological or pathological factors. A fluorescence imaging agent that can effectively and specifically image thiols in live cells through fluorescence microscopy is desirable for live cell thiol monitoring. Benzofurazan sulfides 1a–e were synthesized and found to be thiol specific fluorogenic agents except 1d. They are not fluorescent but form strong fluorescent thiol adducts after reacting with thiols through a sulfide-thiol exchange reaction. On the other hand, they exhibit no reaction with other biologically relevant nucleophilic functional groups such as -NH2, -OH, or -COOH revealing the specificity for the detection of thiols. Sulfide 1a was selected to confirm its ability to image cellular thiols through fluorescence microscopy. The compound was demonstrated to effectively image and quantify thiol changes in live cells through fluorescence microscopy using 430 nm and 520 nm as the excitation and emission wavelengths respectively. The quantification results of total thiol in live cells obtained from fluorescence microscopy were validated by an HPLC/UV total thiol assay method. The reagents and method will be of a great value to thiol redox-related research.
1. Introduction
Thiol (-SH or sulfhydryl) groups in cells play extraordinarily important roles in almost all aspects of cellular functions which include being part of enzyme active sites, involvement in signal transduction, cell division, removal of reactive oxygen species (ROS) and nitrogen species (RNS), removal of reactive electrophiles and etc.1 Chemically, a thiol group has three major properties. First it is an excellent reducing agent. A thiol group can be easily oxidized and serve as an antioxidant. Second, a thiol group is an excellent nucleophile; a property responsible for cellular thiols’ function in detoxification of reactive electrophiles or as a catalytic functional group involved in enzyme-mediated reactions. Third, a thiol group is an excellent chelating group for heavy metals. These properties are responsible for most of thiol related biological functions.
Thiols are present intracellularly, in extracellular fluids, and also on cell surfaces.2 Thiol molecules in mammalian systems can be divided into two major categories: protein thiols and non-protein or small molecule thiols. The principal non-protein thiol in the mammalian system is glutathione (GSH), a three amino acid peptide (Glu-Cys-Gly). GSH is present in mM concentration in the biological system. It is the major reducing agent in cells and serves as the major cellular antioxidant. GSH also serves as a major cellular detoxification molecule.
Thiol status or thiol density can be changed by various normal and abnormal conditions such as oxidation of thiol by an oxidant like ROS or RNS, glutathionylation or nitrosylation of thiols, which occurs when cells are under oxidative stress, and reaction of thiol groups with a reactive electrophile.3 A decrease in thiol concentration is linked to various cellular dysfunctions, such as a change in enzyme activities, membrane permeability, energy production, aging, and neuron degeneration.4–7
Due to the essential roles thiol groups play in cellular structure and function, numerous methods have been developed for the determination of thiol status. Most of these methods involve isolation of a biological sample (homogenates of tissues or cells) followed by analysis with a thiol assay method such as enzyme assays, spectrophotometric assays, assays with HPLC/UV or fluorescence detection, or LC/MS.8–15 Very limited methods are available for the determination of thiol status in intact live cells or intact tissues.
Fluorescence microscopy has been the most commonly used method employed to visualize a biochemical process of interest at the molecular and cellular level through imaging the biochemical process in an intact cell or tissue. Imaging can be achieved in fixed cells and tissues, in live cells and tissues, as well as in living systems in real-time. Visualization of a biochemical process in a live cell at the molecular level in real-time provides extremely valuable information in understanding the biochemical process.16
One of the key factors in fluorescence microscopy is how to make the biochemical process or molecule of interest fluoresce. The two major methods used to achieve this are tagging the molecule with an endogenous fluorophore such as a fluorescent protein [e.g., green fluorescent protein (GFP) or red fluorescent protein (RFP)]16,17 or tagging the molecule with an exogenous fluorophore.16 The endogenous fluorophore method is more complicated and involved. The exogenous fluorophore can be further divided into fluorescent agents and fluorogenic agents; in the latter case the agent itself has no fluorescence but becomes fluorescent after labeling the molecule of interest, and is preferred over fluorescent agents. The reason for a lack of effective fluorescence microscopy methods for thiol status determination in live cell is due to a lack of thiol specific agents to convert thiol groups into fluorescent groups.
There are a limited number of agents which have been reported for the use of imaging total thiols in live cells through fluorescence microscopy. These agents include monochlorobimane,18 chloromethyl fluorescein,18 o-phthaldialdehyde,18 mercury orange,18 rosamine-based,19 rhodamine-based,20,21 naphthalimide-based,22 rhodamine and fluorescein-based probes,23 and BODIPY® FL L-cystine from Molecular Probe (Grand Island, NY). However, limitations, such as a lack of selectivity for thiols and/or slow reaction rates, have been noted for these agents.18,20,23,24 Therefore, a thiol specific agent that can effectively and specifically image and quantify thiol in live cells through fluorescence microscopy is desirable in thiol-related research. To our knowledge, no agent has been reported to quantify total thiols in live cells through fluorescence microscopy reflecting a lack of agents that can specifically and completely convert thiol molecules to fluorescent molecules in live cells.
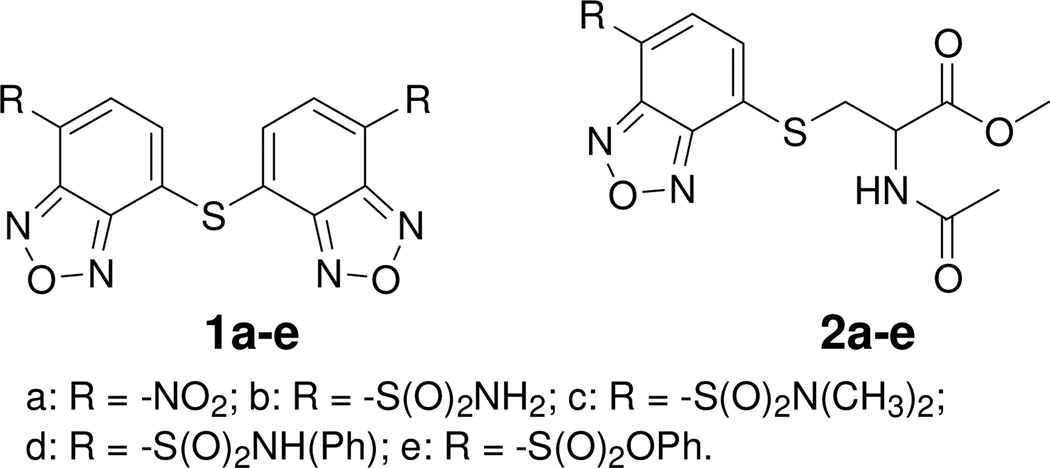
In an effort to find an agent that can specifically label and image thiols in live cells through fluorescence microscopy, we found that benzofurazan sulfides 1a–e reacted with one equiv of methyl N-acetyl- L-cysteine (NAC methyl ester, a small molecule thiol) to form corresponding thiol adducts 2a–e (Figure 1) in less than 5 min at room temperature except 1b which took longer time to complete the reaction. More interestingly, no reaction was observed when the sulfides reacted with 50 equiv of serine, an amino acid with -OH, -NH2, and -COOH groups, revealing that the sulfides are specific thiol labeling agents. The thiol specificity was further confirmed by inert reaction of these benzofurazan sulfides with 50 equiv of thirteen various non-thiol containing amino acids. Among these benzofurazan sulfides, 1a–c, and 1e were found to be thiol fluorogenic agents. 1d and 2d exhibit a minimal fluorescence. 1a was then selected to be fully investigated for its reaction with other small molecule thiols, protein thiols and thiols in cell homogenates. The fluorescence properties of various thiol adducts derived from 1a were characterized. Finally, 1a was demonstrated to effectively image and quantify total thiols in live cells through fluorescence microscopy. The quantification of total thiols was also validated by a reported HPLC total thiol assay method.14
Figure 1.
Synthesized benzofurazan sulfides and their corresponding thiol adducts with NAC methyl ester
2. Experimental section
The synthesis and characterization of described compounds (1a–e and 2a–e) are presented in the Supporting Information Section. The detailed procedures for characterization of benzofurazan sulfides 1a–e as thiol specific fluorogenic agents and their corresponding thiol adducts with NAC methyl ester (2a–e), determination of compounds’ chemical stability and fluorescence stability, optimal cell number and incubation length for thiol imaging in live cells, and cell viability determination are also provided in the Supporting Information Section.
For all the experiments described below, 1a was prepared as a 1 mM stock solution in acetonitrile and N-ethylmaleimide (NEM) was prepared as 1 and 10 mM stock solutions in deionized water. NEM was employed to modulate cellular thiol concentration through blocking thiols via a covalent bond.25
2.1 Thiol imaging and quantification in live cells with cellular thiol concentration modulated by NEM
NCI-H226 cells (a human lung cancer cell line from the National Cancer Institute) were plated at a density of 47500 cells/well on a 15 mm diameter microscope cover glass placed in a well of a 12-well plate in the RPMI 1640 growth medium. The cells were allowed to attach at 37 °C in a humidified atmosphere of 5% CO2 for 24 h followed by the treatment with different concentrations of NEM (5, 7, 50, and 250 µM) for 3 h. The medium was removed and washed once with 0.5 mL Tris buffer (0.1 M, pH 7.0) then replaced with 1.5 mL/well of filtered, through a 0.22 µm syringe filter, Tris buffer (0.1 M, pH 7.0) containing 1a (10 µM) in the medium. The plate was then covered by aluminum foil and incubated in a humidified atmosphere of 5% CO2 at 37 °C for 1.5 h. The medium was removed and the cells were washed once with 0.5 mL of Tris buffer (0.1 M, pH 7.0). The cover glass was carefully removed from the well with forceps and placed on a microscope slide with 10 µL of a 9:1 glycerol-PBS solution as the mounting medium. The fluorescence image was captured as 16-bit gray scale files at an exposure of 1 second for continuously 180 seconds with the 10× objective and Chroma FITC filter set on an inverted fluorescence microscope (LEICA DMI 40000B) connected to a charge-coupled device (CCD) black and white camera (QICAM B). The captured image files were processed by ImageJ, a software obtained from the website of the National Institutes of Health (http://rsbweb.nih.gov/ij/).26,27 Individual cells were segmented for quantification of fluorescence signal by setting the threshold. The average fluorescence intensity was measured with the “analyze/measure” function of the software. Average fluorescence intensity of each sample was obtained from a minimum of 40 cells/location for a minimum of 6 different locations per slide. The fluorescence from samples treated with 250 µM NEM was employed as a blank and subtracted from each sample. The reason for choosing this as a blank was based on the observation that cells treated with NEM higher than 250 µM, up to 1 mM, followed by treatment with 1a (10 µM) exhibited no further change in fluorescence intensity indicating that under the condition, 250 µM NEM had blocked all thiols in the cells and can serve as a blank.
2.2 Thiol quantification by a microplate reader using cell homogenates
NCI-H226 cells were treated the same way as described above with NEM in a 12-well plate. After washed with 0.5 mL of Tris buffer (0.1 M, pH 7.0), cells were homogenized with Tris buffer (0.1 M, pH 7.0) containing 2% SDS and 1a (100 µM). The plate was then covered by aluminum foil and shaken on a microplate shaker at room temperature at speed 6 for 5 min. The solution was transferred to a 96-well plate with each sample delivered to three wells (90 µL/well). The 96-well plate was read on a SpectraMax M2 microplate reader using 430 nm and 520 nm as λex and λem with a cutoff wavelength at 495 nm.
2.3 Validation of the microplate reader thiol quantification method by an HPLC method
NCI-H226 cells were growing the same way as described above except cells were on a 100 × 15 mm petri dish with a density of 1.5×10⁶ cells/dish. After 24 h attachment, medium was discarded and replaced with PBS containing NEM (10 µM, 50 µM, 250 µM). After 30 min, NEM solution was removed and cells were detached by trypsinization and washed with ice-cold PBS containing 1 mM EDTA (1 mL) followed by addition of 0.3 mL of ice-cold sulfosalicylic acid (3%, w/w).14 The mixture was sonicated over ice using a Misonix XL2020 sonicator for 5 min to yield cell homogenates. The cell homogenates were divided into two parts with one subjected to the microplate reader thiol quantification and the other for HPLC analysis.14
For the microplate reader thiol quantification, 3 µL of the diluted cell homogenates was transferred to a 96-well plate and followed by addition of 1a (10 µL, 1 mM), 40 µL of Tris buffer (0.1 M, pH 7.0), and 50 µL of sodium phosphate buffer (0.15 M, pH7.5). The plate was then covered by aluminum foil and shaken on a microplate shaker at room temperature at speed 6 for 5 min. The 96-well plate was read on a SpectraMax M2 microplate reader as described above. A blank was subtracted from each sample. The blank was obtained following the same procedure as above except the cells were treated with 1 mM NEM in RPMI 1640 medium for 3 h. Treatment of the 1.5 × 10⁶ cells/dish with 1 mM NEM for 3 h has been shown to completely block all thiols (data not shown) and serves as an appropriate control.
For HPLC total thiol quantification of the homogenates, a method reported earlier for the quantification of total thiols in a biological sample was used.14
3. Results and Discussion
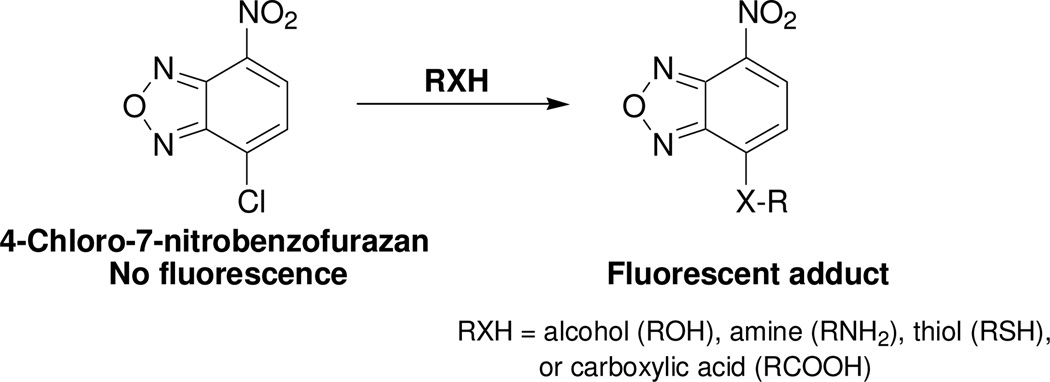
4-Chloro-7-nitrobenzofurazan (Scheme 1) has been used extensively as a fluorogenic agent for various nucleophilic functional groups such as thiols, alcohols, amines, and carboxylic acids.28–39 The broad reactivity is an advantage but also a disadvantage of the compound as a fluorogenic agent. Such a broad reactivity prevents the compound from being used to selectively detect these functional groups in live cells through fluorescence microscopy. Interestingly, in contrary to the broad reactivity of 4-chloro-7-nitrobenzofurazan, we found that benzofurazan sulfides 1a–e reacted specifically with thiols. This reaction specificity lays down the basis for using benzofurazan sulfides as thiol specific detection agents. Benzofurazan sulfides 1a–e were synthesized in one or two steps from commercially available starting materials without optimization. Their corresponding thiol adducts 2a–e were prepared from the reaction of NAC methyl ester with a corresponding sulfide (please refer to the Supporting Information Section).
Scheme 1.
4-Chloro-7-nitrobenzofurazan as a fluorogenic agent for detection of -OH, -NH2, -SH, and –COOH groups.28–39
3.1 Characterization of benzofurazan sulfides as thiol specific fluorogenic agents
Benzofurazan sulfides 1a–e were first checked for their reaction selectivity towards a thiol group vs other biologically relevant non-thiol nucleophilic functional groups, such as -OH, -NH2, and -COOH. NAC methyl ester was employed as a representative thiol molecule since it contains no other nucleophilic functional groups except the thiol group, while serine was employed as a representative molecule containing -OH, -NH2, and -COOH groups. When benzofurazan sulfides reacted with one equiv of NAC methyl ester at room temperature, the reaction completed in less than 5 min for all the sulfides except 1b which was found 65% left after 30 min. In contrary, when benzofurazan sulfides 1a–e reacted with 50 equiv of serine, no reaction was observed by HPLC/UV for up to 8 h revealing that the sulfides are thiol specific labeling agents (Scheme 2). HPLC/UV monitoring of the reaction between 1a and NAC methyl ester demonstrated that the reaction released one thiol adduct 2a and 4-sulfhydryl-7-nitro-benzofurazan; no other products were detected. When a fluorescence detector was employed, only one peak was observed in the HPLC chromatogram. The peak corresponded to 2a revealing 2a was the only fluorescent compound derived from the reaction (data not shown).
Scheme 2.
Reaction selectivity of benzofurazan sulfides toward one equiv of NAC methyl ester or 50 equiv of serine.
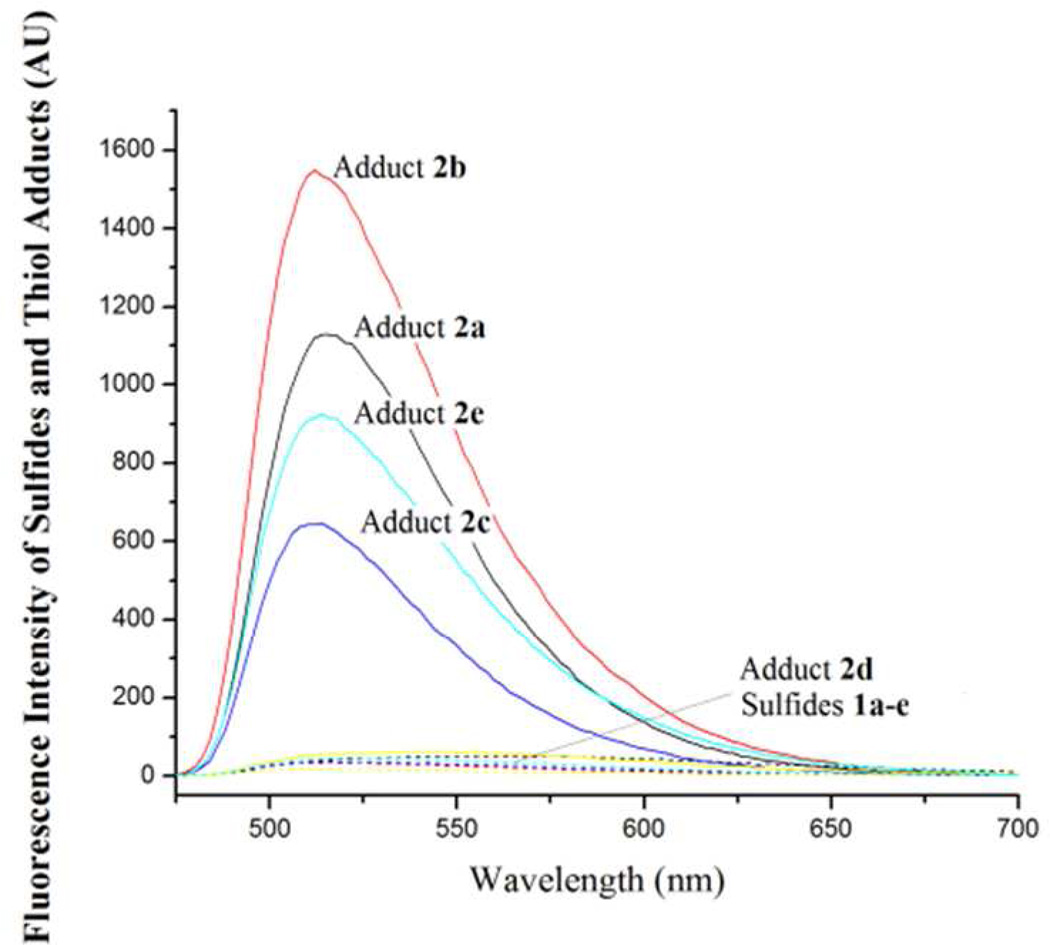
We then checked the fluorescence properties of benzofurazan sulfides 1a–e and their corresponding NAC methyl ester adducts 2a–e. All benzofurazan sulfides (1a–e) exhibit a minimal fluorescence while their thiol adducts 2a–c, and 2e exhibited strong fluorescence (Figure 2) with a maximum excitation wavelength at 430 nm for 2a and 380 nm for 2b, 2c, and 2e (data not shown) revealing that benzofurazan sulfides 1a–c, and 1e are thiol fluorogenic agents. 2d exhibited a minimum fluorescence (Figure 2) indicating 1d is not a fluorogenic agent. The maximum emission wavelengths for 2a–c and 2e were all the same that was 520 nm (Figure 2). When excited at their maximum excitation wavelengths, the relative emission intensity ratios at the maximum emission wavelength (520 nm) of 2a:2b:2c:2e were 1.0:6.5:2.1:2.4 indicating 2b exhibited the strongest fluorescence. When excited at 430 nm, the order of the emission intensity of these thiol adducts at 520 nm was 2b>2a>2e>2c (Figure 2). Based on these results, we decided to choose 1a for further investigation out of the consideration of its longer excitation wavelength (430 nm vs 380 nm) and quick reaction with a thiol. The longer wavelength can avoid fluorescence interference of endogenous compounds in cells. The rapid reaction is advantageous for thiol assays since thiols can be oxidized readily.
Figure 2.
Emission spectra of sulfides 1a–e and their corresponding thiol products with NAC methyl ester. The compounds were dissolved in acetonitrile (0.1 mM, 200 µL) in a 96-well plate. The emission spectra were obtained using 430 nm as the excitation wavelength on a SpectraMax M2 Microplate Reader. The results are expressed as the fluorescence intensity and representatives of a triplicate.
3.2 Thiol imaging and quantification in live cells with benzofurazan sulfide 1a
Before proceeding to image and quantify thiols in live cells, various factors and conditions for cellular thiol imaging were determined. We first checked the reaction rates of 1a with other small molecule thiols, protein thiols, and cell homogenate thiols and found that similar to its reaction with NAC methyl ester, benzofurazan sulfide 1a quickly reacted with one equiv of NAC, GSH, and bovine serum albumin (BSA, based on 31 thiol groups/BSA14). Ten minutes were found enough to complete the reaction since no further change in fluorescence intensity was observed after 10 min. Similar reaction rate was observed when 1a was mixed with cell homogenates. These results confirm that benzofurazan sulfide 1a can quickly react with thiols; whether they are small molecule thiols, protein thiols or thiols in cell homogenates.
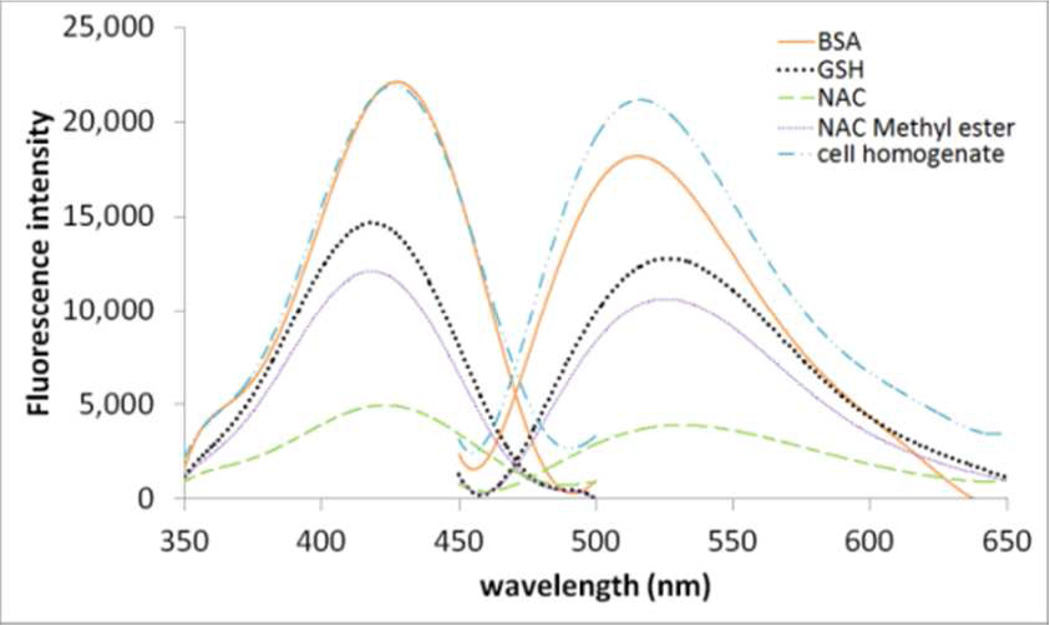
We then checked the excitation and emission spectra of thiol adducts of 1a with NAC, NAC methyl ester, GSH, BSA, and cell homogenates. As shown in Figure 3, the formed thiol adducts derived from different thiols exhibited very similar excitation and emission spectra with λex and λem at 430 nm and 520 nm respectively indicating these two wavelengths are appropriate for detection of total thiols in the biological system. However, the fluorescence sensitivity towards different thiols is different indicating that 1a can only be used for relative quantification of thiol e.g., relative to a control. Interestingly, fluorescence intensity appears to be strongest for cell homogenate thiols and weakest for NAC (Figure 3).
Figure 3.
Excitation and emission spectra of thiol adducts derived from 1a with various thiol compounds and cell homogenates. The thiol adducts’ maximum excitation and emission wavelengths for all tested compounds or cell homogenates are 430 and 520 nm respectively. The spectra were obtained on a FS900 spectrofluorometer and from a sample (3 mL) by mixing a thiol compound (20 µM) or cell homogenates (NCI-H226, 2×10⁶ cells) with 1a (10 µM) in Tris buffer (0.1 M, pH 7.0) for 10 min.
To place the fluorescence of the thiol adducts in a perspective, we determined the HPLC detection limits of 2a and the GSH thiol adduct of 1a. The detection limit was found to be <15 pmol for 2a and <25 pmol for the GSH thiol adduct. The detection limits are comparable to the detection limit for the fluorescent GSH adduct derived from monobromobimane (25 pmol), a commonly used thiol fluorescent labeling agent.40
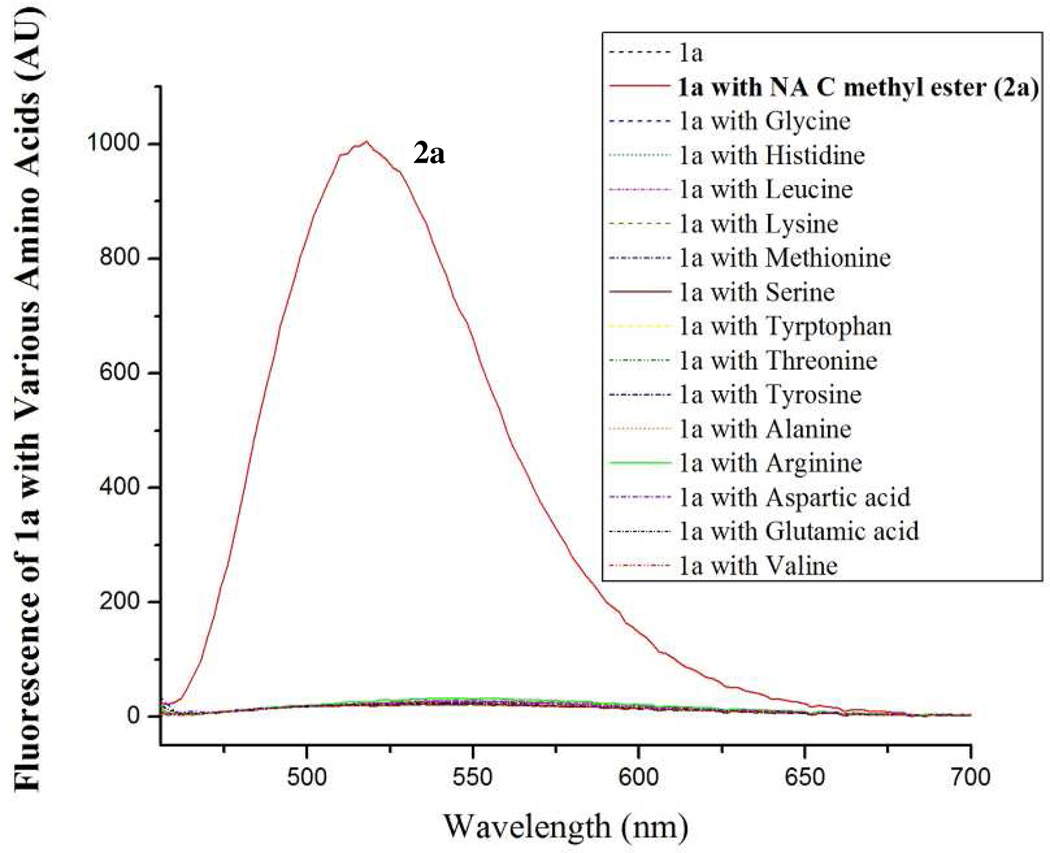
To further confirm the reaction specificity with the thiol functional group, 1a was mixed with 50 equiv of various non-thiol containing amino acids which include acidic, basic, neutral, aromatic, and aliphatic amino acids. Since the corresponding adducts with -OH, -NH2, and -COOH are known to be generated from 4-chloro-7-nitrobenzofurazan and are fluorescent (Scheme 1),28–39 a fluorescence microplate reader was used to monitor the reaction. As shown in Figure 4, 1a exhibited no significant fluorescence in the presence of 50 equiv of a non-thiol containing amino acid while substantial fluorescence was observed in the presence of 1 equiv of NAC methyl ester. The data further confirm that 1a is a thiol specific fluorogenic agent. The same experiment was conducted with benzofurazan sulfides 1b–e, no fluorescence was observed for non-thiol containing amino acids either (data not shown) confirming all synthesized benzofurazan sulfides are thiol specific.
Figure 4.
Emission spectra of sulfide 1a and the reaction mixtures of 1a with various amino acids. 1a (0.1 mM, 150 µL) in acetonitrile was mixed with an equal volume of a solution of an amino acid [5 mM in Tris buffer (0.1 M, pH 7.0) containing 2 mM EDTA], except NAC methyl ester which was made a solution of 0.1 mM, in a 96-well plate. The mixture was allowed to stand at room temperature for 10 min before subjected to fluorescence analysis. The emission spectra were obtained with the excitation wavelength at 430 nm on a SpectraMax M2 Microplate Reader. The results are expressed as the fluorescence intensity and representatives of a triplicate.
The chemical stabilities of 1a and 2a were determined. 1a (10 µM) in Tris buffer (0.1 M, pH 7.0) with 1% acetonitrile was found stable over a period of 5 h at 37 °C. The thiol adduct 2a was stable for 1 h. Various solvents were checked for appropriateness. Solvents DMSO and dimethylformamide (DMF) were found not suitable while tetrahydrofuran (THF) or acetonitrile can be used as solvent. The fluorescence of the thiol adducts, whether from small molecules or cell homogenate, were found stable as long as they were covered with aluminum foil. Fluorescence decay was observed when the sample was under microscopy with continuous light exposure. The decay rate is comparable to that of FITC, a commonly used fluorescence reagent for fluorescence microscopy.41
Due to the solubility issue and the fact that a high organic solvent concentration will affect cell viability, the concentration of 1a was limited to 10 µM in the growing medium with a final 1% of acetonitrile for imaging thiols in live cells. To identify the optimal incubation length and cell number for 10 µM 1a to image total thiols in live cells, a time course of thiol imaging and the cell number that can be imaged by 10 µM 1a were determined. It was found that when 47500 cells/mL were incubated with 10 µM 1a at 37 °C, fluorescence increased over time for 1.5 h before it reached the fluorescence plateau revealing that the reaction of 1a with thiols in intact cells was much slower than that with a small molecule thiol or denatured protein thiols. To ensure that the fluorescence plateau was a result of a complete imaging of all thiols in the cell not due to the complete consumption of 1a, 10 µM 1a was incubated with different number of cells for 1.5 h. It was found that fluorescence increased linearly over the cell number range of 20,000 to 75,000 cells/mL confirming 10 µM 1a is enough to image total thiols in 47500 cells/mL.
Finally, the viability of the cells treated with 1a at the condition employed for live cell imaging was determined by the trypan blue assay. When cells were treated with 1a (10 µM) at 37 °C for 1.5 h, 91%±6% (n=3) cell viability was observed when compared with the control indicating that 1a can be used for thiol imaging in live cells. Please refer to the Supporting Information Section for detailed presentation of the results discussed above.
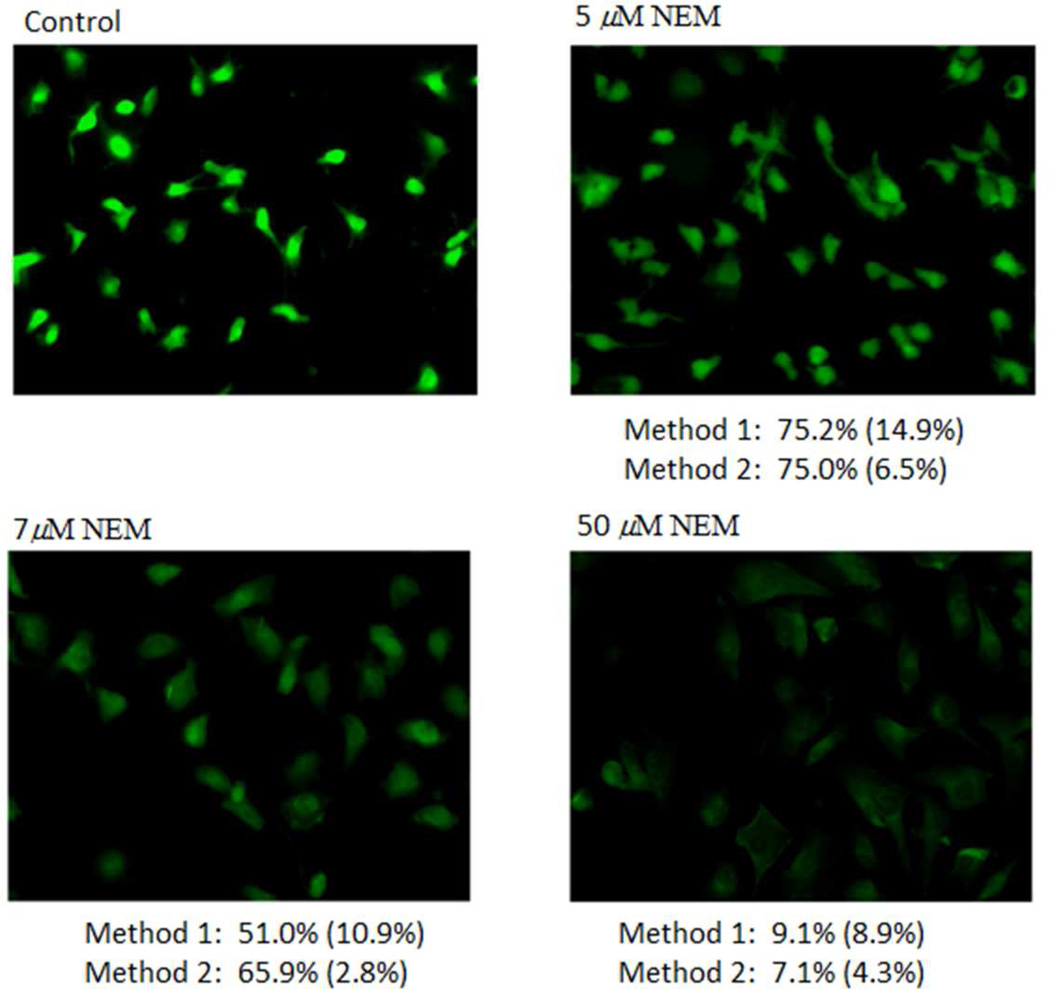
Based on the above study, incubation length of 1.5 h and a density of 47500 cells/well/mL in a 12-well plate were employed for thiol imaging and quantification. NEM was employed to modulate intracellular total thiols to check whether 1a can monitor thiol concentration change caused by NEM. Cells were incubated with different concentrations of NEM (5, 7, 50, 250 µM) for 3 h before subjected to thiol imaging with 1a. As shown in Figure 5, fluorescence intensity decreased with an increase in NEM concentration revealing that 1a can effectively be used to monitor thiol concentration change in live cells. For quantification purpose, the fluorescence images were converted to black and white images before being subjected to quantification using ImageJ software. The image obtained from cells treated with 250 µM NEM was used as a blank and subtracted from each image. The reason for choosing this as a blank was based on the observation that all thiols in the cells were blocked by 250 µM NEM, which was confirmed by the fact that no further change in fluorescence intensity was observed when cells were treated with NEM at concentrations higher than 250 µM for up to 1 mM followed by imaged with 1a (10 µM). The quantification results are presented below the images (method 1, Figure 5) and expressed as percentage of the control.
Figure 5.
Fluorescence thiol imaging and quantification by 1a in live cells. NCI-H226 cells (47500 cells/well) were treated with various concentration of NEM (5, 7, and 50 µM) for 3 h before treated with 1a (10 µM) for 1.5 h. Fluorescence images were obtained on an inverted fluorescence microscope (LEICA DMI 40000B) connected to a CCD black and white camera (QICAM B). Cells shown are representative images from replicate experiments. For total thiol quantification, method 1 quantified thiols through the fluorescence images obtained from live cell thiol imaging and expressed as percentage of the control; method 2 quantified thiols using corresponding cell lysates, derivatized by 100 µM 1a for 5 min before fluorescence measurement on a fluorescence microplate reader. The fluorescence from samples treated with 250 µM NEM followed by treatment of 1a (10 µM for method 1 or 100 µM for method 2) was employed as a blank and subtracted from all samples in both methods.
3.3 Thiol quantification by a microplate reader using cell homogenates
To determine the accuracy of the quantification by images, we then cross-checked the quantification through the use of corresponding cell lysates with a fluorescence microplate reader. Cells lysates in a 12-well plate were treated with 1a (100 µM) and the fluorescence was obtained using a fluorescence plate reader. A higher concentration of 1a, 100 µM instead of 10 µM, was used since higher acetonitrile (10%) increases the solubility of 1a and can be used for cell lysates. Since the cells were lysed and proteins were denatured, the derivatization of thiols by 1a in lysed cells took only 5 min. The quantification results match well with the quantification data from cell images (method 2, Figure 5).
3.4 Validation of the microplate reader thiol quantification method by an HPLC method
To confirm that the quantification obtained by the plate reader is a valid quantification method, we then validated the plate reader method with a reported HPLC quantification method for total thiol determination.14 Since the assay by HPLC requires more samples, more cells (1.5 × 10⁶ cells) were employed. It was noted that thiol depletion effects by NEM were less profound in the presence of higher cell number. To achieve enough thiol depletion, higher NEM concentrations (10, 50, 250 µM) were used. Also, since the objective was to validate two analytical methods, cells were incubated with NEM for only 30 min instead of 3 h described earlier for cell thiol imaging. After treated with NEM, cells were homogenized under an acidic condition by a sonicator as described by Chen and co-workers.14 The acidic cell homogenates were divided into two parts with one for fluorescence quantification in a 96-well plate using 1a (100 µM) as the thiol labeling agent while the other subjected to total thiol quantification by the HPLC method.14
For the 96-well plate reader assay, fluorescence reading from the cells treated with 1 mM NEM followed by treatment of 1a (100 µM) were served as a blank and subtracted from all samples. 1 mM NEM was found high enough to block all thiols (data not shown).
Table 1 presents a comparison of the quantification by these two methods. Although the results from the two methods are not exactly the same, they are within 10% deviation confirming that the 96-well plate method is a valid method for the quantification of total thiol in cells which indirectly confirms that the quantification through live cell thiol images using fluorescence microscopy is also valid.
Table 1.
Validation of the 96-well plate thiol quantification method (method A) by an HPLC method (method B).14 NCI-H226 cells (1.5×10⁶) were treated with NEM for 30 min followed by homogenization. The homogenates were divided into two parts with one part quantified by method A and the other by method B.
| Assay methods | Total thiols in cells treated with NEM (% of the control) |
||
|---|---|---|---|
| NEM 10 (µM) | NEM 50 (µM) | NEM 250 (µM) | |
| Method A | 87.9% ± 1.7% | 46.2% ± 2.9% | 34.3 ± 1.5% |
| Method B | 96.9% | 36.2% | 25.1% |
In summary, we have identified benzofurazan sulfides 1a–e as thiol specific labeling agents. These sulfides can be readily prepared from commercially available starting materials. The sulfides 1a–c and 1e are also thiol specific fluorogenic agents. Considering thiols’ essential roles in various biochemical processes and the fact that their concentrations are affected by various factors, these agents are valuable in real-time monitoring of thiol density change in live cells.
Supplementary Material
Acknowledgments
The authors would like to thank Professor Adam Hoppe and Mrs. Jieqiong Lou of the Chemistry and Biochemistry Department and Professor Michael Hildreth of Biology and Microbiology for technical assistance in fluorescence microscopy experiments. The authors would also like to acknowledge Professor Xingzhong Yan of Electrical Engineering and Computer Science for valuable discussion related to fluorescence properties. This work was supported by a grant from the National Institutes of Health (GM093678-01).
Footnotes
Conflict of Interest Disclosure
The authors declare no competing financial interest.
References
- 1.Haugaard N. Ann N Y Acad Sci. 2000;899:148–158. doi: 10.1111/j.1749-6632.2000.tb06183.x. [DOI] [PubMed] [Google Scholar]
- 2.Moriarty-Craige SE, Jones DP. Annu Rev Nutr. 2004;24:481–509. doi: 10.1146/annurev.nutr.24.012003.132208. [DOI] [PubMed] [Google Scholar]
- 3.Coulter CV, Kelso GF, Lin TK, Smith RA, Murphy MP. Free Radic Biol Med. 2000;28:1547–1554. doi: 10.1016/s0891-5849(00)00255-0. [DOI] [PubMed] [Google Scholar]
- 4.Rigobello MP, Folda A, Scutari G, Bindoli A. Arch Biochem Biophys. 2005;441:112–122. doi: 10.1016/j.abb.2005.07.007. [DOI] [PubMed] [Google Scholar]
- 5.Rebrin I, Sohal RS. Exp Gerontol. 2004;39:1513–1519. doi: 10.1016/j.exger.2004.08.014. [DOI] [PMC free article] [PubMed] [Google Scholar]
- 6.Shipounova IN, Svinareva DA, Petrova TV, Lyamzaev KG, Chernyak BV, Drize NI, Skulachev VP. Mech Ageing Dev. 2010;131:415–421. doi: 10.1016/j.mad.2010.06.003. [DOI] [PubMed] [Google Scholar]
- 7.Nakamura T, Lipton SA. Apoptosis. 2010;15:1354–1363. doi: 10.1007/s10495-010-0476-x. [DOI] [PMC free article] [PubMed] [Google Scholar]
- 8.Tietze F. Anal Biochem. 1969;27:502–522. doi: 10.1016/0003-2697(69)90064-5. [DOI] [PubMed] [Google Scholar]
- 9.Shimada K, Mitamura K. J Chromatogr B Biomed Appl. 1994;659:227–241. doi: 10.1016/0378-4347(93)e0444-u. [DOI] [PubMed] [Google Scholar]
- 10.Fu NN WH, Li ML, Zheng GJ, Zhang HS, Liang SC. Anal Lett. 2005;38:791–802. [Google Scholar]
- 11.Maeda H, Matsuno H, Ushida M, Katayama K, Saeki K, Itoh N. Angew Chem Int Ed Engl. 2005;44:2922–2925. doi: 10.1002/anie.200500114. [DOI] [PubMed] [Google Scholar]
- 12.Chen SJ, Chang HT. Anal Chem. 2004;76:3727–3734. doi: 10.1021/ac049787s. [DOI] [PubMed] [Google Scholar]
- 13.Wang W, Rusin O, Xu X, Kim KK, Escobedo JO, Fakayode SO, Fletcher KA, Lowry M, Schowalter CM, Lawrence CM, Fronczek FR, Warner IM, Strongin RM. J Am Chem Soc. 2005;127:15949–15958. doi: 10.1021/ja054962n. [DOI] [PMC free article] [PubMed] [Google Scholar]
- 14.Chen W, Zhao Y, Seefeldt T, Guan X. J Pharm Biomed Anal. 2008;48:1375–1380. doi: 10.1016/j.jpba.2008.08.033. [DOI] [PMC free article] [PubMed] [Google Scholar]
- 15.Durocher S, Rezaee A, Hamm C, Rangan C, Mittler S, Mutus B. J Am Chem Soc. 2009;131:2475–2477. doi: 10.1021/ja808548x. [DOI] [PubMed] [Google Scholar]
- 16.Park CW, Rhee YS, Vogt FG, Hayes D, Jr, Zwischenberger JB, Deluca PP, Mansour HM. Adv Drug Deliv Rev. 2012;64:344–356. doi: 10.1016/j.addr.2011.08.004. [DOI] [PubMed] [Google Scholar]
- 17.Lippincott-Schwartz J. Annu Rev Biochem. 2011;80:327–332. doi: 10.1146/annurev-biochem-121010-125553. [DOI] [PMC free article] [PubMed] [Google Scholar]
- 18.Hedley DW, Chow S. Cytometry. 1994;15:349–358. doi: 10.1002/cyto.990150411. [DOI] [PubMed] [Google Scholar]
- 19.Ahn YH, Lee JS, Chang YT. J Am Chem Soc. 2007;129:4510–4511. doi: 10.1021/ja068230m. [DOI] [PubMed] [Google Scholar]
- 20.Tang B, Xing Y, Li P, Zhang N, Yu F, Yang G. J Am Chem Soc. 2007;129:11666–11667. doi: 10.1021/ja072572q. [DOI] [PubMed] [Google Scholar]
- 21.Shibata A, Furukawa K, Abe H, Tsuneda S, Ito Y. Bioorg Med Chem Lett. 2008;18:2246–2249. doi: 10.1016/j.bmcl.2008.03.014. [DOI] [PubMed] [Google Scholar]
- 22.Lee MH, Han JH, Kwon PS, Bhuniya S, Kim JY, Sessler JL, Kang C, Kim JS. J Am Chem Soc. 2012;134:1316–1322. doi: 10.1021/ja210065g. [DOI] [PubMed] [Google Scholar]
- 23.Pullela PK, Chiku T, Carvan MJ, 3rd, Sem DS. Anal Biochem. 2006;352:265–273. doi: 10.1016/j.ab.2006.01.047. [DOI] [PubMed] [Google Scholar]
- 24.Hansen JM, Go YM, Jones DP. Annu Rev Pharmacol Toxicol. 2006;46:215–234. doi: 10.1146/annurev.pharmtox.46.120604.141122. [DOI] [PubMed] [Google Scholar]
- 25.Lee JH, Lim CS, Tian YS, Han JH, Cho BR. J Am Chem Soc. 2010;132:1216–1217. doi: 10.1021/ja9090676. [DOI] [PubMed] [Google Scholar]
- 26.Collins TJ. Biotechniques. 2007;43:25–30. doi: 10.2144/000112517. [DOI] [PubMed] [Google Scholar]
- 27.Gavet O, Pines J. Dev Cell. 2010;18:533–543. doi: 10.1016/j.devcel.2010.02.013. [DOI] [PMC free article] [PubMed] [Google Scholar]
- 28.Uchiyama S, Santa T, Imai K. Anal Chem. 2001;73:2165–2170. doi: 10.1021/ac001232j. [DOI] [PubMed] [Google Scholar]
- 29.Uchiyama S, Santa T, Okiyama N, Fukushima T, Imai K. Biomed Chromatogr. 2001;15:295–318. doi: 10.1002/bmc.75. [DOI] [PubMed] [Google Scholar]
- 30.Uchiyama S, Santa T, Suzuki S, Yokosu H, Imai K. Anal Chem. 1999;71:5367–5371. doi: 10.1021/ac9905120. [DOI] [PubMed] [Google Scholar]
- 31.Huang CZ, Santa T, Imai K. Analyst. 2002;127:741–747. doi: 10.1039/b201023m. [DOI] [PubMed] [Google Scholar]
- 32.Buldt A, Karst U. Anal Chem. 1999;71:1893–1898. doi: 10.1021/ac980946f. [DOI] [PubMed] [Google Scholar]
- 33.Buldt A, Karst U. Anal Chem. 1999;71:3003–3007. doi: 10.1021/ac981330t. [DOI] [PubMed] [Google Scholar]
- 34.Vogel A. 4-(4-Benzofurazanyl)- and 4-(2,1,3-benzothiadiazol-4-yl)-1,4-dihydro-3,5- pyridinedicarboxylates. German Patent DE 3542363, June 12, 1986 [Google Scholar]
- 35.Meyer J, Buldt A, Vogel M, Karst U. Angew Chem Int Ed Engl. 2000;39:1453–1455. doi: 10.1002/(sici)1521-3773(20000417)39:8<1453::aid-anie1453>3.0.co;2-7. [DOI] [PubMed] [Google Scholar]
- 36.Ghosh PB, Whitehouse MW. Biochem J. 1968;108:155–156. doi: 10.1042/bj1080155. [DOI] [PMC free article] [PubMed] [Google Scholar]
- 37.Toyo'oka T, Ishibashi M, Takeda Y, Nakashima K, Akiyama S, Uzu S, Imai K. J Chromatogr. 1991;588:61–71. doi: 10.1016/0021-9673(91)85008-4. [DOI] [PubMed] [Google Scholar]
- 38.Toyo'oka T, Suzuki T, Saito Y, Uzu S, Imai K. Analyst. 1989;114:413–419. doi: 10.1039/an9891400413. [DOI] [PubMed] [Google Scholar]
- 39.Toyooka T IK. Anal. Chem. 1984;56:2461–2464. [Google Scholar]
- 40.Cotgreave IA, Moldeus P. J Biochem Biophys Methods. 1986;13:231–249. doi: 10.1016/0165-022x(86)90102-8. [DOI] [PubMed] [Google Scholar]
- 41.Longin A, Souchier C, Ffrench M, Bryon PA. J Histochem Cytochem. 1993;41:1833–1840. doi: 10.1177/41.12.8245431. [DOI] [PubMed] [Google Scholar]
Associated Data
This section collects any data citations, data availability statements, or supplementary materials included in this article.


