Abstract
C-arm X-ray fluoroscopy-based radioactive seed localization for intraoperative dosimetry of prostate brachytherapy is an active area of research. The fluoroscopy tracking (FTRAC) fiducial is an image-based tracking device composed of radio-opaque BBs, lines, and ellipses that provides an effective means for pose estimation so that three-dimensional reconstruction of the implanted seeds from multiple X-ray images can be related to the ultrasound-computed prostate volume. Both the FTRAC features and the brachytherapy seeds must be segmented quickly and accurately during the surgery, but current segmentation algorithms are inhibitory in the operating room (OR). The first reason is that current algorithms require operators to manually select a region of interest (ROI), preventing automatic pipelining from image acquisition to seed reconstruction. Secondly, these algorithms fail often, requiring operators to manually correct the errors. We propose a fast and effective ROI-free automatic FTRAC and seed segmentation algorithm to minimize such human intervention. The proposed algorithm exploits recent image processing tools to make seed reconstruction as easy and convenient as possible. Preliminary results on 162 patient images show this algorithm to be fast, effective, and accurate for all features to be segmented. With near perfect success rates and subpixel differences to manual segmentation, our automatic FTRAC and seed segmentation algorithm shows promising results to save crucial time in the OR while reducing errors.
Keywords: segmentation, localization, C-arm, X-ray, fiducial, prostate brachytherapy
1 INTRODUCTION
Prostate cancer is the most commonly diagnosed cancer among men in the United States [1], demonstrating an undeniable need to improve treatment for prostate cancer patients. There are several treatments for prostate cancer, among which prostate brachytherapy is known to be one of the most common. This procedure involves the permanent implantation of rice-sized radioactive sources known as seeds into the prostate to irradiate tumors. Prostate brachytherapy is traditionally guided by transrectal ultrasound (TRUS), but since TRUS is unable to visualize the seeds well, one of the major current limitations of this system is the inability to localize seeds in relation to the prostate [2]. Such an inability inhibits real-time dosimetry, thus preventing the surgeon from intraoperatively correcting the seed placement plan due to inevitable placement inaccuracies and seed migration. This results in a suboptimal operation, leading to either insufficient radiation to the tumor or side effects due to unnecessary dose to healthy tissue.
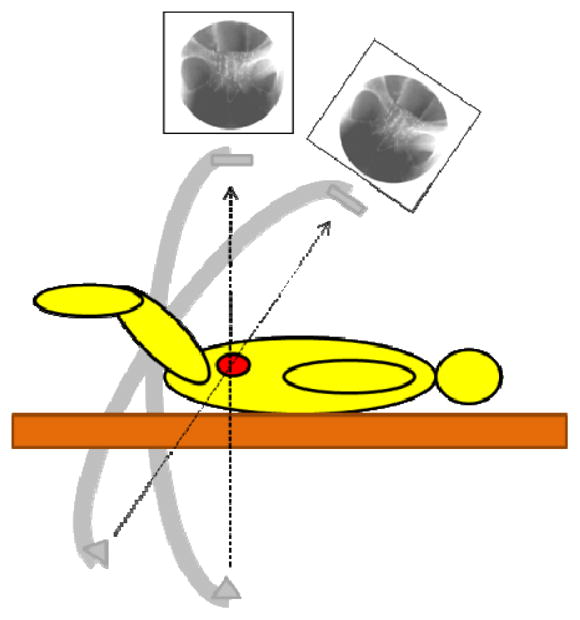
In order to overcome this limitation, systems that use both TRUS and C-arm X-ray have been proposed for intraoperative dosimetry of prostate brachytherapy. While TRUS provides the means to visualize the prostate, X-ray conveniently provides the means to visualize the seeds. However, three-dimensional localization in this system poses a few challenges. First, seeds need to be reconstructed to obtain three-dimensional coordinates from two-dimensional X-ray images. Since most C-arms in the OR do not have encoded joints to identify the X-ray source position of each image, reconstruction requires a tracking method for C-arm pose recovery (see Figure 1). Secondly, TRUS and X-ray need to be registered in order to visualize the reconstructed seeds in relation to the prostate. This requires some mutual feature that would allow the fusing of TRUS and X-ray images.
Figure 1.

Diagram of a C-arm in two poses centered on the prostate. Pose recovery is required for reconstruction.
There are many potential solutions to address either of these two challenges. Pose recovery needed for reconstruction could be solved by the myriad of trackers currently available, including optical trackers, electromagnetic (EM) trackers, or radio-opaque fiducials [3–5]. However, each of these tools increases overall cost and has additional drawbacks, as optical trackers require a line-of-sight from camera to marker which would be cumbersome in the OR, EM trackers are susceptible to EM distortion caused by metal objects like the C-arm, and most radio-opaque fiducials are either too large or too inaccurate to be used for prostate brachytherapy y. There are several methods to address the issue of registration as well, such as placing a thin metal wire in the catheter [6], implanting gold marker seeds in the prostate [7], or inserting implant needles as a fiducial [8]. Unfortunately, in all these cases, registration can prove unreliable due to movement of these markers.
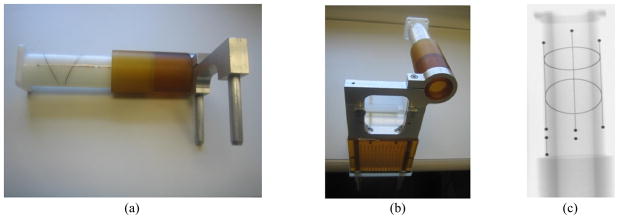
On the other hand, the FTRAC [9] (see Figure 2) provides an effective means to simultaneously solve both challenges of pose recovery and registration. It is a 4x4x8 cm radio-opaque tracking fiducial consisting of 9 beads (known as BBs), 3 lines, and 2 ellipses. The FTRAC offers a robust image-based technique for C-arm pose recovery, boasting accuracies of 0.56 mm in translation and 0.33° in rotation while overcoming the line-of-sight limitation of optical trackers and the distortion susceptibilities of electromagnetic trackers. At the same time, it allows for the registration of X-ray images to TRUS, since it is rigidly attached to the needle insertion template which is registered to TRUS through preoperative calibration. Three-dimensional localization is therefore possible when the FTRAC is positioned outside but close to the body so the FTRAC and brachytherapy seeds are in the X-ray field of view. However, as for any image based tracking fiducial, a significant drawback to this setup is that the FTRAC complicates segmentation in X-ray images. Not only do the seeds need to be segmented from each image but also all the features of the FTRAC.
Figure 2.
Images of the FTRAC (a) photograph of FTRAC alone (b) photograph of FTRAC mounted to template (c) X-ray image.
As the FTRAC is composed of BBs, lines and ellipses, there are many existing blob, line and ellipse detection techniques that could potentially segment the FTRAC if used together. There is also plenty of existing seed segmentation algorithms [10, 11] that can likewise be used for this application. However, due to the abundant number of convoluting features existing in a single X-ray image, such algorithms prove ineffective when processing the entire image. Operators are thus required to select regions of interests (ROIs) for both the FTRAC and the seeds before automatic segmentation can even begin. Even so, existing FTRAC and seed segmentation algorithms [12, 13] still fail often since they are unacceptably sensitive to noise, necessitating extra minutes in manual correction. This significantly impedes the workflow of the brachytherapy operation, where time is crucial and human errors are likely.
In this work, we propose a robust ROI-free algorithm for the simultaneous automatic segmentation of the FTRAC and the seeds. The purpose of this work is to 1) minimize the need of operator intervention to allow for automatic processing and pipelining from image acquisition to seed reconstruction, and 2) improve upon existing FTRAC and seed segmentation algorithms for accurate three-dimensional seed localization.
2 METHOD
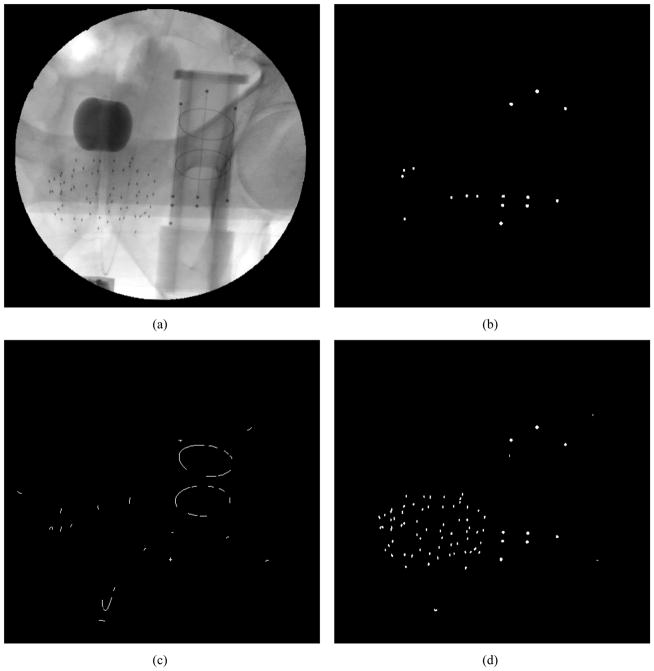
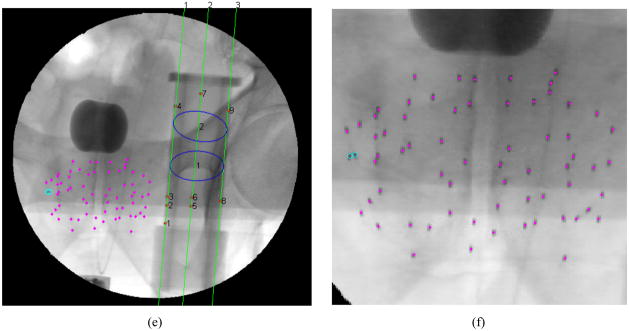
There are four types of features that need to be segmented from a single prostate brachytherapy X-ray image: 1) the 9 FTRAC BBs, 2) the 3 FTRAC lines, 3) the 2 FTRAC ellipses, and 4) the brachytherapy seeds, which can number as many as 150 [see Figure 3(a)]. The proposed algorithm therefore inputs a single image and outputs the coordinates and/or the equations of all of these features that can then be visualized over the original image [see Figure 3(e)]. The outputted FTRAC features are also appropriately labeled since this is a requirement for the optimization method used for pose estimation. We make the following assumptions: 1) the X-ray image has been corrected for geometric distortion; 2) all the features of the FTRAC and all the seeds are visible in the field of view; 3) the FTRAC is oriented upright; 4) the FTRAC and seeds do not overlap; and 5) the TRUS probe is not in the field of view. All of these assumptions are perfectly reasonable and have been validated in a previous clinical trial. Mathematical morphology [14] is heavily incorporated in this algorithm, including openings, reconstructions, and top-hat operations.
Figure 3.
Images of the segmentation algorithm (a) original image; (b) binary image for BBs and lines segmentation; (c) binary image for ellipse segmentation; (d) binary image for seed segmentation; (e) final segmented image; (f) close up of seeds in final segmented image with magenta dots signifying single seeds and cyan circles signifying possible clusters
2.1 BBs and Lines
In the first stage, the BBs and lines are simultaneously segmented. The idea to this simultaneous approach is that the BBs and lines give information regarding each other, since the BBs lie on the lines and the lines lie on the BBs.
To segment both feature types, the inputted grayscale image is first complemented so the seeds and FTRAC features are bright. This is followed by a morphological top-hat by reconstruction operation (the subtraction of an image by the reconstruction of its opening). This result is automatically thresholded by Otsu’s threshold [15] to extract a binary image of the 9 BBs and similar appearing single or overlapping seeds (also known as clusters). Obvious seeds are then filtered out by size and eccentricity leaving the BBs and a few remaining clusters [see Figure 3(b)]. The Hough transform [16] is then used to identify all the possible lines that pass through these BBs and clusters. Since the BBs lie on the 3 parallel and roughly vertical lines of the FTRAC, these 3 lines are easily selected from among the many candidate lines identified by the Hough transform. Once the 3 lines are identified, the 9 BBs are then filtered from the clusters. Since it is assumed that the FTRAC is oriented upright, the features are then sorted so it is clear which coordinates belong to a particular BB, and which equation belongs to a particular line.
2.2 Ellipses
In the second stage, the ellipses in the FTRAC are identified. With BBs and lines already segmented, it becomes easier to localize the 2 FTRAC ellipses since all the FTRAC features are located in the same approximate region. Moreover, it is now easier to define which edges are truly ellipse edges, when previously, some of the line edges would easily seem to be ellipse edges.
The first step to segmenting ellipses is to obtain an edge map of the ellipse edges. The Canny edge detector would seem to be the obvious choice for this task, but since the FTRAC ellipses are made of wire rather than a metal sheet, the Canny detector [1] gives the undesirable result of double edges. As an alternative, a binary image is formed using a morphological top-hat operation of the complemented X-ray. Once automatically thresholded, this produces the desired edge map of single ellipse edges along with line edges and some noise. Since the FTRAC lines are now known, the middle FTRAC line is removed from the image so that it does not interfere with the later ellipse fitting algorithm. The noise is then filtered by a morphological opening followed by a binary area opening. After thinning to reduce computational complexity [see Figure 3(c)], the ellipses are then detected from the binary image using the RANSAC algorithm [17] augmented by both the numerically stable ellipse fitting algorithm developed by Halir and Flusser [18] and the point-to-ellipse distance calculation algorithm described by Xie and Ohya[19]. Since the approximate regions of the FTRAC ellipses are determined by the lines and BBs, the edge pixels of each of the 2 ellipses are input into this RANSAC-based ellipse segmentation algorithm, finally yielding the equations of the 2 FTRAC ellipses. Assuming the FTRAC is oriented upright, the lower ellipse is then easily labeled as ellipse 1 and the upper ellipse is labeled as ellipse 2.
2.3 Seeds
Lastly, the seeds are segmented from the image. Without the previous steps, BBs and other small dark regions of the FTRAC would be falsely identified as seeds. However, with the FTRAC now completely localized, the algorithm can now accurately determine the coordinates of the true seeds.
Seed segmentation starts with a morphological top-hat by reconstruction algorithm applied to the complemented image. The resulting image is automatically thresholded (Otsu’s method), leaving a binary image of seeds, BBs, and some noise. Much of the noise is then filtered by a binary area opening operation [see Figure 3(d)]. Since it is assumed that the FTRAC and seeds do not overlap, the FTRAC region is removed from the image, leaving the seeds. To further remove false positives, spurious seed-like objects greater than a threshold distance from the dense seed cloud are removed. Using connected component labeling [20], the two-dimensional seed coordinates are then determined by the centroids of the regional maxima in each connected region.
As an added feature, this algorithm also identifies which connected regions are likely to be overlapping seeds [see Figure 3(f)]. This is desirable in that it directs the user’s attention to specific cluster regions in the image for closer inspection, while also preparing for automatic cluster division should such an algorithm be needed. At this point, this algorithm does not automatically divide clusters since the seed detection rate is already high and many current reconstruction algorithms can handle “hidden” seeds reasonably well [21–23]. To identify clusters, we simply calculate the sum of the intensities (or the double integral) in each region as our metric. Any region with a sum greater than twice the median sum is classified as a cluster.
3 RESULTS
To evaluate this algorithm, 206 distortion corrected clinical prostate brachytherapy X-ray images containing both the FTRAC and various totals of brachytherapy seeds were used as a dataset. The results of the proposed algorithm were compared to computer-assisted manual segmentation of the FTRAC and manually corrected automatic segmentation of the seeds. In the computer-assisted manual segmentation of the FTRAC, the BBs are segmented by choosing the nearest darkest points to the user’s mouse clicks, the lines are determined by performing least squares fitting of the 5 points per line that the user selects, and the ellipses are likewise calculated by least squares fitting of the 7 points per ellipse that the user selects. The seed locations are computed by a segmentation algorithm requiring a ROI [13], after which the user manually corrects any errors. Segmentation of both the FTRAC and the seeds in the proposed algorithm required 5 seconds per image on average. Results were obtained using a PC with a 2.33 GHz Intel Core 2 Duo processor.
3.1 FTRAC
Of the 206 images in our dataset, 44 images did not have the FTRAC fully in the field of view and therefore failed to satisfy the first 4 assumptions needed for automatic FTRAC segmentation. Among the remaining 162 clinical images, 152 were successfully segmented by our algorithm, giving a 93.8% success rate. The differences between successful automatic FTRAC segmentation and manual FTRAC segmentation are summarized in Tables 1–4.
Table 1.
BB Segmentation Differences mean ± standard deviation
| BB # | Coordinates (mm) |
|---|---|
| 1 | 0.2141 ±0.1210 |
| 2 | 0.2108 ±0.1271 |
| 3 | 0.2042±0.1250 |
| 4 | 0.2325±0.1282 |
| 5 | 0.2055±0.1121 |
| 6 | 0.2296±0.1387 |
| 7 | 0.2377±0.1399 |
| 8 | 0.2594±0.1507 |
| 9 | 0.2112±0.1225 |
Table 4.
Pose Estimation Differences mean ± standard deviation
| Rotation angle (degrees) | x (mm) | y (mm) | z (mm) |
|---|---|---|---|
| 0.4186±0.4737 | 0.0942±0.0842 | 0.0774±0.0824 | 1.6112±1.3558 |
The differences in these tables were calculated as follows. For all the following calculations, let the subscripts m and a represent the manual and automatic segmentations, respectively. BB segmentation differences are calculated using the equation √((xm − xa)2 + (ym − ya)2), where (x, y) are the coordinates of an BB. For line segmentation differences, let ρ and θ represent the parameters for the equation of a line, such that
The difference in perpendicular length to origin is |ρm − ρa| and the difference in angle is |θm − θa|. For ellipse segmentation differences, let h, k, a, b, θ be the parameters for the equation of an ellipse, such that
The difference in center position is calculated as √((hm − ha)2 + (km − ka)2), the difference in major axis is |am − aa|, the difference in minor axis is |bm − ba|, and the difference in orientation is |θm − θa|. Finally, for pose estimation differences, pose is generally given in the homogeneous form
where rij represents entries in the rotation matrix, R, and ti represents entries in the translation vector, T. Difference in rotation angle is thus computed as , and translation difference is computed as |tm − ta| for x, y, and z.
3.2 Seeds
Of the 152 successfully automatically segmented FTRAC clinical images, 13 included the TRUS probe in the field of view, violating the last assumption and thereby interfering with seed segmentation. Among the remaining 139 images, 7337 seeds were correctly segmented in our algorithm, compared to 7475 manually corrected segmented seeds, giving a 98.15% automatic detection rate. However, 50 seeds were falsely detected, resulting in a false positive rate of 0.67%.
4 CONCLUSIONS
In this work, we proposed a ROI-free automatic segmentation algorithm of the FTRAC and the seeds that 1) minimizes the need of operator intervention, making feasible pipelining from image acquisition to seed reconstruction, and 2) improves upon existing FTRAC and seed segmentation algorithms for accurate three-dimensional seed localization. Although FTRAC and seed segmentation algorithms have been previously proposed, none present a fully automatic ROI-free algorithm that is effective in simultaneously segmenting both the FTRAC and the seeds. Having such a segmentation algorithm improves the practicality of the FTRAC, which has proven more effective than other competing methods in solving both the reconstruction and registration issues associated with the TRUS/X-ray system. This work also strengthens the prospect of using both TRUS and X-ray to guide prostate brachytherapy in the OR, eliminating the current limitation of the TRUS system in being unable to localize seeds in relation to the prostate. Although this segmentation algorithm is just one part of the whole, it plays an undeniably essential role in providing accurate intraoperative dosimetry, allowing the surgeon to update his seed placement plan in the OR, and ultimately provide more effective treatment of prostate cancer.
Table 2.
Line Segmentation Differences mean ± standard deviation
| Line # | Perpendicular Length to Origin (mm) | Angle (degrees) |
|---|---|---|
| 1 | 0.3728±0.3079 | 0.2121±0.1794 |
| 2 | 0.3517±0.3245 | 0.2378±0.1982 |
| 3 | 0.5040±0.3711 | 0.2964±0.2349 |
Table 3.
Ellipse Segmentation Differences mean ± standard deviation
| Ellipse # | Center (mm) | Major axis (mm) | Minor axis (mm) | Orientation (degrees) |
|---|---|---|---|---|
| 1 | 0.2626±0.3075 | 0.1667±0.2064 | 0.1258±0.3195 | 0.6181±0.6812 |
| 2 | 0.2759±0.2100 | 0.1821±0.1939 | 0.1347±0.1417 | 0.8440±1.0356 |
References
- 1.Jemal A, Siegel R, Ward E, Hao Y, Xu J, Thun MJ. Cancer statistics, 2009. CA: A Cancer Journal for Clinicians. 2009;59:225–249. doi: 10.3322/caac.20006. [DOI] [PubMed] [Google Scholar]
- 2.Nag S, Ciezki JP, Cormack R, Doggett S, DeWyngaert K, Edmundson GK, Stock RG, Stone NN, Yu Y, Zelefsky MJ. Intraoperative planning and evaluation of permanent prostate brachytherapy: Report of the american brachytherapy society. International Journal of Radiation Oncology Biology Physics. 2001;51(5):1422–1430. doi: 10.1016/s0360-3016(01)01616-9. [DOI] [PubMed] [Google Scholar]
- 3.Siddon R, Barth N. Stereotaxic localization of intracranial targets. International Journal of Radiation Oncology Biology Physics. 1987;13(8):1241–1246. doi: 10.1016/0360-3016(87)90201-x. [DOI] [PubMed] [Google Scholar]
- 4.Phillips R, Mohsen A, Viant W, Malek S, Li Q, Shah N, Bielby M, Sherman K. A phantom based approach to fluoroscopic navigation for orthopaedic surgery. Lecture Notes in Computer Science. 2004;621 [Google Scholar]
- 5.Zhang M, Zaider M, Worman M, Cohen G. On the question of 3d seed reconstruction in prostate brachytherapy: the determination of x-ray source and film locations. Physics in Medicine and Biology. 2004;49:N335–N345. doi: 10.1088/0031-9155/49/19/n03. [DOI] [PubMed] [Google Scholar]
- 6.Wallner K, Roy J, Zelefsky M, Fuks Z, Harrison L. Fluoroscopic visualization of the prostatic urethra to guide transperineal prostate implantation. International Journal of Radiation Oncology Biology Physics. 1994;29(4):863–867. doi: 10.1016/0360-3016(94)90577-0. [DOI] [PubMed] [Google Scholar]
- 7.Baird MC, Holt RW, Selby TL. Improvement of transperineal implant dosimetry by intraoperative cystoscopic confirmation of prostate anatomy. The Journal of Urology. 2000;164(2):406. [PubMed] [Google Scholar]
- 8.Gong L, Cho PS, Han BH, Wallner KE, Sutlief SG, Pathak SD, Haynor DR, Kim Y. Ultrasonography and fluoroscopic fusion for prostate brachytherapy dosimetry. International Journal or Radiation Oncology Biology Physics. 2002;54(5):1322. doi: 10.1016/s0360-3016(02)03754-9. [DOI] [PubMed] [Google Scholar]
- 9.Jain AK, Mustafa T, Zhou Y, Burdette C, Chirikjian GS, Fichtinger G. Ftrac - a robust fluoroscope tracking fiducial. Medical Physics. 2005;32(10):3185–3198. doi: 10.1118/1.2047782. [DOI] [PubMed] [Google Scholar]
- 10.Tubic D, Zaccarin A, Pouliot J, Beaulieu L. Automated seed detection and three-dimensional reconstruction. i. seed localization from fluoroscopic images or radiographs. Medical Physics. 2001;28(11):2265–2271. doi: 10.1118/1.1414308. [DOI] [PubMed] [Google Scholar]
- 11.Su Y, Davis BJ, Herman MG, Robb RA. Prostate brachytherapy seed localization by analysis of multiple projections: identifying and addressing the seed overlap problem. Medical Physics. 2004;31(5):1277–1287. doi: 10.1118/1.1707740. [DOI] [PubMed] [Google Scholar]
- 12.Vikal S, Jain A, Deguet A, Song DY, Fichtinger G. Automated segmentation of radiographic fiducials for c-arm tracking. Conference of American Association of Physicists in Medicine, Journal of Medical Physics Abstract in Medical Physics. 2006;33(6):2208. [Google Scholar]
- 13.Vikal S, Jain A, Deguet A, Song DY, Fichtinger G. Seed segmentation in C-arm fluoroscopy for brachytherapy implant reconstruction. Conference of American Association of Physicists in Medicine, Journal of Medical Physics Abstract in Medical Physics. 2006;33(6):2229. [Google Scholar]
- 14.Haralick RM, Sternberg SR, Zhuang X. Image analysis using mathematical morphology. IEEE Transactions on Pattern Analysis and Machine Intelligence. 1987;9(4):532–550. doi: 10.1109/tpami.1987.4767941. [DOI] [PubMed] [Google Scholar]
- 15.Ostu N. A threshold selection method from gray-level histograms. IEEE Transactions on Systems, Man, and Cybernetics. 1979;9(1):62–66. [Google Scholar]
- 16.Ballard DH. Generalizing the Hough transform to detect arbitrary shapes. Pattern Recognition. 1981;13(2):111–112. [Google Scholar]
- 17.Fischler MA, Bolles RC. Random sample consensus: a paradigm for model fitting with applications to image analysis and automated cartography. Communications of the Association for Computing Machinery. 1981;24(6):381–395. [Google Scholar]
- 18.Halir R, Flusser J. Numerically stable direct least squares fitting of ellipses. Proceedings of the International Conference in Central Europe on Computer Graphics; 1998. [Google Scholar]
- 19.Xie Y, Ohya J. Efficient detection of ellipses from an image by a guided modified ransac. Proceedings of SPIE-IS&T Electronic Imaging; 2009. [Google Scholar]
- 20.Haralick RM, Shapiro LG. Computer and robot vision. Addison-Wesley; 1992. pp. 28–48. [Google Scholar]
- 21.Narayanan S, Cho PS, Marks RJ. Three-dimensional seed reconstruction from an incomplete data set for prostate brachytherapy. Physics in Medicine and Biology. 2004;49(15):3483. doi: 10.1088/0031-9155/49/15/012. [DOI] [PubMed] [Google Scholar]
- 22.Su Y, Davis BJ, Furutani KM, Herman MG, Robb RA. Prostate brachytherapy seed reconstruction using an adaptive grouping technique. Medical Physics. 2007;34(7):2975–2984. doi: 10.1118/1.2745936. [DOI] [PubMed] [Google Scholar]
- 23.Lee J, Labat C, Jain AK, Fichtinger G, Prince JL. Reduced-dimensionality matching for 3-D reconstruction of prostate brachytherapy implants from incomplete data. IEEE International Symposium on Biomedical Imaging; 2009. pp. 1047–1050. [DOI] [PMC free article] [PubMed] [Google Scholar]


