Abstract
The villin headpiece subdomain (HP35) has become one of the most widely used model systems in protein folding studies, due to its small size and ultrafast folding kinetics. Here, we use HP35 as a testbed to show that the florescence decay kinetics of an unnatural amino acids p-cyanophenylalanine (PheCN), which are modulated by a nearby quencher (e.g., tryptophan or 7-aza-tryptophan) through the mechanism of fluorescence resonance energy transfer (FRET), can be used to detect protein conformational heterogeneity. This method is based on the notion that protein conformations having different donor-acceptor distances and interconverting slowly compared to the fluorescent lifetime of the donor (PheCN) would exhibit different donor fluorescence lifetimes. Our results provide strong evidence suggesting that the native free energy basin of HP35 is populated with conformations that differ mostly in the position and mean helicity of the C-terminal helix. This finding is consistent with several previous experimental and computational studies and also the functional role of this helix. Moreover, this result holds strong implications for computational investigation of the folding mechanism of HP35.
Keywords: FRET, HP35, Conformational heterogeneity, Fluorescence decay
INTRODUCTION
The notion that a protein can sample a conformational ensemble even under native conditions is not new.1 For example, it has been shown that crystalline myoglobin (Mb) can exist in three crystal states with different space groups.2 However, achieving a detailed assessment of the native conformational distribution of a protein of interest under physiological conditions is more difficult. While several techniques, including NMR3 and single-molecule fluorescence spectroscopy,4 have been shown to be useful in this regard, the former generally relies on relatively high protein concentrations, while the latter is often limited to the study of conformations that interconvert on relatively slow timescales. Herein, we show that an amino acid FRET pair can be used in conjunction with time-resolved fluorescence resonance energy transfer (tr-FRET) to reveal the existence of protein native conformational ensembles that interconvert on a timescale longer than the fluorescence lifetime of the donor (which is typically a few nanoseconds), but that may be difficult to detect by other methods.
Tr-FRET has been widely used in protein conformational studies, and is often utilized to map out distance distributions in unfolded polypeptides5 and to probe folding kinetics.6 The notion that tr-FRET can also be used to reveal native conformational heterogeneity of proteins is based on the principle that conformations that have different donor-acceptor distances will lead to different changes to the donor fluorescence lifetime, resulting in multi-exponential fluorescence decay kinetics, with the individual component amplitudes reporting on the relative populations of the conformational species that appear static on the timescale of the fluorescence lifetime of the donor. This method is similar to that used by Zewail and coworkers in the study of the conformational heterogeneity of base pair stacking in RNA molecules,7,8 and has also been used to study heterogeneity of domain stacking in globular proteins, and the distance distributions and dynamics of single domain proteins.9–13
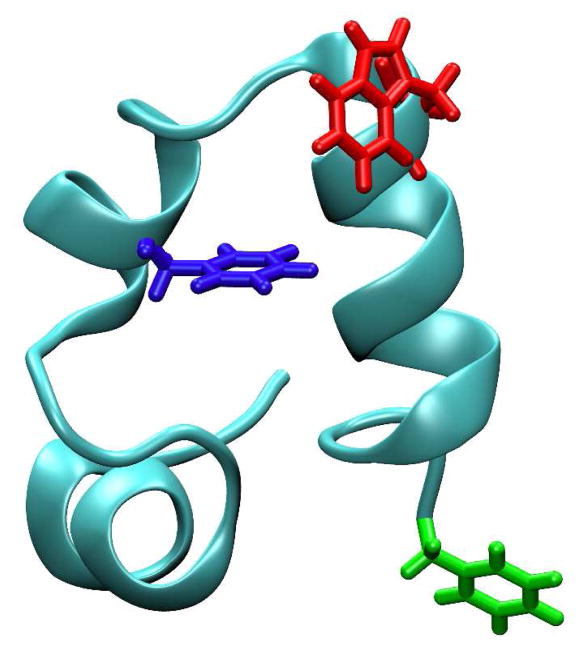
The model system that we have chosen to study is the villin headpiece subdomain (HP35), a mini-protein consisting of three helices (Figure 1). Because of its small size and fast folding rate, HP35 has been the focus of a large number of experimental and computational studies.14–35 In addition, it has been used as a test-bed for the applicability of non-natural amino acid based infrared (IR) and fluorescence protein conformational probes.36–39 Perhaps more importantly, two recent experimental studies40,41 have provided strong evidence suggesting that the native state of HP35 is structurally heterogeneous. In particular, the 2-dimentaional (2D) IR photon echo study of Urbanek et al.41 suggests that HP35 might populate two native-like structures that differ in the degrees of exposure of the protein’s hydrophobic core, while the triplet-triplet energy transfer study of Reiner et al.40 suggests that HP35 can sample two native states that are different in their tertiary structures, one of which possesses an “unlocked” conformation in the C-terminal region.
Figure 1.
NMR structure of HP35 (PDB code: 1VII) showing the three sites, Phe58 (blue) for HP35-P, and Trp64 (orange) and Phe76 (red) for HP35-AP, generated using VMD.61
The global folding and unfolding times of HP35 at 25 °C are approximately 28 and 594 μs, respectively, estimated from temperature-jump (T-jump) induced relaxation rates measured at higher temperatures using time-resolved infrared spectroscopy.29 Thus, at room temperature it is expected that the interconversion process between any two native conformers of HP35 would occur on a sub-millisecond timescale. To capture such fast-interconverting species, herein we measure and analyze the fluorescence decay kinetics of a non-natural fluorescent amino acid, p-cyanophenylalanine (PheCN), that is synthetically incorporated into the sequence of HP35 and serves as a FRET donor to either tryptophan (Trp) or 7-azatryptophan (7AW).36,38,42,43 The advantages of using PheCN as a fluorescent reporter in the current case are twofold: its small size makes it less structurally perturbative, and more importantly, in isolation its fluorescent state decays in a single-exponential manner with a lifetime of about 7 ns in water.44 The latter property is essential for using tr-FRET to detect conformational heterogeneity of proteins because one can, in a straightforward manner, attribute non-exponential fluorescence decays to protein populations that exhibit different donor-acceptor distances, or different conformations.
As shown (Figure 1), HP35 contains a single Trp residue that is located at the 64 position on helix-3. Thus, in the first case Phe58 is replaced with PheCN and the resulting mutant (hereafter referred to as HP35-P) is used to probe the state of the hydrophobic core of HP35 via the corresponding PheCN-Trp FRET pair.36 In the second case, a double mutant of HP35 (hereafter referred to as HP35-AP), wherein the C-terminal residue Phe76 is replaced with PheCN and Trp64 is mutated to 7AW to create a PheCN-7AW FRET pair,38 is employed to probe the conformational flexibility of helix-3 because the donor and acceptor in this case are located at the N- and C-termini of this helix, respectively. Our results indicate that the fluorescence decays of HP35-P and HP35-AP at room temperature in aqueous solution, where both are folded based on previous studies,36,38 deviate significantly from single-exponential kinetics, supporting the notion that HP35 can adopt two or multiple native conformations that do not interconvert on the timescale of the PheCN fluorescence lifetime. In addition, our results show that even under strongly denaturing conditions (e.g., in 6 M urea solution) a subset of protein population remains quite compact, which is consistent with previous findings that the thermally denatured state of HP36 contains residual helical structures.45,46
MATERIALS AND METHODS
Fmoc-protected amino acids were purchased from either Bachem Americas (Torrence, CA) or AnaSpec (Fremont, CA), and ultra pure grade urea was purchased from Invitrogen (Carlsbad, CA). Protein synthesis was achieved on a PS3 automated peptide synthesizer (Protein Technologies, MA) using standard Fmoc-protocols. The details of sample purification and characterization have been described elsewhere.36,38 Protein samples used in fluorescence lifetime measurements were prepared in 20 mM phosphate buffer (pH 7) and the final protein concentration was in the range of 5–10 μM, determined optically. All commercial plastic microcentrifuge tubes, conical tubes and pipette tips used in sample preparation were washed and rinsed exhaustively using Hellmanex II (Helma, Müllheim) and deionized distilled water prior to use.
Fluorescence decays were measured using a home-built time-correlated single photon counting (TCSPC) apparatus.6 Briefly, the 240 nm excitation pulses were generated by frequency tripling of the fundamental output of a mode-locked Mira-900 Ti-Sapphire laser (Coherent) centered at 720 nm using a harmonic generator (Inrad, Norvale). The repetition rate of the excitation pulses was reduced to approximately 3.8 MHz using an acousto-optic pulse picker. Time-resolved fluorescence signals were collected using a PMH100-6 photomultiplier tube (Becker-Hickl, Berlin) and an SPC630 or SPC150 TCSPC board (Becker-Hickl, Berlin). For HP35-AP the fluorescence of the donor (i.e., PheCN) was isolated by passing the fluorescence emission of the sample through a 295 ± 10 nm bandpass filter, whereas for HP35-P the PheCN fluorescence was separated from the acceptor fluorescence by using a 0.25 m monochromator (Spectral Products, Putnam, CT) set at 295 nm with a 12 nm bandwidth. To minimize the degree of photobleaching, a flow cell was used to continuously flow the protein sample through the laser excitation volume, and the excitation power was kept below 100 μW, while the beam was sent through the sample either unfocused with a diameter of ~1 mm (for the HP35-AP samples) or focused down using a 50 mm plano convex lens (for HP35-P samples). The measured fluorescence decays were fit to a multi-exponential model reconvoluted with the measured instrument response function using FluoFit (PicoQuant).
RESULTS AND DISSCUSION
Proteins, except those that are intrinsically disordered, are generally assumed to adopt a unique compact structure under native conditions. However, this assumption could easily fail for some proteins. For example, NMR experiments have shown that proline isomerization, which is a very slow event, can lead to formation of distinctly different native conformations.47 Also, single-molecule studies have revealed the existence of slowly interconverting (milliseconds to seconds) and functionally active conformations of enzymes.48,49 For small and fast folding proteins, native conformational heterogeneity is more difficult to assess because the sub-ensembles may contain similar secondary structures and also interconvert on a much faster timescale. In this regard, tr-FRET measurements may prove very useful as they allow for the discrimination of conformations that interconvert on a timescale slower than the donor excited state lifetime, typically a few nanoseconds, providing a window of detection that is not easily accessible by other methods, especially those based on single-molecule fluorescence techniques. Furthermore, confirming that the villin headpiece subdomain possesses a wide native state basin consisting of multiple local minima is in itself an important task as this mini-protein has become one of the most studied model systems in the field of protein folding.14–40,50
Fluorescence decay kinetics of HP35-AP
Kiefhaber and coworkers40 have recently shown, using a triplet-triplet energy transfer method, that the native basin of HP35 is populated by two distinguishable structures that are different in the tertiary packing of the C-terminal helix (or helix-3). However, the large size of the extrinsic spectroscopic probes used in their study could result in undesirable structural perturbations. To confirm their finding, herein we use a structurally less perturbative mutant (i.e., HP35-AP), whose CD spectrum is practically identical to that of HP35 at room tempereture.38 Furthermore, the fluorescence emission spectra of the PheCN and 7AW are completely separated, making selective detection of the donor fluorescence straightforward and unambiguous.38
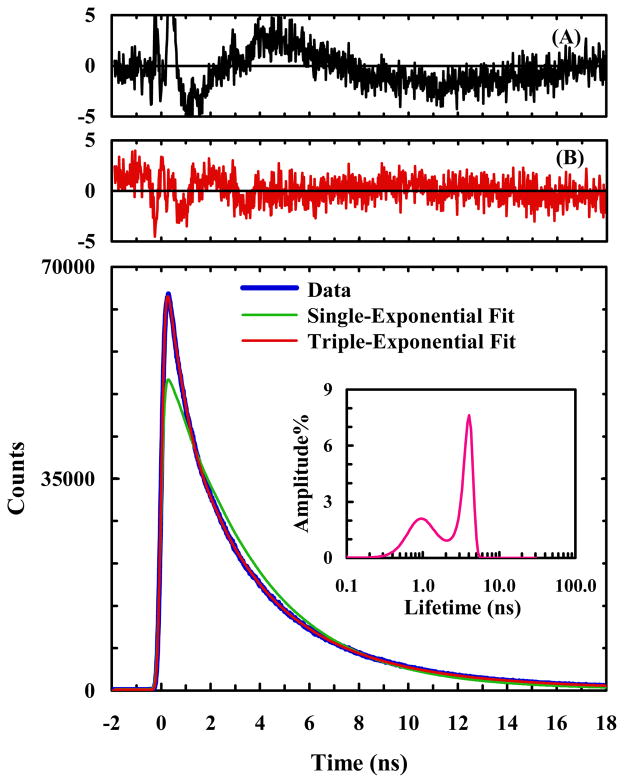
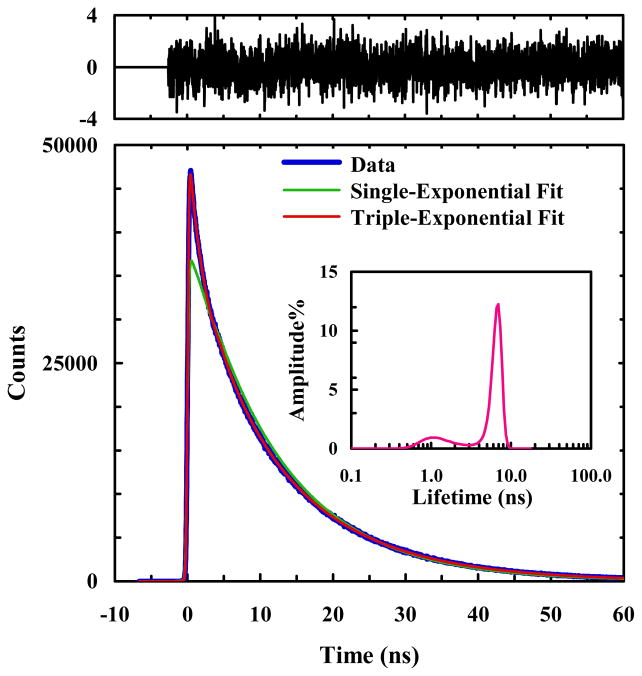
As shown (Figure 2), the PheCN fluorescence decay of HP35-AP at room temperature in phosphate buffer (pH 7) deviates significantly from first-order kinetics, but can be described reasonably well by a triple-exponential function. Analysis of the distribution of fluorescence lifetimes using a maximum entropy routine,6 as indicated in the inset of Figure 2, further confirms this deviation. Because in isolation and in unstructured short peptides (without Trp or other FRET quenchers) the fluorescence decay of PheCN follows first-order kinetics,44 this result indicates that in the present case protein conformational ensembles with distinctly different donor-acceptor distances are populated. In other words, this result is consistent with the finding of Kiefhaber and coworkers40 that helix-3 is flexible and can adopt different conformations even under native conditions.
Figure 2.
A representative PheCN fluorescence decay curve of HP35-AP in 20 mM phosphate buffer (pH 7), as well as a single-exponential and a triple-exponential fits to the data, as indicated. Shown in panel (A) are the weighted residuals of a double-exponential fit and in panel (B) are the weighted residuals of the triple-exponential fit. Also shown in the inset is the lifetime distribution obtained from maximum entropy analysis.
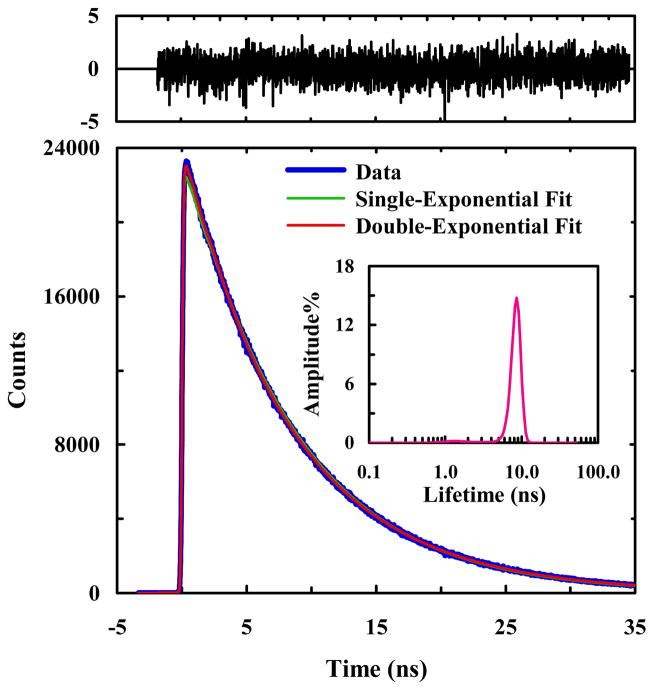
In order to confirm that the aforementioned deviation from single-exponential kinetics is a result of protein conformation, we further measured the fluorescence decay of a donor-only variant of HP35-AP, in which the FRET donor, 7AW, was mutated to alanine. (The resultant mutant is hereafter referred to as HP35-AP-W64A). While the native tryptophan residue is critical to the stability of HP35 (or HP36), Raleigh and coworkers51 have shown that such a mutation is relatively conservative. As shown (Figures S1 and S2 in Supporting Information), the CD and 1D proton NMR spectra of HP35-AP-W64A compare well with those of HP35-AP, suggesting that the native state structure is not overly perturbed by the alanine substitution. Additionally, the most up-field resonances in the 1D NMR spectra of these peptides, near −0.1 ppm, are consistent with the methyl resonance of Val 50 of HP36, which has been shown to be an indicator of folded structure.45 As expected (Figure 3), the fluorescence decay of HP34-AP-W64A in phosphate buffer (pH 7) is dominated by an exponential component (90.8%) with a lifetime of 8.7 ns, thus corroborating the notion that the non-exponential fluorescence decay of HP34-AP likely arises from multiple protein conformations that have different decay times due to different donor-acceptor separation distances.
Figure 3.
A representative PheCN fluorescence decay curve of HP35-AP-W64A in 20 mM phosphate buffer (pH 7), as well as a single-exponential and a double-exponential fits to the data, as indicated. The double-exponential fit yielded the following time constants (relative amplitude): τ1 = 3.3 ns (9.2%) and τ2 = 8.7 ns (90.8%). Shown in upper panel are the weighted residuals of the double-exponential fit. Also shown in the inset is the lifetime distribution obtained from maximum entropy analysis.
In principle, the model free maximum entropy analysis can provide more detailed information regarding the underlying conformational distribution. However, to simplify the interpretation and discussion and also to avoid any over-interpretation of the fluorescence decay data, below we discuss only the results emerging from discrete exponential fittings. As shown (Table 1), the three fluorescence decay time constants obtained under all experiment conditions are well separated (e.g., 5.9 ns (14%), 3.1 ns (47%), and 0.8 ns (39%) for those obtained in buffer solution). If we were to attribute these three exponentials to three conformational ensembles, and assume that the FRET chromophores rotate on a time scale much faster than ~1 ns, we would be able to determine an average donor-acceptor distance using the corresponding fluorescence decay lifetime for each case. The Förster radius of the PheCN-7AW FRET pair is approximately 18 Å.38 Thus, a simple calculation utilizing the above assumptions and a fluorescence decay lifetime of 8.7 ns for the unquenched donor (i.e., that measured for HP34-AP-W64A) indicates that the aforementioned three lifetimes correspond to three (mean) donor-acceptor distances of 20.4, 16.3, and 12.3 Å, respectively. Interestingly, the Cα to Cα distance between Phe76 and Trp64 is 18.6 Å based on the NMR structure of HP35 (pdb 1VII), while the x-ray structure (1YRF) gives a value of 12.3 Å.59,60
Table 1.
Best-fit parameters obtained from fitting the PheCN fluorescence decay data of HP35-AP to a triple-exponential function.
| Urea (M) | A1 (%) | τ1 (ns) | A2 (%) | τ2 (ns) | A3 (%) | τ3 (ns) | χ2 |
|---|---|---|---|---|---|---|---|
| 0.0 | 39 | 0.80 | 47 | 3.06 | 14 | 5.92 | 1.23 |
| 2.0 | 35 | 0.81 | 44 | 3.18 | 21 | 5.86 | 1.25 |
| 4.0 | 32 | 0.84 | 40 | 3.29 | 27 | 5.94 | 1.22 |
| 6.0 | 29 | 0.87 | 35 | 3.54 | 37 | 6.06 | 1.23 |
| 8.0 | 23 | 0.86 | 29 | 3.75 | 48 | 6.22 | 1.25 |
In order to better understand the origin of these kinetic components, we chose to estimate the fluorescence lifetime of PheCN using the NMR structure of HP35 to approximate the folded structure of HP35-AP. In the long range dipole-dipole approximation for interaction between two chromophores, the first-order excitation transfer rate constant can be expressed as:52
| (1) |
where kR is the radiative rate constant of the donor, J is the overlap integral of the donor-acceptor pair, η is the refractive index of the environment, assumed to be identical to water here, r⃑ is the unit vector that points along the length between the donor and acceptor, and μ⃑D and μ⃑A are the unit vectors describing the transition dipole directions for the donor and acceptor, respectively. To calculate the fluorescence lifetime of PheCN, we assumed that μ⃑D and μ⃑A are identical to those of the corresponding structural analogs of PheCN and 7AW, benzonitrile44 and 5-methylindole,45 and that r is the Cγ to Cγ distance between Phe76 and Trp64 in the NMR structure. In addition, we assumed that FRET only leads to the excitation to the lowest singlet excited state of 7AW, 1Lb, a fair assumption given the typical absorption maximum for this transition (at ~290 nm) and that PheCN emission peaks near 300 nm.42,44 Using the previously determined values of kR (1.6 × 10⁷ s−1) and J (1.11 × 10⁻²⁷ m6), we calculated kT for the following three cases: (a) the fixed sidechain conformations from the NMR structure were used, (b) the acceptor was allowed to freely rotate about its Cβ– Cγ bond, and (c) both sidechains were allowed to freely rotate about their respective Cβ– Cγ bonds. Subsequently, the theoretical fluorescence lifetime of the donor for each case was calculated using the following relationship:
| (2) |
Where τfree is the fluorescence lifetime of the donor in the absence of the acceptor, for which a value of 8.7 ns was used. For the three cases described above, the calculated PheCN fluorescence lifetimes are 7.7, 4.0, and 5.0 ns, respectively. Thus, taken together, these results indicate that sidechain dynamics alone cannot adequately account for the aforementioned tr-FRET results.
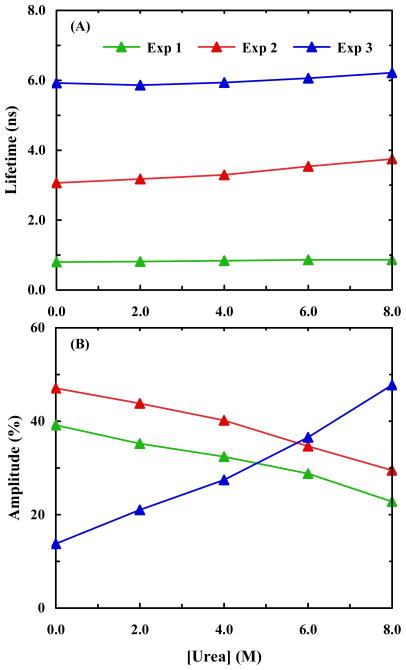
To better understand the structural origin of these three fluorescence decay components, we further measured the PheCN fluorescence decay kinetics of HP35-AP in urea solutions of different concentrations. As expected, all of the decays require three exponentials to yield a satisfactory fit (based on χ2 criterion and distribution of residuals). For convenience, in the subsequent discussion we label these three decay components as Exp-1, Exp-2, and Exp-3, according to the numbering in Table 1. As shown (Figure 4), Exp-2 and Exp-3 show a modest increase in their decay times with increasing urea concentration, while that of Exp-1 remains practically unchanged over the entire urea concentration range studied. However, the relative amplitude of Exp-3 increases with increasing urea concentration, while those of the other two decrease. These trends seem to suggest that Exp-3 reports on a natively unfolded or partially unfolded helix-3, whose population increases with increasing denaturant concentration, and that Exp-2 corresponds to a more folded helix-3, as that found in the NMR structure, whose population decreases with increasing urea concentration. Interestingly, both Exp-1 and Exp-2 components do not vanish at the highest denaturant concentrations, which may suggest, as has been evidenced by NMR studies,45,46 that some native like structures remain in the denatured state of this protein, although the peptide sequence used in the NMR studies only included helices 1 and 2.
Figure 4.
(A) PheCN fluorescence lifetimes of HP35-AP obtained at different urea concentrations. (B) Percent amplitudes versus urea concentration for the triple-exponential fit of the HP35-AP fluorescence decays.
The origin of the Exp-1 component is more difficult to ascertain. One possibility is that this sub-nanosecond component results from a partially unfolded helix-3 with its C-terminus bent toward its N-terminus, thus leading to an unusually short separation distance between the donor and acceptor. A more plausible reasoning, however, is, as suggested in the recent molecular dynamics (MD) simulation of Saladino et al.,55 that it likely reports on a protein conformation wherein the PheCN is partially dehydrated. The study of Saladino et al. showed, based on free energy calculations at 329 K, that one of the native conformations of HP35 involves the stacking of the C-terminal Phe residue, which is mutated to PheCN in the current study, with the protein’s hydrophobic core. Such a conformation would have a shorter than expected fluorescence lifetime as dehydration has been shown to reduce the fluorescence lifetime of PheCN.44 Another recent simulation study, aimed at simulating and reproducing the TTET results reported by Kiefhaber and coworkers, also presents evidence suggesting that the C-terminal region is dynamically flexible.34
Fluorescence decay of HP35-P
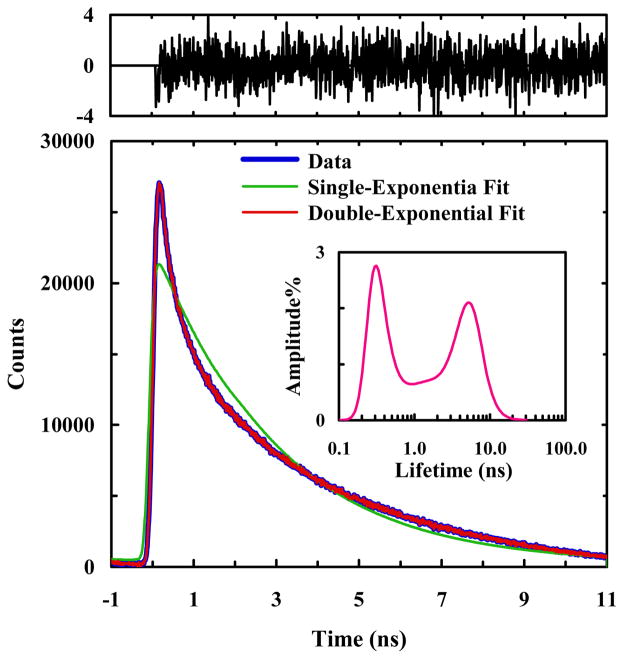
Urbanek et al.41 have shown that, for HP35-P, the nitrile stretch 2D photon echo reveals two frequency distributions with different spectral diffusion dynamics, suggesting that a sub-population of hydrated nitriles exist in the folded state ensemble. However, the protein concentration used in that study was relatively high, which prompted a similar 2D IR study56 to suggest that the more sparingly hydrated IR band could have resulted from protein aggregation. Since the protein concentration used in the present study is three orders of magnitude lower than that used in those 2D IR studies, we expect the amount of any potential aggregation to be greatly reduced, and hence that the fluorescence signal to arise mostly, if not completely, from isolated protein molecules. As shown (Figure 5), the fluorescence decay of PheCN of HP35-P in buffer solution deviates significantly from first-order kinetics; instead, it can be adequately described by a double-exponential function with τ1 = 0.59 ns (47%) and τ2 = 4.62 ns (53%), respectively. In addition, maximum entropy analysis (inset of Figure 5) yielded similar results. Thus, consistent with the 2D IR study of Urbanek et al.41 and also the fluorescence decay of HP35-AP, this result indicates that at least two native-like conformational ensembles are populated and detectable by the current experimental approach.
Figure 5.
A representative PheCN fluorescence decay curve of HP35-P in 20 mM phosphate buffer (pH 7), as well as a single-exponential and a double-exponential fits to the data, as indicated. The double-exponential fit yielded the following time constants (relative amplitude): τ1 = 0.59 ns (47%) and τ2 = 4.62 ns (53%). Shown in the upper panel are the weighted residuals of the double-exponential fit. Also shown in the inset is the lifetime distribution obtained from maximum entropy analysis.
A simple calculation using the previously published Förster distance of 16 Å for the PheCN-Trp FRET pair,57 which was determined using the fluorescence quantum efficiency of fully hydrated PheCN, suggests that these two fluorescence lifetimes would correspond to two donor-acceptor separation distances of 10.8 and 17.7 Å, respectively. However, the 2D IR results of Urbanek et al.41 indicates that the PheCN sidechain in one of the two possible HP35-P native conformations is dehydrated and buried in a hydrophobic environment. Thus, the above calculation, which assumed a hydrated PheCN, overestimated the donor-acceptor distance for this structural ensemble (i.e., the one giving rise to the shorter fluorescence lifetime).
Similar to the case of HP35-AP, we also studied a donor-only variant of HP35-P wherein the tryptophan acceptor was replaced by alanine. (The resultant mutant is hereafter referred to as HP35-P-W64A). As shown (Figure 6), despite lacking the FRET quencher, the fluorescence of HP35-P-W64A shows non-exponential decay. The fluorescence quantum yield (and thus lifetime) of PheCN is known to be sensitive to local environment,44,57 this result thus indicates that HP35-P-W64A can readily sample different conformations, a conclusion that is consistent with the CD and 1D proton NMR results (Figures S1 and S2 in Supporting Information) which show that the protein populates both folded and unfolded conformations at room temperature. Thus, it is not possible to conclude from this control experiment whether the donor-only mutant exhibits exponential decay kinetics in the native state. Because of this added complexity, we did not attempt to extract further quantitative information from the fluorescence decay data of this control mutant; instead, we chose to consider the simplest scenario, in which the PheCN is treated as either fully buried or fully solvated.
Figure 6.
A representative PheCN fluorescence decay curve of HP35-P-W64A in 20 mM phosphate buffer (pH 7), as well as a single-exponential and a triple-exponential fits to the data, as indicated. The triple-exponential fit yielded the following time constants (relative amplitude): τ1 = 0.55 ns (22%), τ2 = 2.61 ns (18%), and τ3 = 6.63 ns (60%). Shown in upper panel are the weighted residuals of the triple-exponential fit. Also shown in the inset is the lifetime distribution obtained from maximum entropy analysis.
The intrinsic fluorescence lifetime of a dehydrated PheCN should be similar to that measured in aportic solvents, which is about 4.5 ns.44 Interestingly, using this value to estimate the donor-acceptor distance for the shorter HP35-P lifetime component yields a value of 11.7 Å, which compares well to the 12.6 Å (Cα to Cα) found for the corresponding native residues (Phe58 and Trp64) of HP35 in the NMR structure. In addition, the relative amplitudes of the two fluorescence decay components suggest that the ratio of hydrated to dehydrated conformation is about 53/47, very close to the value of 54/46 observed in the 2D IR experiment.41 Because the Trp residue is located on helix-3, the motion away from the core of this helix would lead to a larger donor-acceptor distance. Therefore, this result is also in agreement with the study of Kiefhaber and coworkers.40 While it is possible that this slower decay component arises from the unfolded state of HP35-P, its large amplitude (53%) makes such a scenario highly unlikely as the folded population is estimated to be >95% at the experimental temperature based on CD spectroscopy.31
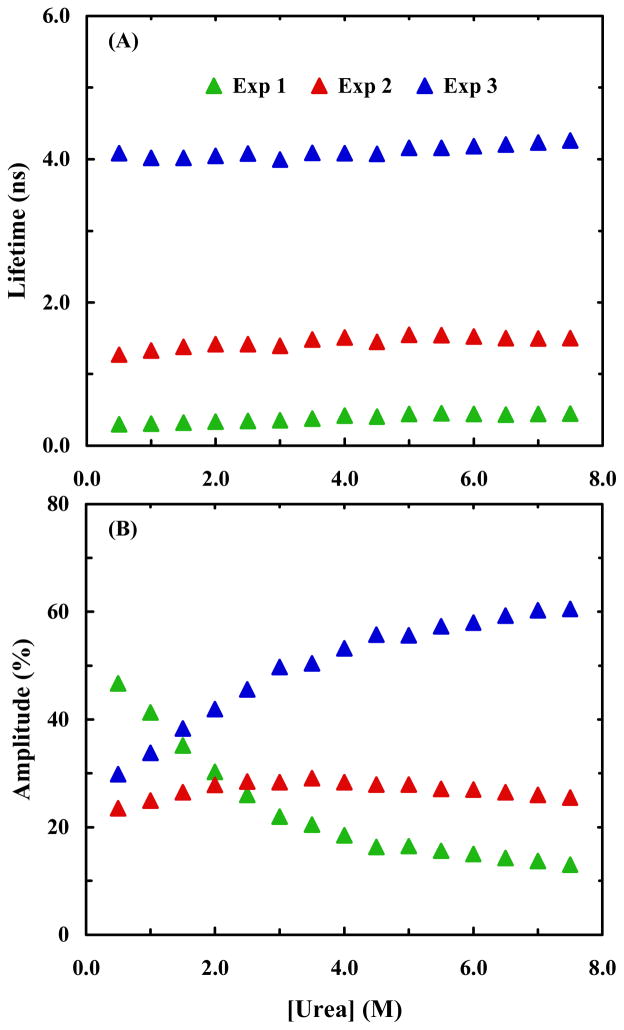
Addition of urea further increases the heterogeneity of the decay kinetics of HP35-P. We find that all the PheCN fluorescence decays obtained in the presence of urea can be adequately fit by a triple-exponential function (Table 2). As shown (Figure 7), the amplitudes of the three exponentials (defined as Exp-1, Exp-2, and Exp-3, according to the numbering in Table 2) show different dependences on the urea concentration. Specifically, increasing urea concentration results in loss of the more compact Exp-1 component and gain of the less quenched Exp-3 component, whereas the amplitude of Exp-2 only shows a modest change. Unlike 7AW, the fluorescence emission spectrum of Trp overlaps to some extent with that of PheCN. Thus, it is possible, in this case, that the donor fluorescence decay contains contributions from the acceptor emission. Tentatively, we attribute Exp-2 component to Trp fluorescence. Additionally, as observed in the case of HP35-AP, the fastest decay component does not vanish entirely at the highest denaturant concentrations.
Table 2.
Best-fit parameters obtained from fitting the PheCN fluorescence decay data of HP35-P obtained in urea solutions to a triple-exponential function.
| Urea (M) | A1 (%) | τ1 (ns) | A2 (%) | τ2 (ns) | A3 (%) | τ3 (ns) | χ2 |
|---|---|---|---|---|---|---|---|
| 0.5 | 47 | 0.47 | 23 | 1.27 | 30 | 4.09 | 1.49 |
| 1.0 | 41 | 0.41 | 25 | 1.33 | 34 | 4.02 | 1.65 |
| 1.5 | 35 | 0.35 | 26 | 1.38 | 38 | 4.02 | 1.68 |
| 2.0 | 30 | 0.30 | 28 | 1.42 | 42 | 4.05 | 1.74 |
| 2.5 | 26 | 0.26 | 28 | 1.42 | 46 | 4.08 | 1.84 |
| 3.0 | 22 | 0.22 | 28 | 1.39 | 50 | 4.00 | 1.92 |
| 3.5 | 20 | 0.20 | 29 | 1.48 | 50 | 4.09 | 1.96 |
| 4.0 | 18 | 0.18 | 28 | 1.51 | 53 | 4.08 | 2.15 |
| 4.5 | 16 | 0.16 | 28 | 1.45 | 56 | 4.07 | 2.13 |
| 5.0 | 16 | 0.16 | 28 | 1.55 | 56 | 4.16 | 2.30 |
| 5.5 | 16 | 0.16 | 27 | 1.55 | 57 | 4.16 | 2.29 |
| 6.0 | 14 | 0.14 | 27 | 1.49 | 59 | 4.20 | 2.30 |
| 6.5 | 14 | 0.14 | 26 | 1.50 | 59 | 4.21 | 2.57 |
| 7.0 | 14 | 0.14 | 26 | 1.50 | 60 | 4.23 | 2.45 |
| 7.5 | 14 | 0.14 | 25 | 1.52 | 62 | 4.24 | 2.50 |
| 8.0 | 13 | 0.13 | 25 | 1.50 | 62 | 4.28 | 2.51 |
Figure 7.
PheCN fluorescence lifetimes of HP35-P obtained at different urea concentrations. (B) Percent amplitudes versus urea concentration for the triple-exponential fit of the HP35-P fluorescence decays.
CONCLUSIONS
We demonstrate that in conjunction with time-resolved fluorescence decay measurements the PheCN-Trp and PheCN-7AW FRET pairs are very useful for investigation of protein conformational heterogeneity. Consistent with several previous experimental and computational studies,34,35,40,41,55 our results provide evidence suggesting that the native basin of HP35 is populated with conformations that interconvert on a timescale longer than the fluorescence decay lifetime of PheCN and differ mostly in the position and mean helicity of helix-3. In addition, this finding holds strong implications for computational studies of the folding mechanism of HP35 since they almost exclusively use a fixed structure, derived from either NMR spectroscopy or X-ray crystallography, as the target folded state.
Supplementary Material
Acknowledgments
We gratefully acknowledge financial support from the National Institutes of Health (GM-065978, RR-01348 and GM23303) and the National Science Foundation (MCB1121942 and Research Coordination Network grant MCB1051344).
Footnotes
CD and 1D NMR spectra of all peptides. This material is available free of charge via the Internet at http://pubs.acs.org.
References
- 1.Ansari A, Berendzen J, Bowne SF, Frauenfelder H, Iben IET, Sauke TB, Shyamsunder E, Young RD. Proc Natl Acad Sci USA. 1985;82:5000–5004. doi: 10.1073/pnas.82.15.5000. [DOI] [PMC free article] [PubMed] [Google Scholar]
- 2.Kondrashov DA, Zhang W, Aranda R, Stec B, Phillips GN., Jr Proteins. 2008;70:353–362. doi: 10.1002/prot.21499. [DOI] [PubMed] [Google Scholar]
- 3.Korzhnev DM, Kay LE. Acc Chem Res. 2008;41:442–451. doi: 10.1021/ar700189y. [DOI] [PubMed] [Google Scholar]
- 4.Hoffmann A, Nettels D, Clark J, Borgia A, Radford SE, Clarke J, Schuler B. Phys Chem Chem Phys. 2011;13:1857–1871. doi: 10.1039/c0cp01911a. [DOI] [PMC free article] [PubMed] [Google Scholar]
- 5.Haas E. ChemPhysChem. 2005;6:858–870. doi: 10.1002/cphc.200400617. [DOI] [PubMed] [Google Scholar]
- 6.Wu Y, Kondrashkina E, Kayatekin C, Matthews CR, Bilsel O. Proc Natl Acad Sci USA. 2008;105:13367–13372. doi: 10.1073/pnas.0802788105. [DOI] [PMC free article] [PubMed] [Google Scholar]
- 7.Xia TB, Becker HC, Wan CZ, Frankel A, Roberts RW, Zewail AH. Proc Natl Acad Sci USA. 2003;100:8119–8123. doi: 10.1073/pnas.1433099100. [DOI] [PMC free article] [PubMed] [Google Scholar]
- 8.Zhao L, Xia T. J Am Chem Soc. 2007;129:4118–4119. doi: 10.1021/ja068391q. [DOI] [PubMed] [Google Scholar]
- 9.Haran G, Haas E, Szpikowska B, Mas M. Proc Natl Acad Sci U S A. 1992;89:11764–11768. doi: 10.1073/pnas.89.24.11764. [DOI] [PMC free article] [PubMed] [Google Scholar]
- 10.Eis P, Lakowicz J. Biochemistry. 1993;32:7981–7993. doi: 10.1021/bi00082a020. [DOI] [PMC free article] [PubMed] [Google Scholar]
- 11.Sridevi K, Lakshmikanth GS, Krishnamoorthy G, Udgaonkar JB. J Mol Biol. 2004;337:699–711. doi: 10.1016/j.jmb.2003.12.083. [DOI] [PubMed] [Google Scholar]
- 12.Sarkar SS, Udgaonkar JB, Krishnamoorthy G. J Phys Chem B. 2011;115:7479–7486. doi: 10.1021/jp2016984. [DOI] [PubMed] [Google Scholar]
- 13.Nagarajan S, Amir D, Grupi A, Goldenberg DP, Minton AP, Haas E. Biophys J. 2011;100:2991–2999. doi: 10.1016/j.bpj.2011.03.065. [DOI] [PMC free article] [PubMed] [Google Scholar]
- 14.McKnight CJ, Doering DS, Matsudaira PT, Kim PS. J Mol Biol. 1996;260:126–134. doi: 10.1006/jmbi.1996.0387. [DOI] [PubMed] [Google Scholar]
- 15.Duan Y, Kollman PA. Science. 1998;282:740–744. doi: 10.1126/science.282.5389.740. [DOI] [PubMed] [Google Scholar]
- 16.Shen MY, Freed KF. Proteins: Struct, Funct, Genet. 2002;49:439–445. doi: 10.1002/prot.10230. [DOI] [PubMed] [Google Scholar]
- 17.Kubelka J, Eaton WA, Hofrichter J. J Mol Biol. 2003;329:625–630. doi: 10.1016/s0022-2836(03)00519-9. [DOI] [PubMed] [Google Scholar]
- 18.Jang SM, Kim E, Shin S, Pak Y. J Am Chem Soc. 2003;125:14841–14846. doi: 10.1021/ja034701i. [DOI] [PubMed] [Google Scholar]
- 19.Ripoll DR, Vila JA, Scheraga HA. J Mol Biol. 2004;339:915–925. doi: 10.1016/j.jmb.2004.04.002. [DOI] [PubMed] [Google Scholar]
- 20.Bandyopadhyay S, Chakraborty S, Balasubramanian S, Bagchi B. J Am Chem Soc. 2005;127:4071–4075. doi: 10.1021/ja042847r. [DOI] [PubMed] [Google Scholar]
- 21.Brewer SH, Vu DM, Tang YF, Li Y, Franzen S, Raleigh DP, Dyer RB. Proc Natl Acad Sci USA. 2005;102:16662–16667. doi: 10.1073/pnas.0505432102. [DOI] [PMC free article] [PubMed] [Google Scholar]
- 22.Carr JM, Wales DJ. J Chem Phys. 2005;123:234901. doi: 10.1063/1.2135783. [DOI] [PubMed] [Google Scholar]
- 23.Lei HX, Wu C, Liu HG, Duan Y. Proc Natl Acad Sci USA. 2007;104:4925–4930. doi: 10.1073/pnas.0608432104. [DOI] [PMC free article] [PubMed] [Google Scholar]
- 24.Brewer SH, Song B, Raleigh DP, Dyer RB. Biochemistry. 2007;46:3279–3285. doi: 10.1021/bi602372y. [DOI] [PubMed] [Google Scholar]
- 25.Cellmer T, Henry ER, Hofrichter J, Eaton WA. Proc Natl Acad Sci USA. 2008;105:18320–18325. doi: 10.1073/pnas.0806154105. [DOI] [PMC free article] [PubMed] [Google Scholar]
- 26.Ding F, Tsao D, Nie HF, Dokholyan NV. Structure. 2008;16:1010–1018. doi: 10.1016/j.str.2008.03.013. [DOI] [PMC free article] [PubMed] [Google Scholar]
- 27.Yang JS, Wallin S, Shakhnovich EI. Proc Natl Acad Sci USA. 2008;105:895–900. doi: 10.1073/pnas.0707284105. [DOI] [PMC free article] [PubMed] [Google Scholar]
- 28.Piana S, Laio A, Marinelli F, Van Troys M, Bourry D, Ampe C, Martins JC. J Mol Biol. 2008;375:460–470. doi: 10.1016/j.jmb.2007.10.020. [DOI] [PubMed] [Google Scholar]
- 29.Bunagan MR, Gao J, Kelly JW, Gai F. J Am Chem Soc. 2009;131:7470–7476. doi: 10.1021/ja901860f. [DOI] [PMC free article] [PubMed] [Google Scholar]
- 30.Bowman GR, Pande VS. Proc Natl Acad Sci USA. 2010;107:10890–10895. doi: 10.1073/pnas.1003962107. [DOI] [PMC free article] [PubMed] [Google Scholar]
- 31.Freddolino PL, Schulten K. Biophys J. 2009;97:2338–2347. doi: 10.1016/j.bpj.2009.08.012. [DOI] [PMC free article] [PubMed] [Google Scholar]
- 32.Cellmer T, Buscaglia M, Henry ER, Hofrichter J, Eaton WA. Proc Natl Acad Sci USA. 2011;108:6103–6108. doi: 10.1073/pnas.1019552108. [DOI] [PMC free article] [PubMed] [Google Scholar]
- 33.Zhu L, Ghosh K, King M, Cellmer T, Bakajin O, Lapidus LJ. J Phys Chem B. 2011;115:12632–12637. doi: 10.1021/jp206238y. [DOI] [PubMed] [Google Scholar]
- 34.Beauchamp KA, Ensign DL, Das R, Pande VS. Proc Natl Acad Sci USA. 2011;108:12734–12739. doi: 10.1073/pnas.1010880108. [DOI] [PMC free article] [PubMed] [Google Scholar]
- 35.Vugmeyster L, Ostroysky D, Khadjinoya A, Ellden J, Hoatson GL, Vold RL. Biochemistry. 2011;50:10637–10646. doi: 10.1021/bi201515b. [DOI] [PMC free article] [PubMed] [Google Scholar]
- 36.Glasscock JM, Zhu Y, Chowdhury P, Tang J, Gai F. Biochemistry. 2008;47:11070–11076. doi: 10.1021/bi8012406. [DOI] [PMC free article] [PubMed] [Google Scholar]
- 37.Bagchi S, Falvo C, Mukamel S, Hochstrasser RM. J Phys Chem B. 2009;113:11260–11273. doi: 10.1021/jp900245s. [DOI] [PMC free article] [PubMed] [Google Scholar]
- 38.Rogers JMG, Lippert LG, Gai F. Anal Biochem. 2010;399:182–189. doi: 10.1016/j.ab.2009.12.027. [DOI] [PMC free article] [PubMed] [Google Scholar]
- 39.Goldberg JM, Batjargal S, Petersson EJ. J Am Chem Soc. 2010;132:14718–14720. doi: 10.1021/ja1044924. [DOI] [PubMed] [Google Scholar]
- 40.Reiner A, Henklein P, Kiefhaber T. Proc Natl Acad Sci USA. 2010;107:4955–4960. doi: 10.1073/pnas.0910001107. [DOI] [PMC free article] [PubMed] [Google Scholar]
- 41.Urbanek DC, Vorobyev DY, Serrano AL, Gai F, Hochstrasser RM. J Phys Chem Lett. 2010;1:3311–3315. doi: 10.1021/jz101367d. [DOI] [PMC free article] [PubMed] [Google Scholar]
- 42.Chen Y, Rich RL, Gai F, Petrich JW. J Phys Chem. 1993;97:1770–1780. [Google Scholar]
- 43.Smirnov A, English D, Rich R, Lane J, Teyton L, Schwabacher A, Luo S, Thornburg R, Petrich J. J Phys Che m B. 1997;101:2758–2769. [Google Scholar]
- 44.Serrano AL, Troxler T, Tucker MJ, Gai F. Chem Phys Lett. 2010;487:303–306. doi: 10.1016/j.cplett.2010.01.058. [DOI] [PMC free article] [PubMed] [Google Scholar]
- 45.Tang YF, Rigotti DJ, Fairman R, Raleigh DP. Biochemistry. 2004;43:3264–3272. doi: 10.1021/bi035652p. [DOI] [PubMed] [Google Scholar]
- 46.Meng W, Shan B, Tang Y, Raleigh DP. Protein Sci. 2009;18:1692–1701. doi: 10.1002/pro.152. [DOI] [PMC free article] [PubMed] [Google Scholar]
- 47.Fersht AR, Requena Y. J Mol Biol. 1971;60:279–290. doi: 10.1016/0022-2836(71)90294-4. [DOI] [PubMed] [Google Scholar]
- 48.Lu HP, Xun LY, Xie XS. Science. 1998;282:1877–1882. doi: 10.1126/science.282.5395.1877. [DOI] [PubMed] [Google Scholar]
- 49.Michalet X, Weiss S, Jager M. Chem Rev. 2006;106:1785–1813. doi: 10.1021/cr0404343. [DOI] [PMC free article] [PubMed] [Google Scholar]
- 50.Rajan A, Freddolino PL, Schulten K. PLoS One. 2010;5:e9890. doi: 10.1371/journal.pone.0009890. [DOI] [PMC free article] [PubMed] [Google Scholar]
- 51.Xiao S, Raleigh DP. J Mol Biol. 2010;401:274–285. doi: 10.1016/j.jmb.2010.05.070. [DOI] [PubMed] [Google Scholar]
- 52.Förster T. Discuss Faraday Soc. 1959:7–17. [Google Scholar]
- 53.Lewis FD, Holman B. J Phys Chem. 1980;84:2326–2328. [Google Scholar]
- 54.Albinsson B, Norden B. J Phys Chem. 1992;96:6204–6212. [Google Scholar]
- 55.Saladino G, Marenchino M, Gervasio FL. J Chem Theory Comput. 2011;7:2675–2680. doi: 10.1021/ct2002489. [DOI] [PubMed] [Google Scholar]
- 56.Chung JK, Thielges MC, Fayer MD. Proc Natl Acad Sci USA. 2011;108:3578–3583. doi: 10.1073/pnas.1100587108. [DOI] [PMC free article] [PubMed] [Google Scholar]
- 57.Tucker MJ, Oyola R, Gai F. Biopolymers. 2006;83:571–576. doi: 10.1002/bip.20587. [DOI] [PubMed] [Google Scholar]
- 58.Doering DS, Matsudaira P. Biochemistry. 1996;35:12677–12685. doi: 10.1021/bi9615699. [DOI] [PubMed] [Google Scholar]
- 59.McKnight CJ, Matsudaira PT, Kim PS. Nat Struct Biol. 1997;4:180–184. doi: 10.1038/nsb0397-180. [DOI] [PubMed] [Google Scholar]
- 60.Chiu TK, Kubelka J, Herbst-Irmer R, Eaton WA, Hofrichter J, Davies DR. Proc Natl Acad Sci U S A. 2005;102:7517–7522. doi: 10.1073/pnas.0502495102. [DOI] [PMC free article] [PubMed] [Google Scholar]
- 61.Humphrey W, Dalke A, Schulten K. J Mol Graph. 1996;14:33–38. doi: 10.1016/0263-7855(96)00018-5. [DOI] [PubMed] [Google Scholar]
Associated Data
This section collects any data citations, data availability statements, or supplementary materials included in this article.


