

Abstract
Characterizing the extent and logic of signaling networks is essential to understanding specificity in such physiological and pathophysiological contexts as cell fate decisions and mechanisms of oncogenesis and resistance to chemotherapy. Cell-based RNA interference (RNAi) screens enable the inference of large numbers of genes that regulate signaling pathways, but these screens cannot provide network structure directly. We describe an integrated network around the canonical receptor tyrosine kinase (RTK)–Ras–extracellular signal–regulated kinase (ERK) signaling pathway, generated by combining parallel genome-wide RNAi screens with protein-protein interaction (PPI) mapping by tandem affinity purification–mass spectrometry. We found that only a small fraction of the total number of PPI or RNAi screen hits was isolated under all conditions tested and that most of these represented the known canonical pathway components, suggesting that much of the core canonical ERK pathway is known. Because most of the newly identified regulators are likely cell type– and RTK-specific, our analysis provides a resource for understanding how output through this clinically relevant pathway is regulated in different contexts. We report in vivo roles for several of the previously unknown regulators, including CG10289 and PpV, the Drosophila orthologs of two components of the serine/threonine–protein phosphatase 6 complex; the Drosophila ortholog of TepIV, a glycophosphatidylinositol-linked protein mutated in human cancers; CG6453, a noncatalytic subunit of glucosidase II; and Rtf1, a histone methyltransferase.
INTRODUCTION
Intracellular signaling mediated by growth factor–stimulated receptor tyrosine kinases (RTKs), such as those activated by insulin or epidermal growth factor (EGF), acting through Ras to extracellular signal–regulated kinases (ERKs) is required for metazoan development and physiology. Mutations in genes encoding components of this conserved signaling network, the RTK-Ras-ERK pathway, have been repeatedly identified as drivers in multiple malignancies. Understanding the hierarchical relationships among pathway regulators can have profound clinical significance, as exemplified by Kras genotype in determining responsiveness to inhibitors of the EGF receptor (EGFR) (1).
A complete understanding of cell signaling through this pathway requires identification of (i) all components of the system, (ii) the quantitative contribution of these components to various signaling outputs, and (iii) the hierarchical relationships, including physical connections, between these components. Systematic functional genetic approaches, such as genome-wide RNA interference (RNAi) screening used to identify previously unknown signaling genes, are inferential in that they do not distinguish between direct and indirect effects. Large-scale protein-protein interaction (PPI) mapping complements genetic studies by revealing physical associations, but fails to reveal the function of interacting proteins or the functional consequences of the interactions. Separate such “systems-level” functional genomic and interactome studies in the past few years have revealed that signaling is likely propagated within large networks of hundreds of proteins and thus have challenged linear cascade models derived from traditional reductive approaches (2). However, each systematic screening approach performed separately suffers from inherent technical limitations of the methods used, leading to false negatives and positives, restricting the comprehensiveness of pathway regulator discovery.
We have previously described an antibody-based, genome-wide RNAi screen assay for ERK activity in Drosophila cells after insulin stimulus (3). This assay relies on an antibody that recognizes phosphorylated Drosophila ERK (dpERK). We showed specific examples from secondary screens of a small subset of genes that were required downstream of insulin receptor (InR), but not of the EGFR, for activation of ERK in particular cell types, suggesting that many potential components of this pathway may have been missed by a single primary screen (3). Although multiple RTKs can signal through Ras to ERK, their output is context-dependent despite the apparent similarity in signal propagation through the core pathway (4–6).
A combined systematic approach using complementary functional genomic and interactome technologies would be more likely to uncover direct regulators and more completely describe the landscape of a signaling pathway (7). We performed multiple genome-wide RNAi screens in parallel to generating a tandem affinity purification–mass spectrometry (TAP-MS)–based PPI network surrounding the canonical pathway components of the RTK-Ras-ERK signaling pathway, using data from cells responding to insulin or EGF. Although we identified several previously unknown pathway regulators, the functional genomic and interactome data sets suggest that much of the core canonical pathway is complete.
RESULTS
A functional genomic compendium of RTK-Ras-ERK signaling
To comprehensively discover genes that regulate ERK signaling output and to identify other specificity-generating proteins, we conducted four systematic, cell-based RNAi screens for regulators of EGF-stimulated ERK activation in two stable Drosophila cell lines expressing EGFR, S2R+mtDER, and Kc167mtDER (fig. S1, A and B). These four screens combined with our two previously published screens performed with S2R+ cells that were unstimulated (baseline) or stimulated with insulin (4) interrogated >20,000 double-stranded RNAs (dsRNAs) targeting roughly 14,000 Drosophila genes. We compared all six primary screens, divided into three groups by stimulus (insulin, EGF) and cell line (S2R+, Kc) (Fig. 1A). These screens uncovered 2677 annotated genes, in addition to 756 unannotated predicted genes (Fig. 1A and table S1). As expected, these genes include most of the known canonical pathway-associated genes (table S5). We identified both EIF4AIII and mago (table S1) as positive regulators in our RNAi screen in Kc cells and these two genes were also found in an RNAi screen for regulators of the mitogen-activated protein kinase (MAPK) pathway in Drosophila S2 cells (8).
Fig. 1.
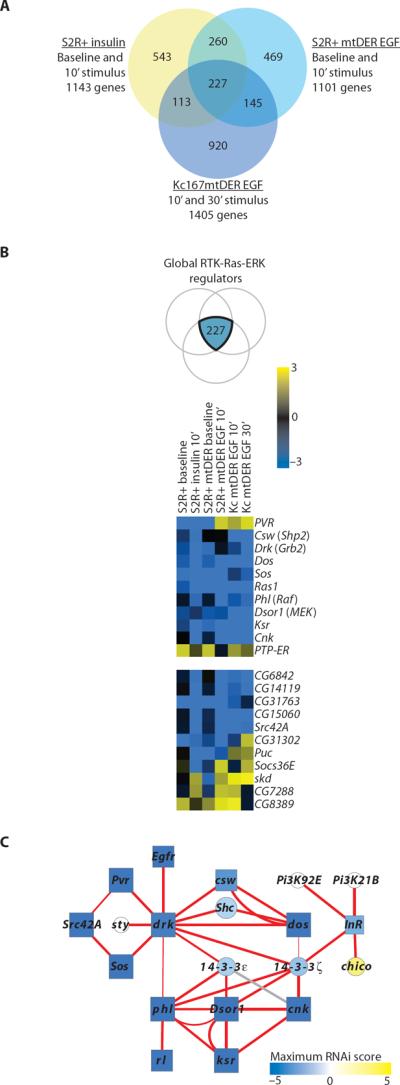
Parallel RTK-Ras-ERK genome-wide RNAi screens in Drosophila. (A) Comparison of six RNAi screens grouped into three experimental categories based on ligand stimulus or cell type, with number of annotated genes in each category. Note that S2R+ cells used for EGF stimulation express EGFR for robust ERK activation in response to EGF; thus, a “baseline” RNAi screen was performed in these cells in the absence of EGF in addition to the baseline performed previously in the EGFR-negative S2R+ cells. The total gene set is enriched for genes with human orthologs and for known components of the canonical signaling cassette. (B) A total of 227 genes appeared in all three groups, representing a common or “global” set of RTK-Ras-ERK regulators, which included those encoding proteins in the canonical cascade (top array graph). Examples of other global regulators are shown in the lower array graph. Genes are listed using common abbreviations, with mammalian names listed in parentheses when different from Drosophila. Color represents average Z score in each primary RNAi screen. (C) Many known canonical interactions are recapitulated by the TAP-MS analysis, including those involving adaptors (Drk-Sos), the Phl activation complex (Phl-Dsor1, Phl-Rl, Phl-Ksr, and Ksr-Cnk), and InR with the PI3K subunits p110 (PI3K92E) and p60 (p85 ortholog, PI3K21B). Red edges denote those found both in our study and in MasterNet, a literature-based compilation of previously known PPIs. The gray edge denotes those not found in MasterNet. Edge thickness represents SAINT score. Circles represent prey; rectangles represent baits.
Gene Ontology (GO) annotation of the hits from the RNAi screens showed expected enrichment for processes controlled by RTK-Ras-ERK signaling, including tracheal development, photoreceptor differentiation, imaginal disc morphogenesis, and hematopoiesis; genes controlling mitosis, neuronal differentiation, cell motility, female gamete generation, and SUMO (small ubiquitin-like modifier protein) binding were also enriched in the hits from the RNAi screens (table S2). The hits from the RNAi screens were also significantly enriched for proteins conserved in humans and implicated in a human disease (P < 3.5 × 10⁻⁹ and 9.8 × 10⁻⁴, respectively), implying that many of the newly identified regulators are also involved in mammalian MAPK signaling. Human orthologs had stronger RNAi scores on average (P < 0.001), suggesting that genes with more central roles in the pathway have been conserved.
We observed distinct subsets of genes isolated in the primary RNAi screens under specific cell or RTK-stimulus contexts (fig. S1C). We were also able to identify genes that were common to both cell types under both stimulus conditions (Fig. 1B). These genes were quantitatively stronger regulators than the remaining hits (fig. S1D). Our systematic screens permitted global observation of the processes regulating specificity; compared to all hits from the RNAi screens, those identified in the insulin screen were enriched for cytoskeletal genes and cell cycle processes (P < 1.3 × 10⁻⁶ and 0.03, respectively), whereas transcriptional and peptidase activities were enriched in the EGF screen in Kc cells (P < 4 × 10⁻⁴ and 0.02, respectively).
Distinct subsets of genes were specific to insulin or EGF signaling in either cell type or were regulated by insulin or EGF in both cell types (table S3). Signaling downstream of the InR activates both ERK and Akt signaling pathways; we confirmed that genes encoding components of the Akt-Tor pathway, including InR itself, PTEN, Akt, Tor, and gig (Tsc2), were insulin-specific regulators of ERK. This insulin-specific regulation of ERK and the Akt-Tor pathway is likely mediated through feedback from S6 kinase to InR (9). (Throughout the text, where different from the Drosophila gene or protein names, mammalian common names or abbreviations of the proteins are shown after the names or abbreviations for these components in Drosophila.) Other genes specifically associated with InR signaling included PRL-1, encoding a phosphatase that can transform cells (10); the kinase-encoding gene Tak1; and CG9468 and CG5346, which are genes predicted to encode proteins with α-mannosidase and iron oxygenase activities, respectively. Genes specifically associated with EGF signaling included EGFR itself, and those encoding several components potentially involved in receptor localization, or down-regulation, or both, including Snap, encoding a protein required for vesicular transport; CG7324, encoding a Rab guanosine triphosphatase (GTPase)–activating protein; and RSG7, encoding a putative G protein [heterotrimeric guanosine triphosphate (GTP)–binding protein] γ subunit that also interacts with Snapin, a component of the SNARE complex (11). Because these genes were associated with EGF signaling but not insulin signaling, this suggests that these are required for EGFR but not InR localization.
An RTK-Ras-ERK interaction network
Many of the previously unknown regulators identified in the RNAi screens may act indirectly through general cellular processes or through multiple levels of transcriptional feedback. Furthermore, RNAi screens suffer from off-target effects even after computational filtering and use of multiple RNAi reagents for each gene (12). PPI mapping provides an orthogonal representation of network regulators compared to functional genomic approaches because it reveals physical associations. Although large-scale yeast two-hybrid (Y2H) screening can reveal potential PPIs with high accuracy (13) and has been performed on a large scale for MAPK-related proteins (14), Y2H cannot detect interactions that may rely on regulatory posttranslational modifications that occur in endogenous signaling contexts. Large-scale TAP-MS has been used to discover PPIs, most comprehensively in yeast (15–17) and in human cells in “pathway-oriented” mapping of tumor necrosis factor-α (TNFα) signaling (18), Wnt signaling (3), and autophagy (19).
We used TAP-MS to capture the dynamic “mini-interactome” surrounding 15 well-recognized, conserved canonical components of the RTK-Ras-ERK pathway: InR, PDGF (platelet-derived growth factor)– and VEGF (vascular endothelial cell growth factor) receptor-related (PVR), EGFR, the adaptors Drk (Grb2) and Dos (Gab), the GTPase Ras85D, the Ras GTP exchange factor Sos, the cytoplasmic tyrosine kinase Src42A, the GTPase-activating protein Gap1, the phosphatase Csw (Shp2), the MAPK kinase kinase Phl (Raf ), the MAPK kinase Dsor1 [mitogen-activated or extracellular signal-regulated protein kinase kinase (MEK)], the scaffolds Ksr and Cnk, and the MAPK Rl (ERK). These 15 proteins served as the “baits” in the affinity purification assay. The proteins and a control were expressed in S2R+ cells with TAP vectors (20) and lysates prepared at baseline (unstimulated cells) or after stimulation with insulin or EGF. Two or more biological replicates were performed for each bait and condition. Interacting proteins were determined by TAP and microcapillary liquid chromatography-tandem MS (LC-MS/MS). A total of 54,339 peptides were identified representing 12,208 proteins, encompassing an unfiltered network of 5009 interactions among 1188 individual proteins (table S4). Among the most abundant proteins identified in replicate pull-downs and absent in control preparations were other known RTK-Ras-ERK canonical proteins. A network based on the observed interactions among these canonical proteins recapitulates many of the known RTK-Ras-ERK signaling pathway interactions (Fig. 1C), validating the sensitivity of our TAP-MS approach in robustly identifying pathway interactors.
Raw TAP-MS data often contain sticky proteins found in control preparations. To provide a ranked list of the most specific pathway interactors by filtering out these sticky proteins, we applied the Significance Analysis of Interactome (SAINT) method to our PPI data set (15). Using a SAINT cutoff of 0.83 and false discovery rate (FDR) of 7.2%, we generated a filtered PPI network of 386 interactions among 249 proteins surrounding the canonical components of the RTK-Ras-ERK signaling pathway (Fig. 2 and table S4). We evaluated our PPI network by comparing it with various literature-derived physical interaction networks (fig. S2, A and B). For this network comparison, we generated a master physical interaction network (MasterNet) composed of five different types of networks (see Materials and Methods). Our filtered network is significantly overrepresented in the MasterNet, with 29% overlap, compared to 17% for the excluded proteins; the canonical network has a 97% overlap with MasterNet. SAINT scores were highly correlated with appearance in literature data sets, implying that the PPI network as filtered by SAINT represents high-confidence pathway interactors (fig. S2C). Of the literature-derived networks, appearance in the Drosophila binary PPI data set most closely correlated with higher SAINT scores (fig. S2D).
Fig. 2.

TAP-MS PPI RTK-Ras-ERK signaling network. Filtered PPI map of RTK-Ras-ERK signaling in Drosophila, including primary RNAi screen scores, if present. Z score RNAi result describes negative regulators (yellow) and positive regulators (blue). Edge thickness denotes SAINT score, a measure of interaction confidence. Red edges denote those found both in our study and in MasterNet, a literature-based compilation of previously known PPIs. Edge thickness represents SAINT score. Circles represent prey; rectangles represent baits. The size of the node correlates with the number of RNAi screens from which the proteins were isolated. See table S4 for details of all node and edge parameters and names of the proteins identified as pathway interactors.
Using traditional coimmunoprecipitation techniques and quantitative Western blotting, we corroborated selected previously unknown interactions (fig. S3). Among these, we verified an ERK interaction with the cyclin-dependent kinase cdc2c (CDK2), as reported for mammalian cells (21), implying that ERK can directly regulate the cell cycle through this interaction. Many of the proteins that interacted with multiple RTKs were adaptors (table S4). A notable exception was CG10916, which was one of the few common interactors of multiple RTKs (InR, PVR, and EGFR) that was not an adaptor (fig. S3, A and B). Thus, individual RTKs likely recruit distinct complexes during signaling and may compete for a common set of canonical interactors. As a negative regulator of ERK activation and a predicted RING domain–containing protein, CG10916 may be involved in receptor degradation or down-regulation of RTKs. We also found that some interactions below our conservative SAINT threshold of 0.83 could be verified by coimmunoprecipitation (fig. S3C), suggesting that the true size of the network may be larger than the cutoff we chose.
On the basis of GO classifications, we found that the filtered PPI network was enriched in genes encoding regulators of Ras signaling, signaling by the RTKs Sevenless and Torso, and R7 photoreceptor differentiation, all processes known to involve ERK activation, and also those encoding pro teins associated with mitosis, the cytoskeleton, axis specification, oogenesis, kinase activity, and SUMO binding (table S2). Compared to the total filtered network, proteins interacting with Drk (Grb2) were enriched for GO terms associated with epithelium development and cell fate (P < 0.02 for both), but otherwise individual bait networks were representative of the entire network. As with the RNAi hits, our filtered PPI network was enriched for genes conserved in humans and in human diseases (P < 5.4 × 10⁻¹⁶ and P < 4.6 × 10⁻³, respectively).
Feedback regulation is a mechanism of ensuring pathway robustness(22). Several studies have examined the transcriptional responses to RTK-Ras-ERK signaling stimulation or perturbation in vivo (23–25). We culled genes in these studies responsive to pathway modulation and overlaid them with our PPI data set. We found that the expression of 25% of the genes for these interactors was changed in response to pathway modulation, a significantly enriched proportion (P < 2.4 × 10⁻⁹; table S4 and Fig. 3A). These gnes are strong candidates encoding mediators of feedback regulation of RTK-Ras-ERK signaling. Among these were several ribosomal genes (for example, RpL6, RpL23A, RpL27, RpS18, and RpS30) that exhibited reduced expression in response to pathway activation (Fig. 3A) and that were isolated as negative regulators in the RNAi screens, implying feedback amplification through inhibition of translational repression. These genes also had negatively correlated gene expression with their canonical pathway interactors in published gene expression studies (Fig. 3B).
Fig. 3.

Additional analysis of the PPI network. (A) Nodes in the PPI network that were also regulated by pathway output, as mined from in vivo transcriptome analyses. Blue nodes were encoded by genes that were down-regulated by pathway output; yellow nodes were up-regulated. (B) Correlation between expression of the genes encoding the baits and preys. Orange edges denote interacting partners that exhibited an inverse correlation in expression; blue edges denote interacting partners that exhibited positive correlation in expression.
During assembly of the RTK-Ras-ERK interactome, we identified complexes under baseline, insulin-stimulated, and EGF-stimulated conditions to find pathway interactors and to study the dynamics of complex assembly and disassembly, using quantitative label-free proteomics (26). Previous systematic evaluation of dynamics in interactomes has been limited to individual proteins; for example, one study identified dynamic interactors of ERK (27). Using the SAINT scores at baseline and stimulated conditions, we assembled interactomes of proteins with a high probability of a dynamic interaction with the canonical baits in response to insulin (Fig. 4A) or EGF stimulation (Fig. 4B). We observed several expected interaction dynamics, including the association of subunits of phosphatidylinositol 3-kinase (PI3K) with InR after insulin stimulus, which likely occurs through the adaptor Chico (IRS) and association of the adaptor Drk (Grb2) with EGFR after EGF stimulus (table S4). Our global analysis showed that proteins that interacted with the adaptor Dos were more likely to associate than dissociate under insulin stimulus, whereas those that interacted with Drk (Grb2) did not significantly change on the basis of SAINT probabilities. EGFR interactors dissociated when cells were stimulated with insulin. Upon EGF stimulus, interactors with Cnk, Dsor1, Gap1, and Ksr all preferentially dissociated, whereas Phl (Raf) interactors associated (Fig. 4B).
Fig. 4.

Dynamics in the RTK-Ras-ERK signaling network. (A) Subset of total PPI network with a SAINT-based probability of dynamic interaction >0.8 by comparing baseline to insulin condition. (B) Subset of PPI network with dynamic interactions under EGF stimulus. In both (A) and (B), orange lines indicate protein association; blue lines denote dissociation. (C) “Core” network of PPIs that were identified in all three RNAi screen sets. Edge thickness denotes SAINT score, a measure of interaction confidence. Red edges denote those found both in our study and in MasterNet, a literature-based compilation of previously known PPIs. Edge thickness represents SAINT score. Circles represent prey; rectangles represent baits. The size of the node correlates with the number of RNAi screens from which the proteins were isolated. See table S4 for details of all node and edge parameters and names of the proteins identified as pathway interactors.
An integrated map of RTK-Ras-ERK signaling
We overlaid the functional genomic data from our six systematic RNAi screens for ERK activation with the TAP-MS network structural data (Fig. 2). Nearly half of the proteins (119) of the filtered PPI network were encoded by genes that scored in the RNAi screens, which represented a significant enrichment over the genome for regulators of this pathway (19%; P < 7 × 10⁻²⁵) and was an overlap higher than achieved with a more directed RNAi screening of TNFα pathway interactors (18). Thirty-two percent (38 of 119) of the interacting proteins were isolated from RNAi screens in both cell types and after both stimuli (Fig. 4C), whereas if all of the hits from all of the RNAi screens were counted, then only 8% were isolated from both cell types and stimuli.
Together, our RNAi and PPI experiments identified hundreds of previously unknown RTK-Ras-ERK regulators, as well as a core network of genes that were identified with both methods. Because visualization, navigation, and comprehension of complex networks of interacting proteins with functional data can be challenging, we provide our resource of RTK-Ras-ERK interactome and functional genomic data as browsable data files and in Cytoscape format, a graph layout and querying tool (28). However, given the widespread importance of this pathway and to make the integrated network interactive and widely accessible, we also provide access to the data with the Interaction Map (IM) Browser, an online network visualization tool for interactive, dynamic visualization of PPIs (29). Because integration of multiple data sources improves the specificity and reliability of individual high-throughput data, we merged our data with the Drosophila Interactions Database (http://www.droidb.org), which contains previously determined PPIs from Y2H and other studies, a wealth of Drosophila genetic interactions, and predicted conserved interactions, or interologs, from yeast, worms, and humans (30). With these tools, the RTK-Ras-ERK network can be searched, filtered, and overlaid with multiple genomic data sets.
Rtf1, TepIV, PPP6 complex, and CG6453 as regulators of ERK activation in vivo
RTK signaling to ERKs regulates diverse processes during Drosophila development. Among these, phenotypic alterations in the Drosophila eye and wing are the most easily scored, because Ras activity promotes cell growth, cell proliferation, cell survival, and differentiation into vein tissue downstream of EGFR activity. Because most of our newly identified pathway-associated genes do not have known alleles, we tested for phenotypes by expressing RNAi hairpins in Drosophila, which can faithfully recapitulate known phenotypes (31, 32). We tested for phenotypes of multiple genes isolated in our screens by expressing hairpins from a library created for transgenic RNAi, or in a few cases by complementary DNA (cDNA) overexpression, in the developing wing disc (Fig. 5, fig. S4, Table 1, and table S5). Of the 84 genes tested, 48 (57%) had a phenotype in the wing. Consistent with systematic PPI analyses in yeast (13), we found that proteins with a high degree (“hubs”) in MasterNet were no more likely than proteins with a lower degree to result in a wing phenotype.
Fig. 5.

In vivo analysis of newly identified regulators of RTK-Ras-ERK signaling in Drosophila. (A) Knockdown of CG6453 results in a growth defect in the wing. CG6453-Phl interaction was isolated with a SAINT score of 0.99, and CG6453 had a Z score of 1.6 under EGF stimulus in S2R+ cells. (B) Knockdown of TepIV enhances the RasN17 loss of wing vein phenotype consistent with a role as a positive regulator. TepIV had a SAINT probability of 1.0. (C) Knockdown of the PPP6 subunit PpV results in a growth defect in the wing. PpV had a SAINT score of 0.88 with Phl. (D) Knockdown of Rtf1 results in a growth defect in the wing and induces ectopic dpERK staining in the wing disc. Rtf had a Z score of 2.25 under insulin stimulus in S2R+ cells.
Table 1.
In vivo analysis of PPI or RNAi screen hits. Shown are hits with wing phenotypes of any kind. Genes in bold encode proteins identified in the PPI network, as well as were positive hits in the RNAi screens. PPIs with SAINT <0.83 were removed as nonspecific. Values in primary screen categories represent average Z score for two replicates. N/A, not identified in any TAP experiment; Ras[N17], dominant-negative Ras; Elp[B1], gain-of-function EGFR allele; tor[4021], gain-of-function torso allele; MS1096, promoter used to drive expression of the given transgene in the wing. All genes tested are listed in table S5.
| RNAi or PPI hits with wing phenotypes | ||||||||||
|---|---|---|---|---|---|---|---|---|---|---|
|
| ||||||||||
| Symbol | Name | Wing phenotype | Maximum SAINT probability | Baseline S2R+ | 10' Insulin S2R+ | Baseline S2R+mtDER SI | 10' EGF S2R+mtDER | 10' EGF KcmtDER | 30' EGF KcmtDER | Screen |
| uex | unextended | Slight curling | 1.00 | 0.32 | −0.47 | 1.02 | −2.70 | 0.10 | 0.06 | E |
| CG6453 | — | Slight curling | 0.99 | −0.94 | 0.94 | 0.51 | 1.60 | 0.85 | 0.28 | E |
| brm | brahma | Wing size reduced; slight curling; wing shape abnormal | 0.89 | −0.97 | −2.46 | −2.09 | 0.36 | 0.61 | 2.42 | IEK |
| betaCop | β-Coatomer protein | Nearly complete loss of wing tissue | 0.88 | 0.15 | 2.08 | 2.85 | −3.86 | 0.27 | −1.74 | IEK |
| TepIV | Thiolester-containing protein IV | Enhancement of Ras [N17] wing vein phenotype | 1.00 | |||||||
| PpV | Protein phosphatase V | Nearly complete loss of wing tissue | 0.88 | |||||||
| Dref | DNA replication–related element factor | Nearly complete loss of wing tissue | 0.78 | 0.20 | −0.38 | −0.60 | −4.34 | −0.76 | 0.11 | E |
| kis | kismet | Ectopic wing vein material | 0.56 | 1.08 | −1.97 | 0.71 | 0.46 | 0.32 | 2.56 | IK |
| CG6907 | — | Enhancement of Ras[N17] wing vein phenotype | 0.56 | 0.64 | −5.67 | −1.37 | −3.82 | −1.26 | 0.94 | IE |
| ACC | Acetyl-CoA carboxylase | Severely blistered, misshapen, and reduced wing size | 0.56 | −1.45 | −2.89 | −1.81 | 2.02 | 0.42 | −0.58 | IE |
| Chro | Chromator | Severely blistered, misshapen, and reduced wing size | 0.56 | −1.20 | −1.34 | −1.51 | −1.26 | 2.16 | 0.18 | EK |
| CG3523 | — | Slight curling | 0.56 | −0.28 | 2.10 | 1.07 | −3.69 | 0.20 | −0.96 | IE |
| cact | cactus | Wing size reduced; ectopic and missing vein material; Null allele suppresses Elp[B1] phenotype in eye; Null allele suppresses tor[4021] phenotype in embryo | 0.56 | −1.5 | −2.45 | −0.73 | −1.85 | 0.22 | 0.29 | IE |
| Rtf1 | Rtf1 | Severely blistered, misshapen, and reduced wing size; enhanced dpERK staining | 0.56 | −0.95 | 2.25 | 1.22 | 0.45 | 0.2 | 1.37 | I |
| sl | small wing | Ectopic wing veins with MS1096 | 0.53 | 1.61 | 1.19 | −0.43 | 0.72 | 0.76 | −1.03 | I |
| dgt2 | dim γ-tubulin 2 | Enhancement of Ras[N17] wing vein phenotype | 0.53 | 4.39 | 0.15 | 1.27 | 0.46 | −0.52 | −0.54 | I |
| Caf1 | Chromatin assembly factor 1 subunit | Blistered, misshapen, curled, and reduced wing size | 0 | −2.29 | −2.72 | −0.34 | −0.63 | 0.09 | 0.1 | I |
| CG8963 | — | Ectopic wing vein material | 0 | −0.18 | −3.01 | −0.67 | −3.52 | 0.02 | 1.61 | IEK |
| beta'Cop | β'-Coatomer protein | Nearly complete loss of wing tissue | 0 | −0.54 | 2.2 | 5.49 | −3.14 | −0.29 | −0.72 | IE |
| hyx | hyrax | Nearly complete loss of wing tissue | 0 | 3.94 | 2.94 | 2.48 | 0.62 | 2.16 | 1.02 | IEK |
| deltaCOP | delta-coatomer protein | Severely blistered, misshapen, and reduced wing size | 0 | 0.18 | 1.69 | 1.3 | −2.91 | −0.31 | −1.57 | IEK |
| alphaTub85E | α-Tubulin at 85E | Severely blistered, misshapen, and reduced wing size | 0 | 2.74 | −2.83 | 1.88 | −2 | −0.21 | 0.14 | IE |
| Arc42 | Arc42 | Slight curling | 0 | 1.82 | −0.13 | 1.44 | 0.17 | −0.59 | −0.42 | I |
| chinmo | Chronologically inappropriate morphogenesis | Wing size reduced; blistering; upward curling; cDNA overexpression lethal with all drivers tested | 0 | −0.44 | −3.46 | −2.01 | −1.77 | 0.49 | −0.03 | IE |
| CG34422 | — | Wing size reduced; slight curling; pWiz second hairpin also results in smaller, rough wings | 0 | −2.05 | 0.65 | −1.99 | 0.19 | 0.77 | 1.44 | IE |
| CG5844 | — | Wing size reduced; loss of wing vein material | 0 | −3.41 | −4.65 | −1.71 | −6.92 | −1.92 | −0.54 | IEK |
| CG6854 | — | Possible ectopic wing vein material; enhancement of Ras[N17] wing vein phenotype | N/A | 2.54 | −0.81 | −1.48 | −2.84 | 0.74 | 1.7 | IEK |
| Axn | Axin | Possible ectopic wing vein material | N/A | 2.75 | −2.2 | −0.29 | 0.41 | 2.56 | 1.81 | IK |
| CG13298 | — | Blistered, curled, and reduced wing size; ectopic wing vein material | N/A | 6.73 | 1.42 | 1.06 | 0.38 | −1.19 | −0.71 | I |
| Spc105R | Spc105-related | Blistered, misshapen, curled, and reduced wing size | N/A | −3.2 | −1.71 | −0.33 | −3.1 | 0.83 | 0.21 | IE |
| Spn42Dc | Serpin 42Dc | Ectopic wing vein material; suppression of Ras[N17] wing vein phenotype | N/A | 4.67 | 1.26 | 1.7 | 0.48 | −0.43 | 0.02 | IE |
| Cdc27 | Cdc27 | Misshapen and reduced wing size | N/A | 3.11 | −4.07 | 6.12 | −6.57 | −1.6 | −2.16 | IEK |
| wah | waharan | Much smaller wing with loss of wing vein material; hairpin wing phenotype enhanced by DER[DN] (dominant negative); hairpin expression in eye results in rough, smaller eyes | N/A | −0.88 | 1.42 | −0.61 | −7.11 | −1.86 | −0.12 | EK |
| Cap-G | — | Nearly complete loss of wing tissue | N/A | 3.25 | 0.57 | 1.72 | 0.64 | −0.18 | 1.07 | IE |
| CG6984 | — | Enhancement of Ras[N17] wing vein phenotype | N/A | 6.42 | −0.83 | −0.34 | 0.69 | −0.27 | −0.3 | I |
| CG43073 | — | Overexpression in wing results in expanded A-P axis and ectopic wing veins | N/A | −3.79 | −2.58 | −1.65 | −6.08 | −1.39 | 2.23 | IEK |
| dco | discs overgrown | Overexpression in wing results in expanded A-P axis and thickened wing veins and suppresses RasN17 (dominant negative) wing vein phenotype; overexpression in the eye produces a rough eye phenotype | N/A | 1.99 | 1.03 | 0.86 | 0.58 | −0.19 | 0.22 | I |
| Not1 | Not1 | Severely blistered, misshapen, and reduced wing size; pWiz second hairpin expression in wing also results in loss of most tissue; overexpression in wing results in ectopic wing veins; hairpin expression in eye results in rough, smaller eye | N/A | 1.61 | −1.97 | −3.28 | −4.41 | 2.66 | 2.31 | IEK |
| ago | archipelago | Slight curling; enhancement of Ras[N17] wing vein phenotype | N/A | 0.71 | 4.15 | 1.47 | 1.47 | 0.13 | −0.53 | I |
| fzy | fizzy | Slight curling; suppression of Ras[N17] wing vein phenotype | N/A | −0.76 | −3.97 | −1.47 | −4.98 | −0.51 | 1.24 | IE |
| Vha100-5 | Vacuolar H[+] ATPase subunit 100-5 | Slight curling | N/A | 1.64 | −1.12 | −1.29 | −2.07 | 1.53 | 0.08 | IEK |
| CG6608 | — | Slight curling | N/A | −0.25 | −2.59 | −0.35 | −1.22 | 0.55 | 0.25 | I |
| CoRest | CoRest | Slight curling; ectopic wing vein material; suppression of Ras[N17] wing vein phenotype | N/A | 2.82 | −3.13 | 1.30 | −1.98 | 1.52 | 0.88 | IEK |
| Vps4 | Vacuolar protein sorting 4 | Upward curling; suppression of Ras[N17] wing vein phenotype | N/A | −0.64 | −2.87 | 0.12 | −5.01 | −2.68 | −3.6 | IEK |
| aret | arrest | Upward curling; possible wing vein defect | N/A | −2.8 | −6.28 | −2.76 | −5.98 | 0.48 | 5.45 | IEK |
| CG17665 | — | Wing size reduced; upward curling; pWiz and TRiP hairpin enhance Ras[N17] wing vein phenotype | N/A | 1.99 | 0.65 | 0.77 | −0.57 | 0.78 | 1 | I |
| uri | unconventional prefoldin RPB5 interactor | Wing size reduced; upward curling; suppression of Ras[N17] phenotype | N/A | −0.11 | −3.65 | −0.27 | −2.21 | −1.13 | −1.02 | IE |
| CG3332 | — | Wing size reduced; upward curling | N/A | −0.02 | −2.21 | −0.53 | −0.02 | 1.09 | 0.78 | I |
We found that even genes that were identified both in RNAi screens and in the PPI interaction network were no more likely than genes isolated from each individually to score in wing phenotypes. One of the genes that were positive in both the functional genomic screen and the interaction screen was CG6453, which encodes a noncatalytic subunit of glucosidase II. The interaction between the CG6453 protein and Raf had a high SAINT score, and coimmunoprecipitation experiments confirmed this interaction (fig. S3A). In the S2R+ EGFR RNAi screen, this gene was a negative regulator, and we demonstrated that its depletion by RNAi resulted in a growth and patterning defect (ectopic wing vein material) in the wing, which is consistent with negative regulation of the pathway (Fig. 5A). Although genes encoding TepIV, the Drosophila homolog of a glycophosphatidylinositol (GPI)–linked protein that is mutated in human cancers, and components of the protein phosphatase PPP6 complex, its catalytic subunit PpV and regulatory subunit CG10289, were not found in the RNAi screens, these proteins were positive in the interaction screen. We confirmed their interactions with pathway components by coimmunoprecipitation (fig. S3A) and demonstrated that their knockdown produced in vivo phenotypes (Fig. 5, B and C). TepIV interacted with Ksr and, despite not scoring in our RNAi screens and having a weak RNAi phenotype in cells, nevertheless modified the RasN17 phenotype, consistent with a role as a positive regulator (Fig. 5B). PpV and CG10289 interacted with each other and Raf, and PpV depletion resulted in a growth defect in the wing (Fig. 5C). Finally, Rtf1, a histone methyltransferase, was a weak interactor with multiple pathway components and was filtered out of the final PPI network because of its SAINT score. However, the gene encoding this protein was identified as a negative regulator in our RNAi screens, and we confirmed an in vivo phenotype associated with increased dpERK (indicating increased activity) in the wing (Fig. 5D), showing that Rtf1 is a bona fide regulator of ERK activation.
DISCUSSION
Dissection of oncogenic signaling pathways with functional genomics and proteomics approaches facilitates understanding dynamic information processing and how these pathways may be disrupted by mutations or targeted therapeutically (26). By combining multiple, parallel genome-wide RNAi screens and TAP-MS interactome screens, we have assembled an integrated network of RTK-Ras-ERK signaling with both PPI interactions and functional information obtained in the same signaling environment. This network provides a resource for subsequent hypothesis-driven, mechanistic investigation of hundreds of conserved regulators.
Because high-throughput data sets are individually susceptible to multiple sources of technical and biological noise, confidence in subsets of any given “omics” data set can be increased by overlapping contrasting experimental approaches. Most integrative efforts up to now have queried data sets generated under disparate conditions and even different organisms. We found that only a small fraction of the hits from interactome or functional screening were isolated under all conditions tested, and most of these represented known “canonical” pathway components. Many of the hits that were identified from each method individually also showed evidence of activity in vivo. Comparing our studies to other studies of MAPK regulators suggests that the complete landscape of proteins regulating RTK-Ras-ERK signaling under specific conditions is likely to be larger than the conservative overlapping network that we describe. In comparison to a Y2H screen for MAPK pathway interactors, where >600 interactions were identified (14), only 54 proteins overlapped with our network, 30 (56%) of which also were positive in our RNAi screen, including the proton transporter ATPsyn-β (ATP5B), which was a negative regulator in our RNAi screens. Of the 31 proteins from a study of dynamic ERK interactors that overlapped with our filtered data set (27), 22 were encoded by genes positive in our RNAi screens, but only one, heat shock protein 60 (HspD1), was pulled down by ERK itself in our study. However, another 16 proteins interacted with Raf and 8 interacted with Dsor (MEK). By considering the Raf-MEK-ERK cassette as a whole, the number of overlapping interactions increased. Although these comparisons are limited by the differences in Y2H and TAP-MS techniques, the population of regulators that can be identified is probably highly technique- and condition-specific, and this work should be seen as a “first pass” at identifying the universe of proteins regulating the output of this pathway.
We used PPI mapping and functional genomic methods to identify several previously unknown regulators that also exhibited in vivo roles in RTK-Ras-ERK signaling. Translation of cell culture regulators to in vivo phenotypes is challenging due to lack of knowledge of the correct tissue in which to test for activity. Because many of the newly identified regulators are likely cell type– and RTK-specific, we were unable to identify phenotypes in the wing disc for many of these regulators. A large number of genes positive in the RNAi screens were not identified in the PPI network, either because of false negatives or because the encoding proteins modulate activity of the pathway indirectly. A prime example of this latter category is Rtf1, a histone methyltransferase knockdown of which enhanced ERK activation in vivo. Rtf1 enhances Notch pathway activity (33), and the Notch pathway can inhibit ERK activity (34); thus, Rtf1 may be a key mediator of Notch-ERK crosstalk. In contrast, we identified another protein phosphatase 2A (PP2A) family member, the PPP6 ortholog PpV and its regulatory subunit CG10289, as interacting with Raf, but did not identify the genes encoding these proteins in our RNAi screens. In mammals, PPP6 components can interact with the inhibitor of nuclear factor κB IκBε (18, 35) and regulate the cell cycle in normal and pathological contexts. The role of the Ser-Thr phosphatase PP2A in the Ras pathway has been principally described as a positive regulator through dephosphorylation of Ser259 on Raf and Ser392 on Ksr (numbering is based on human proteins), inducing 14-3-3 protein dissociation (36); PPP6 may play a similar role in Raf activation in specific in vivo contexts. CG6453, a noncatalytic subunit of glucosidase II, was identified in the interaction screen and was identified in the RNAi screens, indicating a high-confidence interactor. Although its mechanism of regulating MAPK output remains unknown, it is consistent with the growing recognition that metabolic and other genes previously thought to have “housekeeping” roles can have specific functions in signaling (37, 38). Finally, despite its interaction with intracellular Ksr, TepIV has homology with CD109, a GPI-linked cell surface marker of T cells, endothelial cells, and activated platelets, that contains a protease inhibitor α2 macroglobulin domain (39); CD109 is mutated in 7% of colorectal cancers (40) and may thus affect ERK output in these cancers. As more human cancers are characterized through ongoing large-scale next-generation sequencing, our data set of regulators of RTK-Ras-ERK signaling will provide a resource for understanding the potential mechanistic contribution of somatic mutations to cancer development.
MATERIALS AND METHODS
RNAi screening
Primary screening procedures were performed as published previously (4, 41). We derived an S2R+ cell line expressing DER (EGFR) from a metallothionein promoter (S2R+mtDER) also expressing cyan fluorescent protein (CFP)–tagged Dsor1 (MEK) and yellow fluorescent protein (YFP)–tagged Rl (ERK) (4). We confirmed ERK activation after secreted Spitz (sSpitz) (EGF in mammals) stimulus of both endogenous and tagged ERK by Western blotting and high-throughput format, and confirmed assay sensitivity, using dsRNAs targeting canonical components of the RTK-Ras-ERK pathway. For primary screening in Kc167 cells, we used our previously described cell line Kc167 expressing DER (EGFR) from a metallothionein promoter (Kc mtDER) (4) and modified the high-throughput assay with our Alexa 647–conjugated dpERK antibody normalized to DAPI (4′,6-diamidino-2-phenylindole) staining of nuclei to quantify ERK activity. Cells were stimulated with conditioned media containing sSpitz for 10 or 30 min. We performed secondary screens as described (41), using S2R+ and Kc cell lines with insulin (25 μg/ml) or sSpitz-containing conditioned media. Briefly, cell lines were seeded in plates prepopulated with resynthe-sized dsRNA amplicons identified from the primary screen as InR- or EGFR-specific. After stimulation, cells were fixed and stained for dpERK as previously described. Primary screen hits were prefiltered for computationally predicted off-target effects, which is generally sufficient to reduce off-target noise to below assay noise (4); however, any individual dsRNA should be treated with caution until validated with multiple amplicons (42). A Z score threshold of ±1.5 was used as the primary screen cutoff and is an average of replicate screens under each condition. Full data sets and dsRNA sequence information are available at the Drosophila RNAi Screening Center (DRSC) Web site (http://www.flyrnai.org).
TAP and MS
TAP expression vectors permitting low-level expression of tagged components in stable Drosophila cell lines using the metallothionein promoter have been previously described (20). For the bait proteins, we cloned InR, PVR, EGFR, Drk (Grb2), Dos (Gab), Sos, Src42A, Gap1, Csw (Shp2), Ras85D, Phl (Raf), Dsor1 (MEK), Ksr, Cnk, and Rl (ERK) into the C-terminal tag TAP vector and created stable cell lines for each, as well as a control cell line for subtracting nonspecific interactors or contaminants. All cell lines except InR-TAP also expressed EGFR from an uninduced metallothionein promoter (resulting in minimal low-level expression) for induction with sSpitz (EGF). Cells (1 × 10⁹ to 2 × 10⁹) induced with 140 μM CuSO4 overnight were used for each lysis at the given condition. Cells were lysed as described (20) and in-solution TAP was performed essentially as described (43), with the exception of final washes and elution, which was performed in ammonium bicarbonate buffer without detergent for LC-MS/MS analysis. At least two biological replicates were performed for each bait and condition.
Several micrograms of TAP immunoprecipitation from each bait condition were reduced with 10 mM dithiothreitol at 55°C, alkylated with 55 mM iodoacetamide at room temperature, and then digested overnight with 2.5 μg of modified trypsin (Promega) at pH 8.3 (50 mM ammonium bicarbonate) in a total of 200 μl. The digest was stopped with 5% trifluoroacetic acid (TFA) and cleaned of buffer and debris with a C18 ZipTip (Millipore). Thirty-five microliters of aqueous high-performance liquid chromatography (HPLC) A buffer was added to the C18 ZipTip elution (50% acetonitrile/0.1% TFA) and was dried to 10 μl to concentrate the sample and remove organic content.
A 5-μl aliquot was injected onto the microcapillary LC-MS/MS system for sequencing. The microcapillary LC-MS/MS setup consisted of a 75-μm inside diameter (ID) × 10-cm length microcapillary column (New Objective Inc.) self-packed with Magic C18 (Michrom Bioresources) and operated at a flow rate of 300 nl/min by means of a splitless EASY-nLC system (Thermo Fisher Scientific). The HPLC gradient was 3 to 38% B over 60 min followed by a 7-min wash at 95% B. The column was preequilibrated with A buffer for 15 min at 0% B before the runs (A: 99% water/0.9% acetonitrile/0.1% acetic acid; B: 99% acetonitrile/0.9% water/0.1% acetic acid). The microcapillary LC system is coupled directly to an LTQ Orbitrap XL mass spectrometer (Thermo Fisher Scientific) operated in positive ion mode for data-dependent acquisitions (DDAs) [Top 5: one Fourier transform (FT) survey scan followed by five scans of peptide fragmentation (MS/MS) in the ion trap by collision-induced dissociation (CID) using helium gas]. The spray tip voltage was 2.8 kV and capillary voltage was 35 V. A single microscan with a maximum inject time of 400 ms was used for the FT-MS scan in the Orbitrap, and 110 ms was used for the MS/MS scans in the ion trap. Typically, between 3000 and 6000 MS/MS spectra were collected per run. The total number of LC-MS/MS runs collected for this study was 94 and collected over a 6-month period. All LC-MS/MS runs were separated by at least one blank run to prevent column carryover. Raw MS/MS spectra are available by request and are deposited in Proteome Commons as data set 76892.
All collected MS/MS fragmentation spectra were searched against the reversed dmel-all-translation protein database (FlyBase Consortium) version 5.4 (41,644 protein entries, January 2008) using the Sequest search engine in Proteomics Browser Software (Thermo Scientific). Differential posttranslational modifications including deamidation of QN (glutamine and asparagine) (+0.989 dalton) and oxidation of methionine (+15.9949 daltons), common in vitro modifications that occur during sample processing, were included in the database searches. From Sequest, protein groups containing at least two unique identified peptides were initially accepted if they were top-ranked matches against the forward (target) dmel-all-translation protein database and with a consensus score of greater or equal to 1.0. Individual peptides that were not part of protein groups were accepted if they matched the target database and passed the following stringent Sequest scoring thresholds: 1+ ions, Xcorr ≥1.9, Sf ≥0.75, P ≥ 1; 2+ ions, Xcorr ≥2.0, Sf ≥0.75, P ≥ 1; 3+ ions, Xcorr ≥2.55, Sf ≥0.75, P ≥ 1. After passing the initial scoring thresholds, all peptide hits not contained in protein groups were then manually inspected to be sure that all b (fragment ions resulting from amide bond breaks from the peptide's N terminus) and y ions (fragment ions resulting from amide bond breaks from the peptide's C terminus) aligned with the assigned sequence using tools (FuzzyIons and GraphMod) in Proteomics Browser Software (Thermo Fisher Scientific). An FDR rate of 1.84% for peptide hits and 0.6% for protein hits was calculated on the basis of the number of reversed database hits above the scoring thresholds.
Computational analysis of TAP-MS data
We used the “significance analysis of interactome” (SAINT) algorithm to calculate probability scores for interactions observed by MS. SAINT uses spectral count data and constructs separate distributions for true and false interactions to derive the probability of a bona fide PPI. Because SAINT models spectral counts with a unimodal distribution, we ran the algorithm separately for each condition and combined the scores. Specifically, we assumed that each condition was conditionally independent given the spectral count data and computed the probability that the interaction was true in any condition. For proteins A and B in conditions 1 to n, the combined score is computed as:
where P(A ↔ B cond i) is the SAINT score for condition i. Some proteins were not used as baits in all conditions; hence, some interactions that were observed in one condition could not be observed in another. In this case, we used the previous probability of an interaction occurring in that condition as computed by the SAINT algorithm. In the general setting, this would be the probability that a randomly chosen pair of proteins interact, that is, (number of interacting pairs of proteins)/(number of pairs of proteins). In our specific case, we are choosing a pair of proteins from proteins that are observable in MS, so we adjust the ratio accordingly to our specific setting.
Additionally, we computed pairwise dynamic difference scores between conditions (the probability that an interaction is true in one condition but not the other), assuming the conditions were conditionally independent given the spectral count data.
To determine a high-confidence threshold, we constructed a set of true-positive interactions by overlapping our experimental interactions with BioGRID. This list contained 49 interactions between 114 proteins. We formed a true-negative set by taking interactions that were more than three hops away in the BioGRID protein interaction network. A receiver operating characteristic (ROC) curve generated with this gold standard list and generated with fly binary and fly complex data is shown in fig. S2, A and B. We chose 0.83 as the cutoff to achieve a 7.2% false-positive rate and 26.5% true-positive rate, which is comparable to the results achieved in (15).
Additional statistical analysis
Filtered binary interactions were graphed using the Cytoscape environment (28). For analysis of feedback regulation, three in vivo microarray studies were collated (23–25). Microarray data from in vivo analysis of mesoderm (24) were reanalyzed to focus on subgroups for the RTK-Ras-ERK pathway only, excluding other pathway data sets.
Human orthologs were predicted with DIOPT, an integrative ortholog prediction tool developed at DRSC (44) (http://www.flyrnai.org/cgi-bin/DRSC_orthologs.pl). The orthologs with the best prediction score, reflecting the number of methods from which the prediction was identified, were selected. Potential human disease-related fly homolog information was obtained from Homophila version 2.1 (45). Gene expression levels were obtained from DRSC (http://www.flyrnai.org/cgi-bin/RNAi_expression_levels.pl), and cell line gene expression data were obtained from the modENCODE project (46). The significance of conserved genes, expressed genes, or disease-related genes was tested by calculating cumulative hypergeometric probability. The enrichment of GO annotations for Molecular Function and Biological Process, as well as Panther pathway annotation, was performed with the online DAVID tool (http://david.abcc.ncifcrf.gov/) (47). Hierarchical clustering and graphing was performed with the MultiExperiment Viewer, Cluster, and Java TreeView programs (48–50).
MasterNet is a compilation of databases. (i) Fly binary PPI network: This network was constructed by integrating experimentally identified binary PPIs (direct physical interactions) from major PPI databases, such as BioGRID (51), IntAct (52), MINT (53), DIP (54), and DroID (30). The fly binary PPI network consists of 29,325 interactions between 8161 proteins. The PPIs were downloaded from the source databases in PSI-MI format (55), and the gene/protein identifiers were mapped to FlyBase (56) gene identifiers. (ii) Interolog binary PPI network: PPIs were predicted on the basis of experimentally identified binary PPIs for human, mouse, worm, and yeast. (iii) Interolog protein complexes network: PPIs were predicted from experimentally identified protein complexes for human, mouse, worm, and yeast. Both the interolog networks were compiled from BioGrid, IntAct, MINT, DIP, and HPRD (57) databases. The PSI-MI files were downloaded from the source databases and the experimental identifier from interaction detection type field was used to sort the PPI as either binary or complex. Using ortholog annotation from DIOPT database, we mapped 129,090 PPIs between 5954 proteins to fly. (iv) Kinase-substrate network: For each experimentally verified phosphorylation site, the kinase that phosphorylates that site was predicted with the NetPhorest program (58, 59). The program uses probabilistic sequence models of linear motifs to predict kinase-substrate relationships. The fly kinase-substrate network consists of 26,736 interactions between 55 kinases and 2518 substrate proteins. (v) Domain-domain interaction (DDI) network: Known and predicted protein DDIs were extracted from DOMINE database (60), which includes 26,219 interactions inferred from Protein Data Bank (PDB, http://www.pdb.org) entries and those that are predicted by 13 different computational approaches using Pfam domain definitions. For network integration, we considered only high-confidence DDIs as defined by DOMINE and those derived from crystal structures.
Western blotting and coimmunoprecipitation
All Western blotting and coimmunoprecipitation procedures and antibodies used were previously described (4). Quantification of dpERK and total ERK (used as normalization value) was performed with the LI-COR detection system. Western blotting and coimmunoprecipitation experiments were performed a minimum of two times.
In vivo analysis
Stocks used for genetic analysis were obtained from Bloomington except where noted. All hemagglutinin-tagged cDNA constructs were cloned by polymerase chain reaction (PCR) cloning with Phusion Polymerase (New England Biolabs) into pUAST. cDNA clones or libraries used as templates were as follows: Dco (LD04938), CG31666 (SD04616), Rack1 (RE74715), CG1884 (cDNA library), and CG31302 (AT04807). Hairpins described in the text were cloned into pWiz as described previously (61) using the following primers: CG7282: CACGCCCAGCTGTCAG, TTCACGTTCTCCAGTTTCTC; CG3878: CAGCTCCGCAGTGCTCGTGT, AGTTGTCGTCGTCGGAGCTC; CG1884: TCGGCTTGGGCACAAAC, AAGGACTTCGCCCTGGAT; and CG17665: GCAGAAGCAATAGCCGAATC, ATTTTCTCATCTGCCGCATC. Other RNAi hairpins were designed with the attP targeted transgenic system for an in vivo RNAi project (“TRiP” lines) as described (31), as well as RNAi lines from Vienna Drosophila RNAi Center and NIG-Fly Japan stock center. Other fly lines are y,w,hsFlp, MS1096-Gal4, UAS Ras1N17, ElpB1/CyO, apterous-Gal4, and UAS-mCD8-GFP/CyO. For dpERK staining, wing discs from third instar larvae were dissected in cold phosphate-buffered saline (PBS), fixed for 15 min in 4% formaldehyde, and washed in PBS + 0.1% Triton. Discs were stained with a rabbit antibody that recognizes dpERK (Cell Signaling). Wings of the indicated genotype were mounted in a 1:1 mixture of Per-mount and xylenes.
A complete list of the hairpin lines used in this study is given table S6.
Supplementary Material
Acknowledgments
We thank the DRSC and its staff for RNAi screening reagents and advice and current and former members of the Perrimon lab for reagents and discussions. We thank M. Herman for help with in vivo analysis; P. Schmid and N. Palmer for additional data analysis; C. Bakal, M. Kulkarni, and B. Mathey-Prevot for critical manuscript review; and X. Yang for help with MS experiments.
Funding: A.A.F. was supported by the Medical Scientist Training Program. R.L.F. was supported by NIH R01 HG001536. This work was supported in part by R01 DK071982 to N.P. and P01 CA120964 to N.P. and J.M.A. N.P. is an investigator of the Howard Hughes Medical Institute.
Footnotes
Author contributions: A.A.F. and N.P. designed the project. A.A.F., D.Y., R.B., and M.P. performed the experiments. J.M.A. performed the MS experiments. G.T., R.S., A.V., Y.H., P.H., X.S., and B.B. designed and performed statistical analysis. S.P., T.M., and R.L.F. integrated the data into DroID. A.A.F. and N.P. wrote the manuscript.
Competing interests: The authors declare that they have no competing interests.
Data availability: Full data sets and dsRNA sequence information are available at the DRSC Web site (http://www.flyrnai.org). MS data are supplied as peptide reads and values in the Supplementary Materials, and interactions are deposited in DroID (http://www.droidb.org). MS data are available through Proteome Commons data set 76892.
SUPPLEMENTARY MATERIALS www.sciencesignaling.org/cgi/content/full/4/196/rs10/DC1
Cytoscape file for the PPI and RNAi data.
Excel spreadsheets of peptides isolated in each TAP-MS experiment.
REFERENCES AND NOTES
- 1.Karapetis CS, Khambata-Ford S, Jonker DJ, O'Callaghan CJ, Tu D, Tebbutt NC, Simes RJ, Chalchal H, Shapiro JD, Robitaille S, Price TJ, Shepherd L, Au HJ, Langer C, Moore MJ, Zalcberg JR. K-ras mutations and benefit from cetuximab in advanced colorectal cancer. N. Engl. J. Med. 2008;359:1757–1765. doi: 10.1056/NEJMoa0804385. [DOI] [PubMed] [Google Scholar]
- 2.Friedman A, Perrimon N. Genetic screening for signal transduction in the era of network biology. Cell. 2007;128:225–231. doi: 10.1016/j.cell.2007.01.007. [DOI] [PubMed] [Google Scholar]
- 3.Friedman A, Perrimon N. A functional RNAi screen for regulators of receptor tyrosine kinase and ERK signalling. Nature. 2006;444:230–234. doi: 10.1038/nature05280. [DOI] [PubMed] [Google Scholar]
- 4.Cela C, Llimargas M. Egfr is essential for maintaining epithelial integrity during tracheal remodelling in Drosophila. Development. 2006;133:3115–3125. doi: 10.1242/dev.02482. [DOI] [PubMed] [Google Scholar]
- 5.Kratchmarova I, Blagoev B, Haack-Sorensen M, Kassem M, Mann M. Mechanism of divergent growth factor effects in mesenchymal stem cell differentiation. Science. 2005;308:1472–1477. doi: 10.1126/science.1107627. [DOI] [PubMed] [Google Scholar]
- 6.Yamamoto T, Ebisuya M, Ashida F, Okamoto K, Yonehara S, Nishida E. Continuous ERK activation downregulates antiproliferative genes throughout G1 phase to allow cell-cycle progression. Curr. Biol. 2006;16:1171–1182. doi: 10.1016/j.cub.2006.04.044. [DOI] [PubMed] [Google Scholar]
- 7.Major MB, Roberts BS, Berndt JD, Marine S, Anastas J, Chung N, Ferrer M, Yi X, Stoick-Cooper CL, von Haller PD, Kategaya L, Chien A, Angers S, MacCoss M, Cleary MA, Arthur WT, Moon RT. New regulators of Wnt/β-catenin signaling revealed by integrative molecular screening. Sci. Signal. 2008;1:ra12. doi: 10.1126/scisignal.2000037. [DOI] [PubMed] [Google Scholar]
- 8.Ashton-Beaucage D, Udell CM, Lavoie H, Baril C, Lefrançois M, Chagnon P, Gendron P, Caron-Lizotte O, Bonneil E, Thibault P, Therrien M. The exon junction complex controls the splicing of MAPK and other long intron-containing transcripts in Drosophila. Cell. 2010;143:251–262. doi: 10.1016/j.cell.2010.09.014. [DOI] [PubMed] [Google Scholar]
- 9.Kockel L, Kerr KS, Melnick M, Brückner K, Hebrok M, Perrimon N. Dynamic switch of negative feedback regulation in Drosophila Akt-TOR signaling. PLoS Genet. 2010;6:e1000990. doi: 10.1371/journal.pgen.1000990. [DOI] [PMC free article] [PubMed] [Google Scholar]
- 10.Zeng Q, Dong JM, Guo K, Li J, Tan HX, Koh V, Pallen CJ, Manser E, Hong W. PRL-3 and PRL-1 promote cell migration, invasion, and metastasis. Cancer Res. 2003;63:2716–2722. [PubMed] [Google Scholar]
- 11.Hunt RA, Edris W, Chanda PK, Nieuwenhuijsen B, Young KH. Snapin interacts with the N-terminus of regulator of G protein signaling 7. Biochem. Biophys. Res. Commun. 2003;303:594–599. doi: 10.1016/s0006-291x(03)00400-5. [DOI] [PubMed] [Google Scholar]
- 12.Evangelista M, Lim TY, Lee J, Parker L, Ashique A, Peterson AS, Ye W, Davis DP, de Sauvage FJ. Kinome siRNA screen identifies regulators of ciliogenesis and Hedgehog signal transduction. Sci. Signal. 2008;1:ra7. doi: 10.1126/scisignal.1162925. [DOI] [PubMed] [Google Scholar]
- 13.Yu H, Braun P, Yildirim MA, Lemmens I, Venkatesan K, Sahalie J, Hirozane-Kishikawa T, Gebreab F, Li N, Simonis N, Hao T, Rual JF, Dricot A, Vazquez A, Murray RR, Simon C, Tardivo L, Tam S, Svrzikapa N, Fan C, de Smet AS, Motyl A, Hudson ME, Park J, Xin X, Cusick ME, Moore T, Boone C, Snyder M, Roth FP, Barabási AL, Tavernier J, Hill DE, Vidal M. High-quality binary protein interaction map of the yeast interactome network. Science. 2008;322:104–110. doi: 10.1126/science.1158684. [DOI] [PMC free article] [PubMed] [Google Scholar]
- 14.Bandyopadhyay S, Chiang CY, Srivastava J, Gersten M, White S, Bell R, Kurschner C, Martin CH, Smoot M, Sahasrabudhe S, Barber DL, Chanda SK, Ideker T. A human MAP kinase interactome. Nat. Methods. 2010;7:801–805. doi: 10.1038/nmeth.1506. [DOI] [PMC free article] [PubMed] [Google Scholar]
- 15.Breitkreutz A, Choi H, Sharom JR, Boucher L, Neduva V, Larsen B, Lin ZY, Breitkreutz BJ, Stark C, Liu G, Ahn J, Dewar-Darch D, Reguly T, Tang X, Almeida R, Qin ZS, Pawson T, Gingras AC, Nesvizhskii AI, Tyers M. A global protein kinase and phosphatase interaction network in yeast. Science. 2010;328:1043–1046. doi: 10.1126/science.1176495. [DOI] [PMC free article] [PubMed] [Google Scholar]
- 16.Gavin AC, Aloy P, Grandi P, Krause R, Boesche M, Marzioch M, Rau C, Jensen LJ, Bastuck S, Dümpelfeld B, Edelmann A, Heurtier MA, Hoffman V, Hoefert C, Klein K, Hudak M, Michon AM, Schelder M, Schirle M, Remor M, Rudi T, Hooper S, Bauer A, Bouwmeester T, Casari G, Drewes G, Neubauer G, Rick JM, Kuster B, Bork P, Russell RB, Superti-Furga G. Proteome survey reveals modularity of the yeast cell machinery. Nature. 2006;440:631–636. doi: 10.1038/nature04532. [DOI] [PubMed] [Google Scholar]
- 17.Krogan NJ, Cagney G, Yu H, Zhong G, Guo X, Ignatchenko A, Li J, Pu S, Datta N, Tikuisis AP, Punna T, Peregrin-Alvarez JM, Shales M, Zhang X, Davey M, Robinson MD, Paccanaro A, Bray JE, Sheung A, Beattie B, Richards DP, Canadien V, Lalev A, Mena F, Wong P, Starostine A, Canete MM, Vlasblom J, Wu S, Orsi C, Collins SR, Chandran S, Haw R, Rilstone JJ, Gandi K, Thompson NJ, Musso G, St Onge P, Ghanny S, Lam MH, Butland G, Altaf-Ul AM, Kanaya S, Shilatifard A, O'Shea E, Weissman JS, Ingles CJ, Hughes TR, Parkinson J, Gerstein M, Wodak SJ, Emili A, Greenblatt JF. Global landscape of protein complexes in the yeast Saccharomyces cerevisiae. Nature. 2006;440:637–643. doi: 10.1038/nature04670. [DOI] [PubMed] [Google Scholar]
- 18.Bouwmeester T, Bauch A, Ruffner H, Angrand PO, Bergamini G, Croughton K, Cruciat C, Eberhard D, Gagneur J, Ghidelli S, Hopf C, Huhse B, Mangano R, Michon AM, Schirle M, Schlegl J, Schwab M, Stein MA, Bauer A, Casari G, Drewes G, Gavin AC, Jackson DB, Joberty G, Neubauer G, Rick J, Kuster B, Superti-Furga G. A physical and functional map of the human TNF-α/NF-κB signal transduction pathway. Nat. Cell Biol. 2004;6:97–105. doi: 10.1038/ncb1086. [DOI] [PubMed] [Google Scholar]
- 19.Behrends C, Sowa ME, Gygi SP, Harper JW. Network organization of the human autophagy system. Nature. 2010;466:68–76. doi: 10.1038/nature09204. [DOI] [PMC free article] [PubMed] [Google Scholar]
- 20.Veraksa A, Bauer A, Artavanis-Tsakonas S. Analyzing protein complexes in Drosophila with tandem affinity purification–mass spectrometry. Dev. Dyn. 2005;232:827–834. doi: 10.1002/dvdy.20272. [DOI] [PubMed] [Google Scholar]
- 21.Blanchard DA, Mouhamad S, Auffredou MT, Pesty A, Bertoglio J, Leca G, Vazquez A. Cdk2 associates with MAP kinase in vivo and its nuclear translocation is dependent on MAP kinase activation in IL-2-dependent Kit 225 T lymphocytes. Oncogene. 2000;19:4184–4189. doi: 10.1038/sj.onc.1203761. [DOI] [PubMed] [Google Scholar]
- 22.Stelling J, Sauer U, Szallasi Z, Doyle FJ, III, Doyle J. Robustness of cellular functions. Cell. 2004;118:675–685. doi: 10.1016/j.cell.2004.09.008. [DOI] [PubMed] [Google Scholar]
- 23.Asha H, Nagy I, Kovacs G, Stetson D, Ando I, Dearolf CR. Analysis of Ras-induced overproliferation in Drosophila hemocytes. Genetics. 2003;163:203–215. doi: 10.1093/genetics/163.1.203. [DOI] [PMC free article] [PubMed] [Google Scholar]
- 24.Estrada B, Choe SE, Gisselbrecht SS, Michaud S, Raj L, Busser BW, Halfon MS, Church GM, Michelson AM. An integrated strategy for analyzing the unique developmental programs of different myoblast subtypes. PLoS Genet. 2006;2:e16. doi: 10.1371/journal.pgen.0020016. [DOI] [PMC free article] [PubMed] [Google Scholar]
- 25.Jordan KC, Hatfield SD, Tworoger M, Ward EJ, Fischer KA, Bowers S, Ruohola-Baker H. Genome wide analysis of transcript levels after perturbation of the EGFR pathway in the Drosophila ovary. Dev. Dyn. 2005;232:709–724. doi: 10.1002/dvdy.20318. [DOI] [PubMed] [Google Scholar]
- 26.Kolch W, Pitt A. Functional proteomics to dissect tyrosine kinase signalling pathways in cancer. Nat. Rev. Cancer. 2010;10:618–629. doi: 10.1038/nrc2900. [DOI] [PubMed] [Google Scholar]
- 27.von Kriegsheim A, Baiocchi D, Birtwistle M, Sumpton D, Bienvenut W, Morrice N, Yamada K, Lamond A, Kalna G, Orton R, Gilbert D, Kolch W. Cell fate decisions are specified by the dynamic ERK interactome. Nat. Cell Biol. 2009;11:1458–1464. doi: 10.1038/ncb1994. [DOI] [PMC free article] [PubMed] [Google Scholar]
- 28.Cline MS, Smoot M, Cerami E, Kuchinsky A, Landys N, Workman C, Christmas R, Avila-Campilo I, Creech M, Gross B, Hanspers K, Isserlin R, Kelley R, Killcoyne S, Lotia S, Maere S, Morris J, Ono K, Pavlovic V, Pico AR, Vailaya A, Wang PL, Adler A, Conklin BR, Hood L, Kuiper M, Sander C, Schmulevich I, Schwikowski B, Warner GJ, Ideker T, Bader GD. Integration of biological networks and gene expression data using Cytoscape. Nat. Protoc. 2007;2:2366–2382. doi: 10.1038/nprot.2007.324. [DOI] [PMC free article] [PubMed] [Google Scholar]
- 29.Pacifico S, Liu G, Guest S, Parrish JR, Fotouhi F, Finley RL., Jr. A database and tool, IM Browser, for exploring and integrating emerging gene and protein interaction data for Drosophila. BMC Bioinformatics. 2006;7:195. doi: 10.1186/1471-2105-7-195. [DOI] [PMC free article] [PubMed] [Google Scholar]
- 30.Murali T, Pacifico S, Yu J, Guest S, Roberts GG, III, Finley RL., Jr. DroID 2011: A comprehensive, integrated resource for protein, transcription factor, RNA and gene interactions for Drosophila. Nucleic Acids Res. 2011;39:D736–D743. doi: 10.1093/nar/gkq1092. [DOI] [PMC free article] [PubMed] [Google Scholar]
- 31.Ni JQ, Markstein M, Binari R, Pfeiffer B, Liu LP, Villalta C, Booker M, Perkins L, Perrimon N. Vector and parameters for targeted transgenic RNA interference in Drosophila melanogaster. Nat. Methods. 2008;5:49–51. doi: 10.1038/nmeth1146. [DOI] [PMC free article] [PubMed] [Google Scholar]
- 32.Dietzl G, Chen D, Schnorrer F, Su KC, Barinova Y, Fellner M, Gasser B, Kinsey K, Oppel S, Scheiblauer S, Couto A, Marra V, Keleman K, Dickson BJ. A genome-wide transgenic RNAi library for conditional gene inactivation in Drosophila. Nature. 2007;448:151–156. doi: 10.1038/nature05954. [DOI] [PubMed] [Google Scholar]
- 33.Tenney K, Gerber M, Ilvarsonn A, Schneider J, Gause M, Dorsett D, Eissenberg JC, Shilatifard A. Drosophila Rtf1 functions in histone methylation, gene expression, and Notch signaling. Proc. Natl. Acad. Sci. U.S.A. 2006;103:11970–11974. doi: 10.1073/pnas.0603620103. [DOI] [PMC free article] [PubMed] [Google Scholar]
- 34.Yoo AS, Bais C, Greenwald I. Crosstalk between the EGFR and LIN-12/Notch pathways in C. elegans vulval development. Science. 2004;303:663–666. doi: 10.1126/science.1091639. [DOI] [PubMed] [Google Scholar]
- 35.Stefansson B, Brautigan DL. Protein phosphatase 6 subunit with conserved Sit4-associated protein domain targets IκBε. J. Biol. Chem. 2006;281:22624–22634. doi: 10.1074/jbc.M601772200. [DOI] [PubMed] [Google Scholar]
- 36.Ory S, Zhou M, Conrads TP, Veenstra TD, Morrison DK. Protein phosphatase 2A positively regulates Ras signaling by dephosphorylating KSR1 and Raf-1 on critical 14-3-3 binding sites. Curr. Biol. 2003;13:1356–1364. doi: 10.1016/s0960-9822(03)00535-9. [DOI] [PubMed] [Google Scholar]
- 37.Wan F, Anderson DE, Barnitz RA, Snow A, Bidere N, Zheng L, Hegde V, Lam LT, Staudt LM, Levens D, Deutsch WA, Lenardo MJ. Ribosomal protein S3: A KH domain subunit in NF-κB complexes that mediates selective gene regulation. Cell. 2007;131:927–939. doi: 10.1016/j.cell.2007.10.009. [DOI] [PubMed] [Google Scholar]
- 38.Christofk HR, Vander Heiden MG, Harris MH, Ramanathan A, Gerszten RE, Wei R, Fleming MD, Schreiber SL, Cantley LC. The M2 splice isoform of pyruvate kinase is important for cancer metabolism and tumour growth. Nature. 2008;452:230–233. doi: 10.1038/nature06734. [DOI] [PubMed] [Google Scholar]
- 39.Lin M, Sutherland DR, Horsfall W, Totty N, Yeo E, Nayar R, Wu XF, Schuh AC. Cell surface antigen CD109 is a novel member of the α2 macroglobulin/C3, C4, C5 family of thioester-containing proteins. Blood. 2002;99:1683–1691. doi: 10.1182/blood.v99.5.1683. [DOI] [PubMed] [Google Scholar]
- 40.Sjöblom T, Jones S, Wood LD, Parsons DW, Lin J, Barber TD, Mandelker D, Leary RJ, Ptak J, Silliman N, Szabo S, Buckhaults P, Farrell C, Meeh P, Markowitz SD, Willis J, Dawson D, Willson JK, Gazdar AF, Hartigan J, Wu L, Liu C, Parmigiani G, Park BH, Bachman KE, Papadopoulos N, Vogelstein B, Kinzler KW, Velculescu VE. The consensus coding sequences of human breast and colorectal cancers. Science. 2006;314:268–274. doi: 10.1126/science.1133427. [DOI] [PubMed] [Google Scholar]
- 41.Friedman A, Perrimon N. High-throughput approaches to dissecting MAPK signaling pathways. Methods. 2006;40:262–271. doi: 10.1016/j.ymeth.2006.05.002. [DOI] [PubMed] [Google Scholar]
- 42.Echeverri CJ, Beachy PA, Baum B, Boutros M, Buchholz F, Chanda SK, Downward J, Ellenberg J, Fraser AG, Hacohen N, Hahn WC, Jackson AL, Kiger A, Linsley PS, Lum L, Ma Y, Mathey-Prévôt B, Root DE, Sabatini DM, Taipale J, Perrimon N, Bernards R. Minimizing the risk of reporting false positives in large-scale RNAi screens. Nat. Methods. 2006;3:777–779. doi: 10.1038/nmeth1006-777. [DOI] [PubMed] [Google Scholar]
- 43.Siomi MC, Siomi H. Identification of components of RNAi pathways using the tandem affinity purification method. Methods Mol. Biol. 2005;309:1–9. doi: 10.1385/1-59259-935-4:001. [DOI] [PubMed] [Google Scholar]
- 44.Hu Y, Flockhart I, Vinayagam A, Bergwitz C, Berger B, Perrimon N, Mohr SE. An integrative approach to ortholog prediction for disease-focused and other functional studies. BMC Bioinformatics. 2011;12:357. doi: 10.1186/1471-2105-12-357. [DOI] [PMC free article] [PubMed] [Google Scholar]
- 45.Chien S, Reiter LT, Bier E, Gribskov M. Homophila: Human disease gene cognates in Drosophila. Nucleic Acids Res. 2002;30:149–151. doi: 10.1093/nar/30.1.149. [DOI] [PMC free article] [PubMed] [Google Scholar]
- 46.Celniker SE, Dillon LA, Gerstein MB, Gunsalus KC, Henikoff S, Karpen GH, Kellis M, Lai EC, Lieb JD, MacAlpine DM, Micklem G, Piano F, Snyder M, Stein L, White KP, Waterston RH. modENCODE Consortium, Unlocking the secrets of the genome. Nature. 2009;459:927–930. doi: 10.1038/459927a. [DOI] [PMC free article] [PubMed] [Google Scholar]
- 47.Dennis G, Jr., Sherman BT, Hosack DA, Yang J, Gao W, Lane HC, Lempicki RA. DAVID: Database for Annotation, Visualization, and Integrated Discovery. Genome Biol. 2003;4:P3. [PubMed] [Google Scholar]
- 48.Saeed AI, Sharov V, White J, Li J, Liang W, Bhagabati N, Braisted J, Klapa M, Currier T, Thiagarajan M, Sturn A, Snuffin M, Rezantsev A, Popov D, Ryltsov A, Kostukovich E, Borisovsky I, Liu Z, Vinsavich A, Trush V, Quackenbush J. TM4: A free, open-source system for microarray data management and analysis. Biotechniques. 2003;34:374–378. doi: 10.2144/03342mt01. [DOI] [PubMed] [Google Scholar]
- 49.Saldanha AJ. Java Treeview—Extensible visualization of microarray data. Bioinformatics. 2004;20:3246–3248. doi: 10.1093/bioinformatics/bth349. [DOI] [PubMed] [Google Scholar]
- 50.Eisen MB, Spellman PT, Brown PO, Botstein D. Cluster analysis and display of genome-wide expression patterns. Proc. Natl. Acad. Sci. U.S.A. 1998;95:14863–14868. doi: 10.1073/pnas.95.25.14863. [DOI] [PMC free article] [PubMed] [Google Scholar]
- 51.Stark C, Breitkreutz BJ, Reguly T, Boucher L, Breitkreutz A, Tyers M. BioGRID: A general repository for interaction datasets. Nucleic Acids Res. 2006;34:D535–D539. doi: 10.1093/nar/gkj109. [DOI] [PMC free article] [PubMed] [Google Scholar]
- 52.Aranda B, Achuthan P, Alam-Faruque Y, Armean I, Bridge A, Derow C, Feuermann M, Ghanbarian AT, Kerrien S, Khadake J, Kerssemakers J, Leroy C, Menden M, Michaut M, Montecchi-Palazzi L, Neuhauser SN, Orchard S, Perreau V, Roechert B, van Eijk K, Hermjakob H. The IntAct molecular interaction database in 2010. Nucleic Acids Res. 2010;38:D525–D531. doi: 10.1093/nar/gkp878. [DOI] [PMC free article] [PubMed] [Google Scholar]
- 53.Ceol A, Chatr Aryamontri A, Licata L, Peluso D, Briganti L, Perfetto L, Castagnoli L, Cesareni G. MINT, the molecular interaction database: 2009 update. Nucleic Acids Res. 2010;38:D532–D539. doi: 10.1093/nar/gkp983. [DOI] [PMC free article] [PubMed] [Google Scholar]
- 54.Salwinski L, Miller CS, Smith AJ, Pettit FK, Bowie JU, Eisenberg D. The Database of Interacting Proteins: 2004 update. Nucleic Acids Res. 2004;32:D449–D451. doi: 10.1093/nar/gkh086. [DOI] [PMC free article] [PubMed] [Google Scholar]
- 55.Kerrien S, Orchard S, Montecchi-Palazzi L, Aranda B, Quinn AF, Vinod N, Bader GD, Xenarios I, Wojcik J, Sherman D, Tyers M, Salama JJ, Moore S, Ceol A, Chatr-Aryamontri A, Oesterheld M, Stümpflen V, Salwinski L, Nerothin J, Cerami E, Cusick ME, Vidal M, Gilson M, Armstrong J, Woollard P, Hogue C, Eisenberg D, Cesareni G, Apweiler R, Hermjakob H. Broadening the horizon—Level 2.5 of the HUPO-PSI format for molecular interactions. BMC Biol. 2007;5:44. doi: 10.1186/1741-7007-5-44. [DOI] [PMC free article] [PubMed] [Google Scholar]
- 56.Tweedie S, Ashburner M, Falls K, Leyland P, McQuilton P, Marygold S, Millburn G, Osumi-Sutherland D, Schroeder A, Seal R, Zhang H. FlyBase Consortium, FlyBase: Enhancing Drosophila Gene Ontology annotations. Nucleic Acids Res. 2009;37:D555–D559. doi: 10.1093/nar/gkn788. [DOI] [PMC free article] [PubMed] [Google Scholar]
- 57.Keshava Prasad TS, Goel R, Kandasamy K, Keerthikumar S, Kumar S, Mathivanan S, Telikicherla D, Raju R, Shafreen B, Venugopal A, Balakrishnan L, Marimuthu A, Banerjee S, Somanathan DS, Sebastian A, Rani S, Ray S, Harrys Kishore CJ, Kanth S, Ahmed M, Kashyap MK, Mohmood R, Ramachandra YL, Krishna V, Rahiman BA, Mohan S, Ranganathan P, Ramabadran S, Chaerkady R, Pandey A. Human Protein Reference Database—2009 update. Nucleic Acids Res. 2009;37:D767–D772. doi: 10.1093/nar/gkn892. [DOI] [PMC free article] [PubMed] [Google Scholar]
- 58.Miller ML, Jensen LJ, Diella F, Jørgensen C, Tinti M, Li L, Hsiung M, Parker SA, Bordeaux J, Sicheritz-Ponten T, Olhovsky M, Pasculescu A, Alexander J, Knapp S, Blom N, Bork P, Li S, Cesareni G, Pawson T, Turk BE, Yaffe MB, Brunak S, Linding R. Linear motif atlas for phosphorylation-dependent signaling. Sci. Signal. 2008;1:ra2. doi: 10.1126/scisignal.1159433. [DOI] [PMC free article] [PubMed] [Google Scholar]
- 59.Tan CS, Bodenmiller B, Pasculescu A, Jovanovic M, Hengartner MO, Jørgensen C, Bader GD, Aebersold R, Pawson T, Linding R. Comparative analysis reveals conserved protein phosphorylation networks implicated in multiple diseases. Sci. Signal. 2009;2:ra39. doi: 10.1126/scisignal.2000316. [DOI] [PubMed] [Google Scholar]
- 60.Yellaboina S, Tasneem A, Zaykin DV, Raghavachari B, Jothi R. DOMINE: A comprehensive collection of known and predicted domain-domain interactions. Nucleic Acids Res. 2011;39:D730–D735. doi: 10.1093/nar/gkq1229. [DOI] [PMC free article] [PubMed] [Google Scholar]
- 61.Lee YS, Carthew RW. Making a better RNAi vector for Drosophila: Use of intron spacers. Methods. 2003;30:322–329. doi: 10.1016/s1046-2023(03)00051-3. [DOI] [PubMed] [Google Scholar]
Associated Data
This section collects any data citations, data availability statements, or supplementary materials included in this article.