Abstract
This chapter reviews basic concepts of nonlinear fluorescence upconversion, a technique whose temporal resolution is essentially limited only by the pulse width of the ultrafast laser. Design aspects for upconversion spectrophotofluorometers are discussed, and a recently developed system is described. We discuss applications in biophysics, particularly the measurement of time-resolved fluorescence spectra of proteins (with subpicosecond time resolution). Application of this technique to biophysical problems such as dynamics of tryptophan, peptides, proteins, and nucleic acids is reviewed.
1. Introduction
Fluorescence spectroscopy is one of the most widely used techniques for studying the structure and function of macromolecules in biology/chemistry, especially protein interactions. For example, fluorescence (esp. lifetime) measurement reveals ligand-induced conformational changes in proteins, as fluorescence is often sensitive to subtle environmental changes of chromophores such as tryptophan and tyrosine (Gregoire et al., 2007). Sensitivity to protonation or deprotonation reactions (Espagne et al., 2006; Zelent et al., 2006), solvent relaxation (Dashnau et al., 2005; Toptygin et al., 2006), local conformational changes (May and Beechem, 1993; Pan et al., 2006), and (via anisotropy decay) processes coupled to translational or rotational motion (Schroder et al., 2005) is available. Most fluorescence decay changes occur in the time window of a few picoseconds to nanoseconds; measurements thus employ very short light pulses. Fortunately, in recent years, a range of advanced ultrafast lasers (esp. the Ti:sapphire laser) and associated optoelectronic instruments have emerged into the general scientific and commercial marketplace. This enables spectroscopic studies of biological and chemical systems on a subpicosecond timescale. We recently reported the development of an instrument with a 150 fs full-width half-maximum response function that uses fluorescence upconversion to obtain the lifetimes of biological molecules with ultraviolet excitation (Shen and Knutson, 2001a).
Many different techniques have been proposed to obtain ultrafast time resolution in fluorescence spectroscopy. A number of relevant reviews have appeared. Recently, Andrews and Demidov (2002) have edited a multiauthor volume on laser spectroscopy, and a comprehensive discussion of techniques has been given by Fleming (1986). Before that, Topp (1979) provided a comprehensive review of pulsed laser spectroscopy, Ippen and Shank (1978) gave a general review on techniques in subpicosecond spectroscopy, and techniques and applications of fast spectroscopy in biological samples have been reviewed by Holten and Windsor (1978). Given the availability of these broader reviews, we will focus only upon certain recent developments (Fiebig et al., 1999; Kennis et al., 2001a; Rubtsov and Yoshihara, 1999; Schanz et al., 2001).
The most direct method to study fluorescent transients is to use a fast photomultiplier (PMT) or photodetector in conjunction with fast electronics. The operating principles, design, and performance of PMTs have been reviewed by Zwicker (1981). The best time resolution that can currently be obtained by direct PMT readout is about 40 ps. Although photodetectors (e.g., PIN diodes) can be made with much faster response time (<5 ps), their low sensitivity and small active area (needed to keep RC low) restrict their use to detection of strong signals, such as direct signals from lasers.
Two photocathode-based techniques that are usually used for the detection of weaker time-resolved fluorescence are time-correlated single photon counting (TCSPC) and streak cameras. TCSPC is a relatively easy means to measure fluorescence decay times and has been well described by O’Conner and Phillips (1984), Birch and Imhof (1991), and Becker (2005). Using TCSPC together with a fast PMT, it is possible to improve the exponential time resolution to around 10 ps (Murao et al., 1982), but very careful deconvolution is needed to get such good time resolution. At the shortest extreme, Holzwarth and his group used their TCSPC system to detect lifetimes on the order of 1–2 ps (with Ti:sapphire laser) (Muller et al., 1996). The preferred direct technique for obtaining time resolution better than 10 ps, however, has been a streak camera. The design and application of streak cameras as detectors in the picosecond time domain have been reported and discussed by Bradley et al. (1980, 1983), Barbara et al. (1980), Ihalainen et al. (2005), and Van Stokkum et al. (2006). “Single shot” streak cameras can offer time resolution better than 1 ps in certain cases, and a synchroscan streak camera has become available recently with time resolution under a picosecond with wide spectral response (200–1600 nm) (e.g., Hamamatsu, C6860, C6138) (Van Stokkum et al., 2006). Streak cameras are, however, both expensive and labile; system maintenance for day to day reproducibility in the subpicosecond regime has been said to be taxing.
The best hope to achieve even better fluorescence time resolution, comparable to laser pulse width (~100 fs), depend on nonlinear optical sampling. The use of an optical Kerr (OK) shutter was proposed by Duguay and Hansen (1968). The OK shutter makes use of the transient birefringence induced in a nonlinear medium by an intense laser pulse to create an ultrafast shutter (like a Pockels cell driven by light instead of high voltage). Several different liquid media have been used as the nonlinear shutter materials. The time resolution is determined by the recovery time of the medium. Most of the work has been done using CS2 as the optical gate, and the time resolution can reach less than 0.5 ps by using benzene (Arzhantsev and Maroncelli, 2005), or even glass as the nonlinear shutter (Yu et al., 2003). We note, however, recent reports using fused silica as a gate to get an instrument response function of ~200 fs (Gu and Shi, 2005). Unfortunately, the shutter contrast was small due to a birefringence relaxation component with rather long recovery time, and spectral-temporal correction needs to be done very carefully. Low sensitivity and (usually) restriction to a visible range (400–675 nm) has restricted the range of Kerr shutter applications in biophysics.
Another nonlinear technique, first used by Mahr and Hirch (1975), involves frequency mixing. In this technique, the fluorescence excited by an ultrafast laser pulse is mixed with another (delayed) portion of the laser pulse in a nonlinear optical crystal such as KDP or BBO to generate sum or difference frequency radiation. Since this mixing process takes place only during the presence of the second laser pulse, it provides time resolution comparable to the pulse width; delaying the gate pulses with a mechanical stage leads to an “optical boxcar approach.” Fluorescence upconversion (also called sum frequency generation) was experimentally first reported in biochemical research by Halliday and Topp (1977). In their system, the fundamental 1.06 μm pulse of 7 ps from a branched mode-locked Nd3+ glass laser was used as the probe beam and the upconversion was accomplished in a KDP crystal with type II phase matching. The sampling gate width was about 10 ps. By changing the angle (a span of 15°) of the incident 1.06 um and fluorescence beams with respect to the optical axis in the crystal, the phase-matching conditions were changed to select a different fluorescence wavelength (250–1100 nm) for upconversion (Halliday and Topp, 1978). Kahlow et al. (1988) provided a thorough discussion about upconversion. Because of the higher intrinsic signal-to-background ratio over the Kerr-cell method and the availability of excellent PMT detectors in the deep UV regions, it is an extremely attractive technique for time-resolved fluorescence spectroscopy in biology. This technique has been exploited by other researchers in biophysics (Changenet et al., 1998; Kennis et al., 2001b; Xu et al., 2006).
This review is organized as follows. Basic concepts of upconversion are reviewed in Section 2. In Section 3, we discuss our recently developed system (which provides <400 fs FWHM gating, excellent sensitivity, and a large dynamic and wide spectral range). Section 4 discusses some recent experiments on subpicosecond time-resolved fluorescence spectroscopy in tryptophan and proteins using this technique. Section 5 presents a summary and some thoughts on future directions.
Note also that we do not review the frequent application of upconversion to problems in photosynthesis (Kennis et al., 2001b). This would be redundant, as many reviews have covered that topic extensively.
2. Basic Concepts
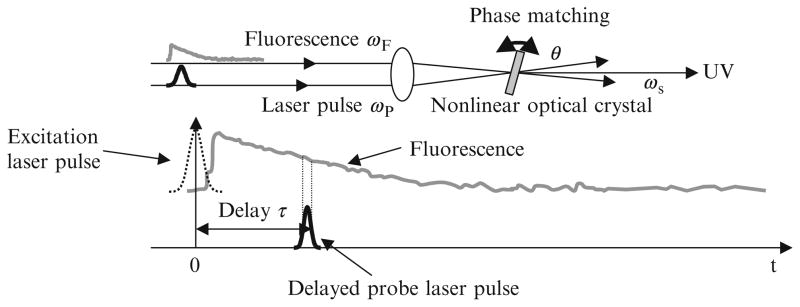
The time resolution mechanism underlying the upconversion technique is illustrated in Fig. 8.1. Upconversion is actually a cross-correlation between the fluorescence and the probe laser pulse. At time t = 0, the sample is electronically excited by, for example, the second or third harmonic of an ultrafast laser pulse with frequency ωp. The collected incoherent fluorescence (ωF) and the probe laser pulse (ωp) arriving at time t = τ are cofocused into a nonlinear optical crystal, such as KDP, BBO, etc., which is oriented at an appropriate angle with respect to the fluorescence and laser beams. Sum frequency photons are generated only during the time that the probe laser pulse is present in the crystal, acting as a “light gate,” and thus time resolution is within the laser pulse width. The time evolution of fluorescence may then be traced by varying the delay τ of the probe laser beam. An analysis of sum frequency generation shows the intensity of the sum frequency signal at a given delay time ω is proportional to the correlation function of the fluorescence intensity with the probe laser intensity (Shen, 1984).
Figure 8.1.
Schematic diagram of upconversion.
The basic concepts of sum frequency generation are well known and have been fully discussed (Shen, 1984; Zernike and Midwinter, 1973). We only briefly summarize previously published basic equations and discuss some of the main features for upconversion in this section.
2.1. Phase-matching angle
The sum frequency generation process is efficient only if conditions for phase matching are satisfied; this happens only for a narrow band of wavelengths centered at a wavelength determined by the phase-matching angle θm. For simplicity, we consider the case of collinear phase matching, and the appropriate equations are (Shen, 1984)
| (8.1) |
| (8.2) |
where ω (or v), h, k⃗, and n are the photon frequency, Planck’s constant, wave vector, and refractive index, respectively. The subscripts F, p, and s denote the fluorescence beam, probe laser beam, and sum frequency generation, respectively. Assuming θ is the angle between z-direction and k⃗; no and ne are the ordinary (O) and extraordinary (E) indices, respectively. For an uniaxial crystal where the optic axis is along the z-direction, the index n(θ) satisfies
| (8.3) |
The crystal index no and ne varies with wavelength and can be obtained from Sellmeier’s equations in the literature (Eimerl, 1987; Ghosh, 1995; Liu and Nagashima, 1999). In this chapter, we concentrate on the type “I” phase-matching condition (O + O → E), so the angle is given by
| (8.4) |
where ns (θm) is
| (8.5) |
For example, β-barium borate (BBO) crystal is well suited for upconversion, its phase-matching angle is about 45° for Trp fluorescence (350 nm) with the probe pulses at 885 nm. One can easily buy a commercial type I BBO crystal with ~45° cut at different thickness.
2.2. Spectral bandwidth
If the phase-matching condition is not precisely satisfied, that is, different fluorescence wavelengths λF make Δk ≠ 0, then the quantum efficiency falls off with increasing Δk as
| (8.6) |
The spectral bandwidth is estimated by the place when the quantum efficiency drops to 50% of η (0) (Shen, 1984).
For the case discussed above,
| (8.7) |
where
| (8.8) |
Equation (8.7) describes the interplay of crystal thickness and fluorescence spectral bandwidth. If we concentrate on Trp fluorescence (peak emission wavelength 350 nm) using 885 nm probe pulses, then the spectral bandwidth for 0.2 mm BBO crystal is about 0.4 nm (instead of 0.08 nm for a 1 mm crystal). Upconversion is, therefore, an intrinsically high-resolution spectroscopy.
2.3. Acceptance angle
The angle of acceptance of fluorescence is another important factor in upconversion experiments. Since fluorescence is emitted in all directions from the excited spot in the sample, the collected fluorescence is refocused into the crystal in a broad cone. The larger the input angle that can be phase matched by the crystal, the larger the upconversion efficiency. The acceptance angle is defined (generously) as the angle where the phase mismatch is less than 90° (Zernike and Midwinter, 1973):
| (8.9) |
Normally the acceptance angle in the plane containing the optic axis is smaller than the perpendicular plane (for collinear phase matching). For noncollinear geometry, the acceptance angle is (Zernike and Midwinter, 1973)
| (8.10) |
Equations (8.9) and (8.10) show that the acceptance angle increases inversely with the crystal length L, that is, thinner crystals generally have a larger angle of acceptance. Thus as the crystal is thinned, the focus can be tightened because the acceptance angle is larger, so the total upconversion signal intensity should remain relatively constant. From Eq. (8.10), one can estimate an acceptance angle of ~1.7° for Trp fluorescence studies in a 2 mm BBO crystal. This quite narrow cone angle is incompatible (for Gaussian beams) with the small spot size needed to create sufficient mixing. Thus, incoming cone angle is usually much larger than acceptance angle, and only a small fraction of available fluorescence is converted.
2.4. Quantum efficiency for upconversion
The quantum efficiency for phase matched sum frequency generation can be estimated under appropriate boundary conditions. For the “small signal” condition (no depletion-only a few percent of the power of the probe laser beam is transferred to sum frequency generation), quantum efficiency may be expressed (Shen, 1984; Zernike and Midwinter, 1973):
| (8.11) |
where Pp and A are the peak power and focus area of the probe laser beam (assuming the area of the fluorescence beam is not bigger than this area), respectively; deff is the effective nonlinear coefficient of the crystal; c is the light velocity; and ε0 is the free-space permittivity. Note that quantum efficiency is proportional to probe pulse peak power and square of crystal thickness, but is reduced if the focal spot becomes bigger. For example, if the average power of 300 fs probe pluses is 1 W at 885 nm and 5 KHz repetition rate, and the focus spot is about 0.1 mm in diameter, for Trp fluorescence, the quantum efficiency should be about 0.1% in a 1 mm BBO crystal.
2.5. Group velocity mismatch
In linear optics, the group velocity νg = (|∂k/∂ω|)−1 does not lead to pulse broadening. However, in nonlinear processes such as sum frequency generation (here acting as fluorescence upconversion), the mismatch between the group velocity of probe and fluorescence pulses may lead to a temporal broadening of the generated sum frequency pulse. In most cases, this restriction is more severe than the one imposed by phase mismatching. For O + O → E, the broadening introduced by the mismatched group velocity is given by (Shen, 1984)
| (8.12) |
And γp is obtained by
| (8.13) |
In upconversion experiments, this group velocity mismatch between the two input beams results in a time broadening in the sum frequency generation, which means that the probe laser beam sweeps out an area of the fluorescence with a sampling time period wider than the pulse width itself. Unlike group velocity dispersion, this broadening effect cannot be corrected by any techniques, it can only be minimized by a proper choice of elements. Group velocity dispersion usually is only considered for the subpicosecond laser pulses, however, this effect can be pre-compensated by either grating pair, prism pair or both (Fork et al., 1987; Inchauspe and Martinez, 1997; Kafka and Baer, 1987). In our case, we can adjust the final grating compressor in the amplifier to partially compensate the dispersion of the probe pulses.
In addition to the characteristics discussed above, “walk-off” angle must be considered in some cases. For an extraordinary beam, the direction of energy flow is different from the wave direction. Walk-off angle is that between wave and energy vectors. In some cases, this walk-off will lead to a reduced overlap of the probe and fluorescence beams (reduce the upconversion efficiency in thick crystals). Fortunately it has little effect on the overlap for the O + O → E case in a thin crystal.
2.6. Polarization
The upconversion process is intrinsically a polarization selection process, only O + O → E (not E + O → E) occurs in a practical upconversion system, and the collection of different polarized emission components is usually accomplished by rotating the excitation polarization with a thin half-wave plate. This is much simpler than rotating both the entire crystal mount and the probe polarization.
2.7. Sample handling
It is critical to maintain linear spectroscopy conditions even in this higher flux experiment; thus the sample must be concentrated enough to provide a large population in the focal volume (i.e., under 1% of ground-state population should be excited, to avoid excitonic effects and saturation). Further, any photophysical events that might persist between pulses (~200 μs), such as triplet generation, obligate the removal of exposed sample from the excitation spot. Hence, either free standing jets (to avoid flow cell “wall effects”) or rapidly spinning sample holders are needed. We constructed a disk to mount inexpensive thin cuvettes on a spinning mount, achieving m/s displacement rates on an easily demounted and cleaned carrier (containing an internal Raman standard).
2.8. Crystal choice
Different nonlinear optical crystals have different “phase-matchable” wavelength ranges, quantum efficiency, acceptance apertures, etc. There are several common crystals used in sum frequency generation, potassium dihydrogen phosphate (KDP) (Eimerl, 1987), lithium niobate (LiNbO3) (Schlarb et al., 1995), lithium triborate (Liu and Nagashima, 1999), and β-barium borate (BBO) (Ghosh, 1995). Although the conversion efficiency of BBO is less than LiNbO3, it has a much wider phase-matching wavelength range for mixing with 800 nm: from 250 to 2000 nm. It also has higher damage thresholds and lower group velocity mismatch. A BBO crystal of 1/3 the length of a similar KDP crystal has higher efficiency with roughly the same acceptance angle and group velocity mismatch. Therefore, among currently available crystals, we have chosen BBO for UV upconversion experiments for subpicosecond pulses.
3. Upconversion Spectrophotofluorometer and Experimental Considerations
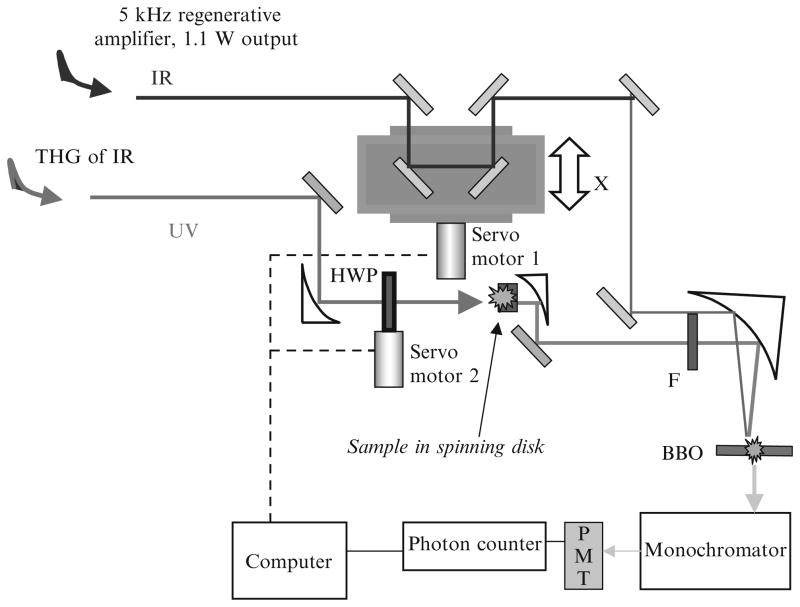
Upconversion is a derivative of the pump probe technique, and we developed one layout especially for studying tryptophan photophysics in proteins, which is shown in Fig. 8.2. A mode-locked Ti:sapphire laser (Tsunami, Spectra Physics) was pumped by an argon ion laser with the power of 6 W (Beamlock 2060, Spectra Physics), which generated a ~400 mW pulse train with a typical pulse duration of 120 fs at a repetition rate of 82 MHz. It was then sent to seed a Ti:sapphire regenerative amplifier (Spitfire, Spectra Physics). The output amplified pulses at 885 nm typically had a pulse energy of ~0.2 mJ and an autocorrelation pulse width of 350 fs at a repetition rate of 5 kHz. The amplifier could be tuned only between 865 and 905 nm because of the restriction caused by cavity mirrors chosen to quench self-Q switching below 860 nm and the gain pulling above 900 nm. Ultraviolet excitation pulses with an average power up to 30 mW (e.g., 295 nm) was obtained from nonlinear harmonic generation using a 1 mm BBO crystal and 0.5 mm BBO crystal for doubling and tripling, respectively. This UV beam was separated from the infrared beam (fundamental), and visible beam (doubled) by two dichroic mirrors, and spatially filtered using a pin hole, the power was carefully attenuated before excitation of the sample to avoid photodegradation, hole burning, and other undesirable effects. A zero-order half-wavelength plate (HWP) was used to change the polarization of the UV beam. A circular array of thin cells (T-20, NSG Precision Cells) with a path length of 1 mm in a delrin stacked slotted disk was used to hold samples. The disk was spun continuously (several m/s) to make each UV pulse excite a different sample spot. The infrared fundamental pulse was reflected from a broadband hollow retroreflector on a computer-controlled precision stage, and used as a gate pulse for the upconversion process. The fluorescence emission was collected by parabolic mirrors, passed through a long pass filter (F), and focused into a 0.2 mm thick BBO mixing crystal. The upconversion signal was produced via type I sum frequency generation with the gate pulse in the crystal. Here the combination of a very thin BBO crystal and no lens is selected for reducing the limitations of time resolution imposed by group velocity mismatch and dispersion. The time evolution of fluorescence at any given wavelength can be obtained by setting the BBO crystal angle, monochromator wavelength (at ωF + ωp), and scanning delay stage.
Figure 8.2.
A schematic of upconversion spectrophotofluorometer.
To reject the strong background signals (infrared laser and its second harmonic generation, remnant UV, and unconverted fluorescence) accompanying the upconverted signal, a noncollinear configuration was arranged between infrared probe laser and fluorescence. The use of a monochromator helps in reducing these unwanted signals at the PMT, also improving the spectral bandwidth. A double monochromator may be necessary if this problem is severe. Polarizations of gated fluorescence were determined by the orientation of nonlinear crystals, so no extra linear polarizer was needed (for anisotropy calculation, G ~ 1). By angle tuning the mixing crystal, the upconverted fluorescence signal, with a wavelength in the range 230–280 nm, always polarized in the same direction, was directed into a monochromator (Triax 320, Jobin Yvon, Inc. with a bandwidth of 0.5 nm) and a solar blind photomultiplier tube (R2078, Hamamatsu, dark rate < 1 cps). Amplified SBPMT signals were discriminated and then recorded by a gated single photon counter (994, EG&G Ortec). Photon arrival events were held to less than 5% of the repetition rate to minimize “pileup.” One should mention that there are two main sources of noise for the detection. If the signal is sufficiently greater than the PMT dark current, the power fluctuations of the infrared laser beam may be the primary noise source. If the signal is very low, the shot noise from the dark current of the PMT will be the limiting factor, and in this case, cooling the PMT is advisable.
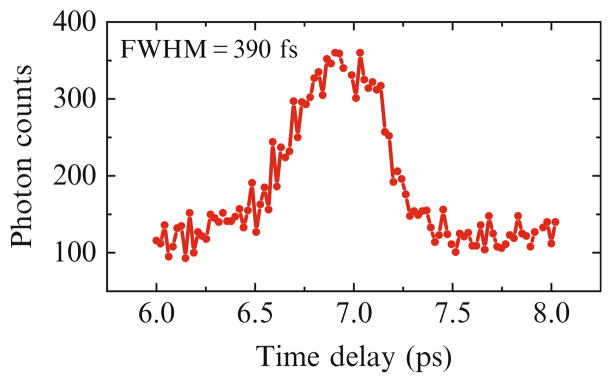
A precise determination of the bandwidth and zero time delay is essential in all ultrafast experiments. The best way of determining the zero in upconversion system is to get a cross-correlation trace between the scattered laser light from the sample and a delayed laser beam in the crystal. Such a trace provides not only an accurate zero but also an accurate measurement of the system response time. In our system, the “lamp” (AKA “apparatus” or “instrument response”) function was determined by measuring the cross-correlation either between the UV and infrared pulses or UV-generated spontaneous Raman scattering in water and the infrared. In both ways, the lamp function was found to be around 400 fs (FWHM), with a timing jitter of less than 30 fs. The use of unamplified pulses can reduce this FWHM to < 150 fs, but at much lower sensitivity (Fig. 8.3).
Figure 8.3.
A typical response time profile of upconversion spectrophotofluorometer.
When collecting on longer timescales, we often found “detuning” to ~1 ps FWHM optimized other geometric parameters. Instrument calibration was verified with indoles and, for example, linear fluorophores like p-terphenyl, which yielded r0 = 0.40 ± 0.01 and a single rotational correlation time ϕ of 41 ps in cyclohexane.
4. Ultrafast Photophysics of Single Tryptophan, Peptides, Proteins, and Nucleic Acids
While the conjugation of small molecules such as environment-sensitive fluorescent probes to protein has been a remarkably useful strategy for studying biological structure and function, nagging concerns about probes causing perturbation have always provided impetus for the study of naturally occurring reporters. Much attention has been paid to the time-resolved fluorescence decay of tryptophan (Beechem and Brand, 1985), the most important protein fluorophore, as it can be used to study physical and dynamic properties (not only the local environment of the indole ring but also global changes of the tertiary structure of proteins). This amino acid (in aqueous solution) has been long known to be at least biexponential on the 100 ps-100 ns timescale and the principle components (usually about 0.6 and 3.1 ns) have different decay-associated spectra (DAS) (Beechem and Brand, 1985; Lakowicz, 1999). Many peptides and proteins containing single Trp residues have wavelength-dependent multiexponential decays, and each exponential term has a different DAS (Chowdhury et al., 2003; Fukunaga et al., 2007; Li et al., 2007; Qiu et al., 2006; Zhang et al., 2006).
Generally two distinct explanations have been given to explain the various “lifetimes” (exponential decay terms): one is the excited population loss, that is, “population decay”; another one is the equilibration of the new excited state with surroundings, resulting in spectral shifts without change in overall excited-state population, which is termed solvent relaxation (although “solvent” may also include protein contributions). “Ground-state heterogeneity” is the most basic explanation for multiple population decay rates; it suggests the presence of several conformers, each with indole experiencing distinct environments and yielding different fluorescence lifetimes (Mcmahon et al., 1997; Ross et al., 1992; Szabo and Rayner, 1980). Decay amplitude correspondence with NMR-derived rotamer population data has supported such a view (Clayton and Sawyer, 1999; Mcmahon et al., 1997). In addition to different true rotamers of the Trp side chain, micro-conformational states of proteins, with different local environments for the indole ring, could confer ground-state heterogeneity. Relaxation of the protein matrix (not just solvent water) would also produce a complex decay (Lampa-Pastirk et al., 2004; Toptygin et al., 2006).
Generalized solvent relaxation yields short-lived blue and long-lived red DAS on the nanosecond timescale (Alcala et al., 1987; Toptygin et al., 2001; Vincent et al., 1995). Relaxation as a cause for the observed multiexponentiality is suggested by the fact that mean decay times usually increase with increasing observation wavelength and that DAS are generally strictly ordered: longer decay times usually (but not always!) go with longer wavelength components (Lakowicz, 2000).
If one carefully surveys the decay surface during the process of solvent relaxation, a continuous change in the decay shapes—from rapid decay at the short wavelength of the spectrum, to rising behavior at the longer part of the spectrum—should be observed. This is usually manifested as a negative amplitude associated with a short lifetime (“short negative DAS”) on the red side of the surface, diagnostic of excited-state reaction (Grinvald and Steinberg, 1974).
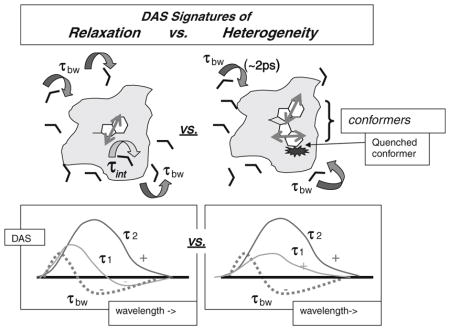
DAS are pre-exponential terms fitting I(λ, t) = ΣDASi(λ) exp(−t/τi).
Homogeneous relaxation leads to negative DAS not only for ~2 ps water relaxation, but also for other short lifetimes. Heterogeneous quenching, however, yields positive DAS for all lifetimes longer than the water relaxation.
Time-resolved emission spectra (TRES) rising with time on red side correspond to the negative portion of the short-lived DAS terms. Positive DAS (TRES decline after 5 ps even in long wavelength regions) reveal the dominance of heterogeneity.

Computer simulations can also guide the modeling process. It was shown that 3-methyindole in water had bimodal character (Muino and Callis, 1994; Jimenez et al., 1994), an ultrafast Gaussian relaxation of ~15 fs (from trajectrory changes “between water collisions”) was followed by an exponential response of ~400 fs due to quasi diffusive motion.
Before the 21th century, all but a handful of Trp photophysical studies had been made with 100 + picosecond and nanosecond time resolutions. Recently, however, several groups have developed upconversion instruments to broach the subpicosecond events, and all have found ~1.2 ps bulk water diffusive relaxation (Lu et al., 2004; Shen and Knutson, 2001b).
In this section, first we will revisit the picosecond solvent relaxation, complete within 5 ps, that occurs for tryptophan in water. Second, we discuss how a previously suggested quasistatic self-quenching mechanism (QSSQ; Chen et al., 1991; sub-100 ps decay terms that reduce yield and can be mistaken for scattered light or obscured by deconvolution noise) has been confirmed by upconversion fluorescence measurements. We review ps spectral and lifetime data for Trp residues in proteins (e.g., monellin and IIAGlc), and finally we examine published fluorescence upconversion experiments on nucleic acids.
4.1. Solvent relaxation of tryptophan in water
Trp has an extraordinarily large Stokes’ shift in physiological buffers. At times, a portion of the shift can be seen in nanosecond generalized relaxation, but most of the shift is completed before the fastest PMT can detect it. In early studies, Ruggiero et al. (1990) noted ps transients and related anisotropy decay that was, at that time, attributed to level crossing. Shen and Knutson (2001b) have measured “magic angle” (rotation invariant) TRES for Trp in water, from 400 fs to 20 ps. Figure 8.4 shows fluorescence curves of Trp in water collected at several emission wavelengths (Shen and Knutson, 2001b). The fluorescence surface clearly contains a fast decay at short emission wavelengths and a fast rise at longer emission wavelengths. Further, this behavior was nearly independent of excitation wavelength, which is indicative of excited-state reaction. Both the fast decay and fast rise gave essentially the same time constant, around 1.0–1.6 ps, with an average value near 1.2 ps that matched the global analysis value gleaned from all curves. Importantly, the picosecond transient had amplitude with opposite signs at blue and red sides of the spectrum. The 1.2 ps spectral dynamics were demonstrably not from the dynamics of internal conversion (sub-100 fs events yielding anisotropy changes) (Shen and Knutson, 2001a) and the most direct explanation is solvent relaxation.
Figure 8.4.
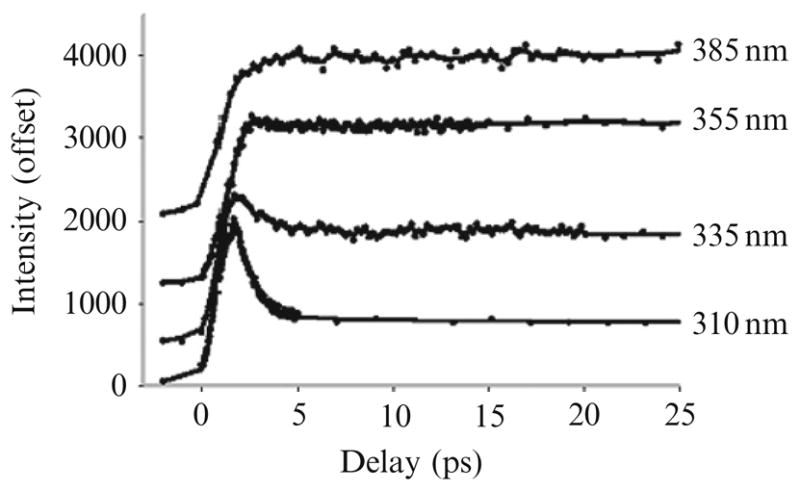
Trp emission at very early times in water. Reproduced with permission from J. Phys. Chem. B. 105 (2001) 6260. Copyright © 2007 American Chemical Society.
4.2. QSSQ of Trp in dipeptides
In the late 1980s, Chen et al. (1991) found that dipeptides had “yield defects” (lower quantum yield than expected from mean lifetimes) and postulated short “QSSQ” lifetimes. Recently, time-resolved fluorescence decay profiles of N-acetyl-L-tryptophan-namide (NATA) and tryptophan dipeptides of the form Trp-X and X-Trp, where X is another aminoacyl residue, have been investigated using our ultraviolet upconversion spectrophotofluorometer with time resolution better than 150 fs, together with a TCSPC apparatus on the 100 ps-20 ns timescale (Xu and Knutson, 2008). The set of fluorescence decay profiles has been analyzed using the global analysis technique. Nanosecond (conventional TCSPC) experiments all show the multiexponential decay of Trp dipeptides, while NATA shows monoexponential decay of 3 ns, independent of pH value. For example, the results of Leu-Trp at pH 5.2 can be fitted using three lifetimes 0.33, 1.57, and 3.68 ns. The mean lifetime 〈τ〉 (Chen et al., 1991) is around 1.18 ns. The results of Leu-Trp at pH 9.3 can be fitted using two lifetimes: 1.53 and 4.09 ns. The mean lifetime 〈τ〉 is around 3.54 ns. All upconversion transients for Leu-Trp clearly exhibited a fast decay at shorter emission wavelengths and a fast rise at longer emission wavelengths (importantly, these rise terms are seen only in the initial 5 ps). NATA and Leu-Trp in water only displayed the fast water relaxation ~1.2 ps term and a slow component of 3 ns (and 1.2 ns for Leu-Trp). Surprisingly, another fast component was found in the corresponding Trp-X dipeptide, which is shown in Fig. 8.5. Clearly, the ultrafast data of Trp-Leu cannot be fitted satisfactorily without the use of the third fast component, while this is not necessary for NATA or Leu-Trp in water. Further, this third decay component (~30 ps) has positive amplitude even at redder wavelengths (data not shown). Solvent relaxation thus cannot be the sole source, because a homogeneous shift should result in a positive/negative DAS (or a very distorted and blue-shifted DAS). Internal conversion between 1La and 1Lb is also a poor suspect for this term, as internal conversion is faster than 50 fs (Shen and Knutson, 2001a). Therefore, this lifetime must originate from a quenched subpopulation (likely rotameric) of Trp. It verifies the previous logic behind QSSQ—the loss of quantum yield (but not mean lifetime detected by ns instrumentation) to a sub-100 ps decay process.
Figure 8.5.
Representative fluorescence intensity decay for dipeptides in water (Trp-Leu) within 100 ps.
4.3. Ultrafast fluorescence dynamics of proteins
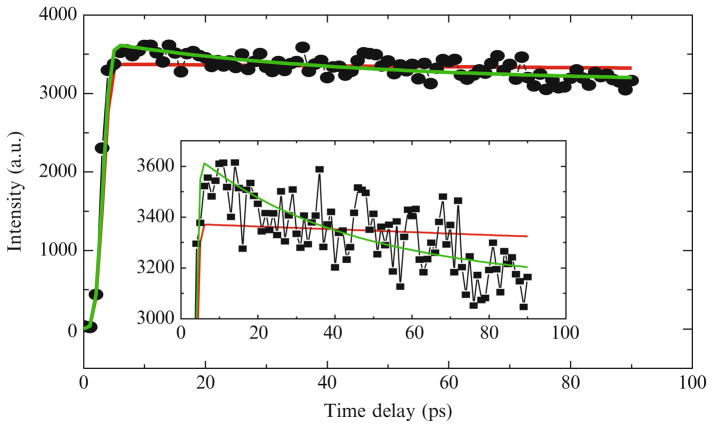
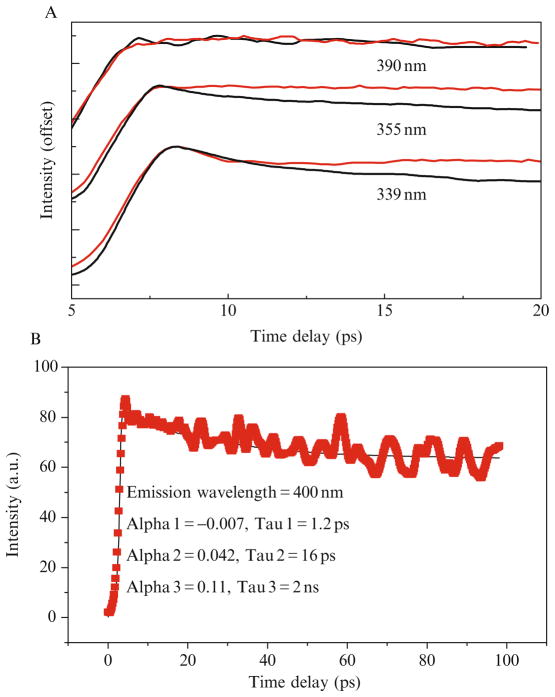
In upconversion experiments of Trp alone, the femtosecond curves showed a fast decay at “short” emission wavelengths and a fast rise at “longer” emission wavelengths—but only during the initial 5 ps. Trp in water displayed only this fast water relaxation (~1.2 ps) and a very slow (ns) component. Trp in the “sweet protein” monellin, however, cannot be fit without another ultrafast component. Figure 8.6A gives subpicosecond resolution fluorescence decays (20 ps full range) at three representative wavelengths for the protein monellin solution (black lines) and Trp solution (red lines) (Xu et al., 2006). The data in this figure were offset and peak normalized for easy comparison. Obviously, the protein monellin displays a decay process different from Trp alone, except that it is difficult to distinguish between Trp and monellin at 390 nm. In Fig. 8.6B, the temporal window was increased to 100 ps. The 16 ps term is thus more visible in Fig. 8.6B and the fit including a positive 16 ps exponential is also shown. The “bulk” water relaxation term (~1.2 ps) has both positive and negative regions (blue squares) below and above 365 nm, respectively. The unique (~16 ps) component (green squares) has a significant positive amplitude even above 390 nm (Fig. 8.7), and the spectral shape is not significantly narrowed (Xu et al., 2006). Normal solvent relaxation on the 16 ps timescale should have resulted in a positive/negative DAS, or at least a narrowed and blue-shifted DAS without a significant positive amplitude near 400 nm. Note again, we do not include model terms for internal conversion between 1Lb and 1La since that is faster than 50 fs.
Figure 8.6.
(A) Representative upconverted fluorescence intensity decay for Trp in water (red lines) and in monellin (black lines) at wavelengths 339, 355, and 390 nm using excitation at 295 nm. Reproduced with permission of J. Am. Chem. Soc. 128 (2006) 1214. Copyright © 2007 American Chemical Society.
Figure 8.7.
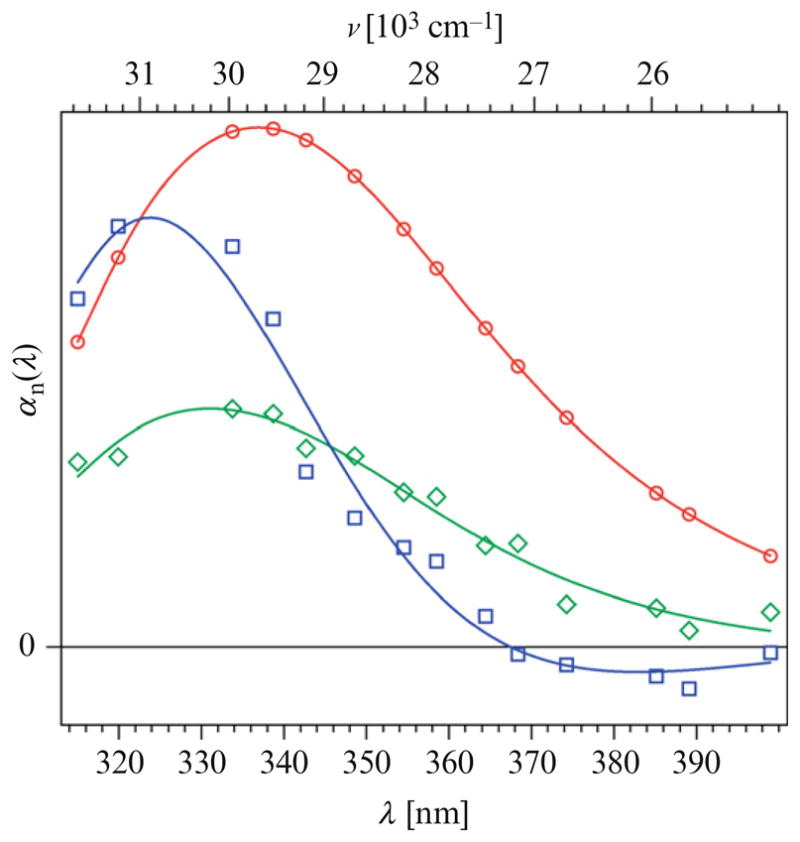
Rawdecay-associated spectra of Trp in monellin extracted from upconversion data (circles) superposed with their polynomial fits (lines) (1.2 ps, blue;16 ps, green; and 2 ns, red). Reproduced with permission of J. Am. Chem. Soc. 128 (2006) 1214. Copyright © 2007 American Chemical Society.
Single transients of the E21W version of the IIAGlc protein also yielded the characteristic blue positive/red negative 1.2 ps exponential previously seen for Trp solvation in bulk water. Neither wavelength region exhibited terms slower than 2 ps, however, except for previously measured terms well over 50 ps (e.g., in the TCSPC work of Toptygin and Brand) (Toptygin et al., 2001). The exposed location of Trp in the mutant E21W might lead us to think of it as neat Trp. Although the fs response of this protein looks like Trp in water, steady state iodide quenching of IIAGlc-E21W yielded a Stern-Volmer constant only ~2× that of monellin (and much less than free Trp). Thus, the “rules” for whether subpopulations will experience rapid quenching by, for example, electron transfer, appear to be specific to local constraints. QM-MM calculations (Kurz et al., 2005), while not directly predictive of lifetimes in every case, provide theoretical correlates that appear to rationalize these new ~20 ps terms. Of the handful of proteins we have examined on this timescale, only GB1 shows evidence of homogeneous relaxation.
Meanwhile, it should be noticed that some research groups, for example, Abbyad et al., (2007) and Cohen et al. (2002) have characterized the solvation kinetics of proteins using synthetic fluorescence amino acids like Aladan. Unfortunately, only TRES (not DAS) are presented, so we cannot judge the role of heterogeneity/fast quenching versus solvation there.
4.4. Ultrafast dynamics in DNA
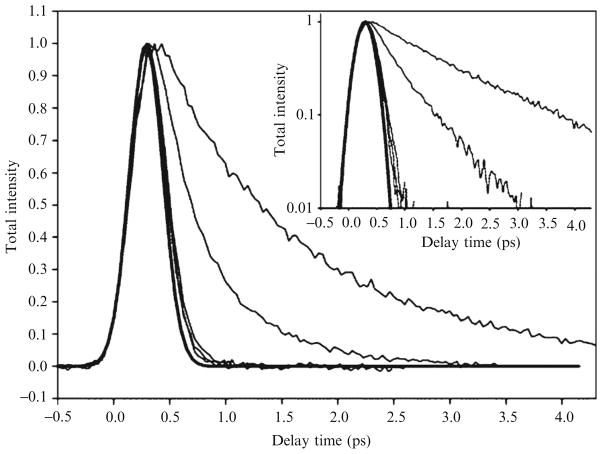
Nucleic acids are well known to have ultrafast internal conversion after photoexcitation in the UV-visible region. In particular, fluorescence upconversion experiments on monomeric DNA constituents have shown that the fluorescence decays are extremely fast (<1 ps) and cannot be described by a single exponential, indicating complex nonradiative processes occurring in the excited state(s) (Andreatte et al., 2006; Gustavsson et al., 2006a,b; Schwalb and Temps, 2007). For DNA fluorescence upcon-version experiments (Gustavssonet al., 2006a), Gustavsson, etc., used the third harmonic of a mode-locked Ti:sapphire laser as the excitation source. The 267 nm pulses are generated in a frequency-tripling system using two 0.5 mm type I BBO crystals. Typically, the average excitation power at 267 nm was 40 mW. The typical fluorescence decay curves for uracil, 6-methyluracil, 1,3-dimethy-lu racil, 5-methyluracil (thymine), and 5-fluorouracil are shown in Fig. 8.8. In Fig. 8.8 there is also the 330 fs (FWHM) Gaussian apparatus function. The fluorescence decays of the first three compounds are extremely fast, barely lo nger than the apparatus function (<1 ps). The fluorescence decays of two 5-substituted compounds, on the other hand, are much longer. This is only a taste of the work done in DNA, a problem that has been largely refractory to fluorescence analysis on longer timescale. Most recently, this work was extended (Miannay et al., 2007). Recently, an upconversion system similar to ours was used to probe the sequence and H-bonding dependence of natural base lifetimes in DNA oligonucleotides (both single and double stranded) (Schwalb and Temps, 2008).
Figure 8.8.
Fluorescence decays of five uracils in room-temperature aqueous solutions (~2.5 × 10⁻³ mol/dm3) at 330 nm: (in increasing order) uracil, 6-methyluracil, 1,3-dimethyluracil, 5-methyluracil (thymine), and 5-fluorouracil. Also shown is the 330 fs (FWHM) Gaussian apparatus function. The inset shows the same curves on a semilog scale. Reproduced with permission of J. Am. Chem. Soc. (2006) 607. Copyright © 2007 American Chemical Society.
Clearly, upconversion is a suitable tool for the early dynamics of nucleic acids.
5. Summary and Future Directions
We have reviewed the basic concepts of the upconversion technique and demonstrated how it can be used in measuring time-resolved fluorescence spectra in biophysics with subpicosecond time resolution. An upconversion SPF (spectrophotofluorometer) based on these concepts has been built and design considerations have been discussed. This technique opens a window to a lot of unexplored territory in biophysics, especially studies of the previously invisible “dark” subpopulation of tryptophan in proteins and other heavily quenched chromophores. It should be possible to improve the performance features of upconversion systems by further effort, employing thinner (or composite) crystals and shorter laser pulses. More complex optics (multiplexing) can also be used to obtain TRES more rapidly. A direct fluorescence upconversion spectrograph seems promising (Zhao et al., 2005). If probe pulses are properly tilted by a prism, and then mixed with the fluorescence in the nonlinear crystal, it is possible to gate a wide wavelength range simultaneously. Improvement will be needed to translate the system to the UV for use in biophysics, such as dispersion correction, array detector UV sensitization, etc. Developments in nonlinear materials involving “poling” and nanocrystalline alignment may soon bring order of magnitude sensitivity increases. If pulse power, repetition rate, and optical properties all combine their current growth, upconversion will become as common as TCSPC, and time resolution will be selected by “detuning” (dispersing in time) the probe pulse for a more rapid, coarse collection. The ultimate limit for shorter timing will, of course, be the width of the transitions themselves, as the “transform-limited” spectral width of pulses below ~50 fs begins to excite multiple electronic bands (unavoidably). This bar to earlier times is a rare example of the uncertainty principle in action.
In all, upconversion is a technology now primed for growth in biophysics.
References
- Abbyad P, Shi X, Childs W, McAnaney T, Cohen B, Boxer S. Measurement of solvation responses at multiple sites in a globular protein. J Phys Chem B. 2007;111:8269. doi: 10.1021/jp0709104. [DOI] [PMC free article] [PubMed] [Google Scholar]
- Alcala JR, Gratton E, Prendergast FG. Interpretation of fluorescence decays in proteins using continuous lifetime distributions. Biophys J. 1987;51:925. doi: 10.1016/S0006-3495(87)83420-3. [DOI] [PMC free article] [PubMed] [Google Scholar]
- Andreatta D, Sen S, Lustres J, Kovalenko S, Ernsting N, Murphy C, Coleman R, Berg M. Ultrafast dynamics in DNA: Fraying at the end of the helix. J Am Chem Soc. 2006;128:6885. doi: 10.1021/ja0582105. [DOI] [PMC free article] [PubMed] [Google Scholar]
- Andrews DL, Demidov AA. An introduction to laser spectroscopy. 2. Kluwer Academic/Plenum Publisher; New York: 2002. [Google Scholar]
- Arzhantsev S, Maroncelli M. Design and characterization of a femtosecond fluorescence spectrometer based on optical Kerr gating. Appl Spectrosc. 2005;59:206. doi: 10.1366/0003702053085007. [DOI] [PubMed] [Google Scholar]
- Barbara PF, Brus LE, Reutzepis PP. Picosecond time-resolved fluorescence study of s-tetrazine vibrational-relaxation in solution. Chem Phys Lett. 1980;69:447. [Google Scholar]
- Becker W. Advanced time-correlated single photon counting techniques. Berlin: Springer; 2005. [Google Scholar]
- Beechem JM, Brand L. Time-resolved fluorescence of proteins. Annu Rev Biochem. 1985;54:43. doi: 10.1146/annurev.bi.54.070185.000355. [DOI] [PubMed] [Google Scholar]
- Bradley DJ, Bryant SF, Sibbett W. Intensity dependent time resolution and dynamic-range of photochron picosecond streak cameras to linear photoelectric recording. Rev Sci Instrum. 1980;51:824. doi: 10.1063/1.1135369. [DOI] [PubMed] [Google Scholar]
- Bradley DJ, Mcinerney J, Dennis WM, Taylor JR. A new synchroscan streak-camera readout system for use with CW mode-locked lasers. Opt Commun. 1983;44:357. [Google Scholar]
- Birch DJ, Imhof RE. Time-domain fluorescence spectroscopy using time-correlated single-photon counting. In: Lakowicz JR, editor. Topics in fluorescence spectroscopy. Vol. 1. Plenum Press; New York: 1991. pp. 1–95. [Google Scholar]
- Changenet P, Zhang H, Van der Meer MJ. Subpicosecond fluorescence upconversion measurements of primary events in yellow proteins. Chem Phys Lett. 1998;282:276. [Google Scholar]
- Chen RF, Knutson JR, Ziffer H, Porter D. Fluorescence of tryptophan dipeptides-correlations with the rotamer model. Biochemistry. 1991;30:5184. doi: 10.1021/bi00235a011. [DOI] [PubMed] [Google Scholar]
- Chowdhury P, Gondry M, Genet R, Martin JL, Menez A, Negrerie M, Petrich JW. Picosecond dynamics of a peptide from the acetylcholine receptor interacting with a neurotoxin probed by tailored tryptophan fluorescence. Photochem Photobiol. 2003;77:151. doi: 10.1562/0031-8655(2003)077<0151:pdoapf>2.0.co;2. [DOI] [PubMed] [Google Scholar]
- Clayton A, Sawyer W. Tryptophan rotamer distributions in amphipathic peptides at a lipid surface. Biophys J. 1999;76:3235. doi: 10.1016/S0006-3495(99)77475-8. [DOI] [PMC free article] [PubMed] [Google Scholar]
- Cohen B, McAnaney T, Park E, Jan Y, Boxer S, Jan L. Probing protein electrostatics with a synthetic fluorescent amino acid. Science. 2002;296:1700. doi: 10.1126/science.1069346. [DOI] [PubMed] [Google Scholar]
- Dashnau JL, Zelent B, Vanderkooi JM. Tryptophan interactions with glycerol/water and trehalose/sucrose cryosolvents: Infrared and fluorescence spectroscopy and ab initio calculations. Biophys Chem. 2005;114:71. doi: 10.1016/j.bpc.2004.10.003. [DOI] [PubMed] [Google Scholar]
- Duguay MA, Hansen JW. Optical sampling of subnanosecond light pulses. Appl Phys Lett. 1968;13:178. [Google Scholar]
- Eimerl D. Electrooptic, linear, and nonliner optical-properties of KDP and its isomorphs. Ferroelectrics. 1987;72:397. [Google Scholar]
- Espagne A, Paik DH, Changenet-Barret P, Martin MM, Zewail AH. Ultrafast photoisomerization of photoactive yellow protein chromophore analogues in solution: Influence of the protonation state. Chem Phys Lett. 2006;7:1717. doi: 10.1002/cphc.200600137. [DOI] [PubMed] [Google Scholar]
- Fiebig T, Chachisvilis M, Manger M, Zewail AH, Douhal A, Garcia-Ochoa I, de La Hoz Ayuso A. Femtosecond dynamics of double proton transfer in a model DNA base pair: 7-azaindole dimers in the condensed phase. J Phys Chem A. 1999;103:7419. [Google Scholar]
- Fleming GR. Chemical application of ultrafast spectroscopy. Oxford University Press; New York: 1986. [Google Scholar]
- Fork RL, Brito CH, Becker PC, Shank CV. Compression of optical pulses to 6 femtoseconds by using cubic phase compensation. Opt Lett. 1987;12:483. doi: 10.1364/ol.12.000483. [DOI] [PubMed] [Google Scholar]
- Fukunaga Y, Nishimoto E, Yamashita K, Otosu T, Yamashita S. The partially unfolded state of beta-momorcharin characterized with steady-state and time-resolved fluorescence studies. J Biochem. 2007;141:9. doi: 10.1093/jb/mvm002. [DOI] [PubMed] [Google Scholar]
- Ghosh G. Temperature dispersion of refractive-indexes in beta-bab2o4 and lib3o5 crystals for nonlinear-optical devices. J Appl Phys. 1995;78:6752. [Google Scholar]
- Gregoire G, Jouvet C, Dedonder C, Sobolewski A. Ab initio study of the excited-state deactivation pathways of protonated tryptophan and tyrosine. J Am Chem Soc. 2007;129:6223. doi: 10.1021/ja069050f. [DOI] [PubMed] [Google Scholar]
- Grinvald A, Steinberg IZ. Analysis of fluorescence decay kinetics by method of least-squares. Anal Biochem. 1974;59:583. doi: 10.1016/0003-2697(74)90312-1. [DOI] [PubMed] [Google Scholar]
- Gu JL, Shi JL, You GJ, Xiong LM, Qian SX, Hua ZL, Chen HR. Incorporation of highly dispersed gold nanoparticles into the pore channels of mesoporous silica thin films and their ultrafast nonlinear optical response. Adv Mater. 2005;17:557. [Google Scholar]
- Gustavsson T, Banyasz A, Lazzarotto E, Markovitsi D, Scalmani G, Frisch M, Barone V, Improta R. Singlet excited-state behavior of uracil and thymine in aqueous solution: A combined experimental and computational study of 11 uracil derivatives. J Am Chem Soc. 2006a;128:607. doi: 10.1021/ja056181s. [DOI] [PubMed] [Google Scholar]
- Gustavsson T, Sarkar N, Lazzarotto E, Markovitsi D, Scalmani G, Frisch M, Improta R. Singlet excited state dynamics of uracil and thymine derivatives: A femtosecond fluorescence upconversion study in acetonitrile. Chem Phys Lett. 2006b;429:551. [Google Scholar]
- Halliday L, Topp M. Picosecond luminescence detection using type-2 phase-matched frequency-conversion. Chem Phys Lett. 1977;46:8. [Google Scholar]
- Halliday L, Topp M. Picosecond optical pulse sampling by frequency-conversion - studies of solvent-induced molecular relaxation. J Phys Chem. 1978;82:2273. [Google Scholar]
- Holten D, Windsor MW. Picosecond flash-photolysis in biology and biophysics. Annu Rev Biophys. 1978;7:189. doi: 10.1146/annurev.bb.07.060178.001201. [DOI] [PubMed] [Google Scholar]
- Ihalainen JA, Croce R, Morosiuotto T. Excitation decay pathways of Lhca proteins: A time-resolved fluorescence study. J Phys Chem B. 2005;109:21150. doi: 10.1021/jp0519316. [DOI] [PubMed] [Google Scholar]
- Inchauspe CMG, Martinez OE. Quartic phase compensation with a standard grating compressor. Opt Lett. 1997;22:1186. doi: 10.1364/ol.22.001186. [DOI] [PubMed] [Google Scholar]
- Ippen EP, Shank CV. Sub-picosecond spectroscopy. Phys Today. 1978;31:41. [Google Scholar]
- Jimenez R, Fleming GR, Kumar PV, Maroncelli M. Femtosecond solvation dynamics of water. Nature. 1994;369:471. [Google Scholar]
- Kafka JD, Baer T. Prism-pair dispersive delay-lines in optical pulse-compression. Opt Lett. 1987;12:401. doi: 10.1364/ol.12.000401. [DOI] [PubMed] [Google Scholar]
- Kahlow MA, Jarzeba W, Dubruil TP, Barbara PF. Ultrafast emission-spectroscopy in the ultraviolet by time-gated upconversion. Rev Sci Instrum. 1988;59:1098. [Google Scholar]
- Kennis JTM, Gobets B, van Stokkum IHM, Dekker JP, van Grondelle R, Fleming GR. Light harvesting by chlorophylls and carotenoids in the photo-system I core complex of synechococcus elongatus: A fluorescence upconversion study. J Phys Chem B. 2001;105:4485. [Google Scholar]
- Kurz LC, Fite B, Jean J, Park J, Erpelding T, Callis P. Photophysics of tryptophan fluorescence: Link with the catalytic strategy of the citrate synthase from thermoplasma acidophilum. Biochemistry. 2005;44:1394. doi: 10.1021/bi048323l. [DOI] [PubMed] [Google Scholar]
- Lakowicz JR. Principles of fluorescence spectroscopy. 2. Kluwer Academic/Plenum Publishers; New York: 1999. [Google Scholar]
- Lakowicz JR. On spectral relaxation in proteins. Photochem Photobiol. 2000;72:421. doi: 10.1562/0031-8655(2000)072<0421:OSRIP>2.0.CO;2. [DOI] [PMC free article] [PubMed] [Google Scholar]
- Lampa-Pastrk S, Lafuente RC, Beck WF. Excited-state axial-ligand photodissociation and nonpolar protein-matrix reorganization in zn(II)-substituted cytochrome c. J Phys Chem B. 2004;108:12602. [Google Scholar]
- Li T, Hassanali AA, Kao Y, Zhong D, Singer SJ. Hydration dynamics and time scales of coupled water-protein fluctuations. J Am Chem Soc. 2007;129:3376. doi: 10.1021/ja0685957. [DOI] [PubMed] [Google Scholar]
- Liu LQ, Nagashima K. Optimum phase matching and effective nonlinear coefficients of lbo and ktp for continuously changing wavelength. Opt Laser Technol. 1999;31:283. [Google Scholar]
- Lu W, Kim J, Qiu W, Zhong D. Femtosecond studies of tryptophan solvation: Correlation function and water dynamics at lipid surfaces. Chem Phys Lett. 2004;388:120. [Google Scholar]
- Mahr H, Hirsch MD. Optical up-conversion light gate with picosecond resolution. Opt Commun. 1975;13:96. [Google Scholar]
- May JM, Beechem JM. Monitoring conformational change in the human erythrocyte glucose carrier - use of a fluorescent-probe attached to an exofacial carrier sulfhydryl. Biochemistry. 1993;32:2907. doi: 10.1021/bi00062a022. [DOI] [PubMed] [Google Scholar]
- Mcmahon LP, Yu HT, Vela MA, Morales GA, Shui L, Fronczek FR, McLaughlin ML, Barkley MD. Conformer interconversion in the excited state of constrained tryptophan derivatives. J Phys Chem B. 1997;101:3269. [Google Scholar]
- Miannay F, Bányász A, Gustavsson T, Markovitsi D. Ultrafast excited-state deactivation and energy transfer in guanine-cytosine DNA double helices. J Am Chem Soc. 2007;129:14574. doi: 10.1021/ja077100q. [DOI] [PubMed] [Google Scholar]
- Muino PL, Callis PR. Hybrid simulations of solvation effects on electronic-spectra - indoles in water. J Chem Phys. 1994;100:4093. [Google Scholar]
- Muller MG, Drews G, Holzwarth A. Primary charge separation processes in reaction centers of an antenna-free mutant of Rhodobacter capsulatus. Chem Phys Lett. 1996;258:194. [Google Scholar]
- Murao T, Yamazaki I, Yoshihara K. Applicability of a microchannel plate photo-multiplier to the time-correlated photon-counting technique. Appl Opt. 1982;21:2297. doi: 10.1364/AO.21.002297. [DOI] [PubMed] [Google Scholar]
- O’Connor DV, Phillips D. Time correlated single photon counting. Academic Press; New York: 1984. [Google Scholar]
- Pan CP, Callis PR, Barkley MD. Dependence of tryptophan emission wavelength on conformation in cyclic hexapeptides. J Phys Chem B. 2006;110:7009. doi: 10.1021/jp056164p. [DOI] [PubMed] [Google Scholar]
- Qiu W, Zhang L, Okobiah O, Yang Y, Wang L, Zhong D, Zewail AH. Ultrafast solvation dynamics of human serum albumin: Correlations with conformational transitions and site-selected recognition. J Phys Chem B. 2006;110:10540. doi: 10.1021/jp055989w. [DOI] [PubMed] [Google Scholar]
- Ross JA, Wyssbrod HR, Porter RA, Schwartz GP, Michaels CA, Laws WR. Correlation of tryptophan fluorescence intensity decay parameters with H-1 NMR-determined rotamer conformations-[tryptophan2]oxytocin. Biochemistry. 1992;31:1585. doi: 10.1021/bi00121a002. [DOI] [PubMed] [Google Scholar]
- Rubtsov IV, Yoshihara K. Vibrational coherence in electron donor-acceptor complexes. J Phys Chem A. 1999;103:10202. [Google Scholar]
- Ruggiero AJ, Todd DC, Fleming GR. Subpicosecond fluorescence anisotropy studies of tryptophan in water. J Am Chem Soc. 1990;112:1003. [Google Scholar]
- Schanz R, Kovalenko SS, Kharlanov V, Ernsting NP. Broad-band fluorescence upconversion for femtosecond spectroscopy. Appl Phys Lett. 2001;79:566. [Google Scholar]
- Schlarb U, Reichert A, Betzler K. SHG phase matching conditions for undoped and doped lithium niobate. Radiat Eff Defects Solids. 1995;136:1029. [Google Scholar]
- Schroder GF, Alexiev U, Gubmuller H. Simulation of fluorescence anisotropy experiments: Probing protein dynamics. Biophys J. 2005;89:3757. doi: 10.1529/biophysj.105.069500. [DOI] [PMC free article] [PubMed] [Google Scholar]
- Schwalb N, Temps F. Ultrafast electronic relaxation in guanosine is promoted by hydrogen bonding with cytidine. J Am Chem Soc. 2007;129:9272. doi: 10.1021/ja073448+. [DOI] [PubMed] [Google Scholar]
- Schwalb N, Temps F. Base sequence and higher-order structure induce the complex excited-state dynamics in DNA. Sciences. 2008;322:243. doi: 10.1126/science.1161651. [DOI] [PubMed] [Google Scholar]
- Shen YR. The principles of nonlinear optics. Wiley-Interscience; New York: 1984. [Google Scholar]
- Shen X, Knutson JR. Femtosecond internal conversion and reorientation of 5-methoxyindole in hexadecane. Chem Phys Lett. 2001a;339:191. [Google Scholar]
- Shen X, Knutson JR. Subpicosecond fluorescence spectra of tryptophan in water. J Phys Chem B. 2001b;105:6260. [Google Scholar]
- Szabo AG, Rayner DM. Fluorescence decay of tryptophan conformers in aqueous-solution. J Am Chem Soc. 1980;102:554. [Google Scholar]
- Topp MR. Pulsed laser spectroscopy. Appl Spectrosc Rev. 1979;14:1. [Google Scholar]
- Toptygin D, Savtchenko R, Meadow D, Brand L. Homogeneous spectrally- and time-resolved fluorescence emission from single-tryptophan mutants of IIA(Glc) protein. J Phys Chem B. 2001;105:2043. [Google Scholar]
- Toptygin D, Gronenborn AM, Brand L. Nanosecond relaxation dynamics of protein GB1 identified by the time-dependent red shift in the fluorescence of tryptophan and 5-fluorotryptophan. J Phys Chem B. 2006;110:26292. doi: 10.1021/jp064528n. [DOI] [PubMed] [Google Scholar]
- Van Stokkum IHM, Gobets B, Gensch T. (Sub)-picosecond spectral evolution of fluorescence in photoactive proteins studied with a synchroscan streak camera system. Photochem Photobiol. 2006;82:380. doi: 10.1562/2005-06-15-RA-572. [DOI] [PubMed] [Google Scholar]
- Vincent M, Gallay J, Demchenko AP. Solvent relaxation around the excited-state of indole - analysis of fluorescence lifetime distributions and time-dependence spectral shifts. J Phys Chem. 1995;99:14931. [Google Scholar]
- Xu J, Knutson JR. Femtosecond fluorescence studies of tryptophan dipeptides in water: Explanation of quasi static self quenching. 2008. (submitted for publication) [Google Scholar]
- Xu JH, Toptygin D, Graver KJ, Albertini RA, Savtchenko RS, Meadow ND, Roseman S, Callis PR, Brand L, Knutson JR. Ultrafast fluorescence dynamics of tryptophan in the proteins monellin and IIA(Glc) J Am Chem Soc. 2006;128:1214. doi: 10.1021/ja055746h. [DOI] [PubMed] [Google Scholar]
- Yu BL, Bykov AB, Qiu T. Femtosecond optical Kerr shutter using lead-bismuth-gallium oxide glass. Opt Commun. 2003;215:407. [Google Scholar]
- Zelent B, Vanderkooi JM, Coleman RG, Gryczynski I, Gryczynski Z. Protonation of excited state pyrene-1-carboxylate by phosphate and organic acids in aqueous solution studied by fluorescence spectroscopy. Biophys J. 2006;91:3864. doi: 10.1529/biophysj.106.088740. [DOI] [PMC free article] [PubMed] [Google Scholar]
- Zernike F, Midwinter JE. Applied nonlinear optics. John Wiley & Sons; New York: 1973. [Google Scholar]
- Zhang L, Kao Y, Qiu W, Wang L, Zhong D. Femtosecond studies of tryptophan fluorescence dynamics in proteins: Local solvation and electronic quenching. J Phys Chem Lett B. 2006;110:18097. doi: 10.1021/jp063025e. [DOI] [PubMed] [Google Scholar]
- Zhao LJ, Lustres JLP, Farztdinov V, Ernsting NP. Femtosecond fluorescence spectroscopy by upconversion with tilted gate pulses. Phys Chem Chem Phys. 2005;7:1716. doi: 10.1039/b500108k. [DOI] [PubMed] [Google Scholar]
- Zwicker HR. Photoemissive detectors in Optical and infrared detectors. 2. Springer-Verlag; New York: 1981. p. 149. [Google Scholar]


