Abstract
The eye lens crystallin proteins are subject to UV irradiation throughout life, and the photochemistry of damage proceeds through the excited state; thus, their tryptophan (Trp) fluorescence lifetimes are physiologically important properties. The time resolved fluorescence spectra of single Trps in human γD- and γS-crystallins have been measured with both an upconversion spectrophotofluorometer on the 300fs to 100ps time scale, and a time correlated single photon counting apparatus on the 100ps to 10ns time scale, respectively. Three Trps in each wild type protein were replaced by phenylalanine, leading to single-Trp mutants: W68-only and W156-only of HγD- and W72-only and W162-only of HγS-crystallin. These proteins exhibit similar ultrafast signatures: positive definite decay associated spectra (DAS) for 50 – 65ps decay constants that indicate dominance of fast, heterogeneous quenching. The quenched population (judged by amplitude) of this DAS differs among mutants. Trps 68, 156 in human γD- and Trp72 in human γS-crystallin are buried, but water can reach amide oxygen and ring HE1 atoms through narrow channels. QM-MM simulations of quenching by electron transfer predict heterogeneous decay times from 50–500 ps that agree with our experimental results. Further analysis of apparent radiative lifetimes allow us to deduce that substantial subpopulations of Trp are fully quenched in even faster (sub-300 fs) processes for several of the mutants. The quenching of Trp fluorescence of human γD- and γS-crystallin may protect them from ambient light induced photo damage.
Introduction
In recent years, femtosecond fluorescence spectroscopy (~100 fs time resolution) has become a powerful technique to study both structure and conformational dynamics of proteins. Processes such as folding/unfolding, substrate or ligand binding as well as protein-protein interactions have been studied over a wide range of solution conditions.1–4 Intrinsic fluorescence of proteins originates from three aromatic amino acid residues: tryptophan (Trp), tyrosine (Tyr), and phenylalanine (Phe), with distinct absorption and emission shapes, quantum yields and lifetimes.5,6 At 295nm and above, the extinction of Trp in protein exceeds the others by two orders of magnitude. The intensity/quantum yield and fluorescence emission maximum of Trp is highly sensitive to local environment, i.e., is solvent dependent. Thus tryptophan, a dominant source of UV absorbance and emission in proteins, has been widely used as a fluorescent probe.7–9 Generally, the fluorescence spectrum blue shifts to shorter wavelengths and intensity of the fluorescence increases as the polarity of the surrounding solvent decreases.10,11 Trp residues buried in the hydrophobic core of proteins are often blue shifted by 10 to 20 nm compared to surface Trps.12 Further, the fluorescence lifetime and quantum yield of Trp is sharply reduced by charged groups and waters that enable quenching (through electron transfer to the local backbone amide) by making the electric potential positive at the amide relative to the ring.13,14 Certain amino acid side chains have been implicated as quenchers. 15
It is found that even single-Trp peptides and proteins frequently exhibit wavelength-dependent multiexponential fluorescence decays, with each exponential term associated with a distinct decay associated spectrum (DAS).16–19 In spite of the many investigations made in Trp fluorescence, however, a consensus understanding of Trp fluorescence decay complexity in proteins is still elusive.20–22 Two distinct interpretations have competed to explain the multiexponential decay of Trp fluorescence. One focuses on heterogeneous population loss (inhomogeneous decay of the electronically excited state). Because Trps in distinct environments will often have different fluorescence lifetimes, the complex decay of Trp fluorescence can most simply be explained by ground state heterogeneity. A heterogeneity caused by population of multiple rotamer states has been supported by lifetime studies in constrained Trp derivatives23 and protein crystals24, where a rational set of preexponential amplitudes is seen. In addition to explicit rotamers of the Trp side chain, microconformational states (conformers) of proteins with subtly different local environments around the indole group can also establish ground-state heterogeneity. 25,26
The second view centers on the excited state equilibration resulting from solvent (or protein) relaxation, a process that shifts spectra without changing excited state population.22,27 Solvent relaxation is driven by the increased dipole moment of the excited indole. This model predicts relatively shortlived “blue” and long-lived “red” DAS, i.e., average lifetime should be found to increase with increasing wavelength, and sets of DAS will queue with longer decay times linked to longer wavelength components.23,28 Surveying across the time resolved decay surface, decay curves should evolve from rapid decay at the blue end of the spectrum, to a region where the average population decay is dominant, and finally to curves exhibiting a rising behavior at the longer wavelength (red end) of the spectrum.29 On the red edge, one should recover a negative preexponential amplitude associated with a short lifetime, and this is a benchmark of excited-state reaction. Of course, the lack of this negative amplitude does not strictly preclude relaxation, as other effects (e.g., superposed heterogeneity or a sharp decrease in radiative decay rate) can suppress or even wipe out that signature.
Popularity of “conformer” vs. “solvent relaxation” models is not definitive. Distinguishing between these two kinetic processes may become difficult if they coexist and overlap in the experimental time window. Therefore, every unknown DAS component should be approached with both models in mind. Fortunately, recent investigations have suggested, however, that solvation in peptides and proteins often precedes the emergence of population heterogeneity.30,31
Crystallin 32,33 is a water-soluble structural protein found in the lens of eyes. Since the central fiber cells in lens lose their nuclei during development, these crystallins are original and retained throughout life. This is extremely unusual and it requires them to be exceptionally stable proteins. Crystallins in mammalian lens can be classified into three types: α, β and γ crystallins, based on elution order in gel filtration chromatography. The β- and γ-crystallins are solely structural proteins, while α-crystallin is both a molecular chaperone and a structural protein. The oligomeric β- and monomeric γ-crystallins are similar in sequence, structure and topology. They comprise the protein superfamily called βγ-Crystallins. The α-crystallin superfamily and βγ-crystallins dominate the mammalian crystalline lens, while δ-crystallin is found exclusively in reptiles and birds.
The main function of the lens is to transmit and focus light on the retina without distortion. A further function of the human lens is to filter light between 295–400nm from reaching the retina and therefore the lens is continually under photooxidative stress. The wavelengths absorbed by lens are potentially harmful to this tissue. There is a significant correlation between UV irradiation and the prevalence of senile cataract.34 The majority of the radiation transiting proteins is absorbed by Trp residues, which is probably the key species for long-term, low-level radiation damage to the lens. The prompt quenching of Trp fluorescence may protect them from photo induced reactions. Our previous steady-state and time-resolved fluorescence measurement on HγD- and HγS-crystallin suggested that the gamma-crystallin fold may have evolved to protect tryptophan residues from ultraviolet photo damage. 32,33,35
Covalently damaged human γD-crystallin (HγD-crystallin)32 and human γS-crystallin (HγS-crystallin) 36 are components of mature-onset cataracts. Homology studies by Zarina et al.37 show that human γS-crystallin has 37 % identity with β-crystallin and 53 % identity with γD-crystallin. Cataract, a leading cause of blindness worldwide, may result from aggregation and deposition of partially unfolded crystallins.38,39,45 HγD-crystallin is a two-domain, 173 amino acid protein predominantly found in the lens nucleus. Its structure has been solved to 1.25 Å resolution by Basak et al..40 The monomer has antiparallel beta-sheets arranged in four Greek key motifs, and the two domains show high levels of structural and sequence homology. HγD-crystallin has four buried Trps at positions 42 and 68 in the N-terminal domain and positions 130 and 156 in the C-terminal domain, while HγS-Crystallin has Trps at position 46, 72, and 136 and 162. Kosinski-Collins et al.41 constructed triple Trp mutants, each with three of the four intrinsic Trps substituted with Phe.
In this paper, a wide range of spectral and lifetime data for single Trp residues in human γ-crystallin (W68-only and W156-only of HγD- and W72-only and W162-only of HγS-crystallin) has been gathered to more fully understand their early photophysics. Combined with conventional absorption spectra and steady state fluorescence measurements, time resolved fluorescence dynamics of Trp, including fluorescence decay curves and decay associated spectra, were obtained using both an upconversion spectrophotofluorometer and a time correlated single photon counting (TCSPC) apparatus coupled to fs and ps laser sources. The decay surfaces are dissected to reveal contributions from both the heterogeneous Trp microenvironments in the protein and the evolving solvent shell. In addition to a “bulk water” relaxation29 of 1–2ps found in all mutants (and all Trp compounds in water), a 50 ~ 65ps fluorescence component was found with positive decay amplitude evident even at longer wavelengths (e.g., 400nm). The confluence of time-resolved emission spectral (TRES) data and simulations favor assignment of this term to a conformer experiencing ultrafast quenching. The large population fraction subject to this, and another subject to even faster (sub ps) yield reduction each provide an effective shunt for these proteins to evade singlet photochemistry.
Experimental Section
Femtosecond fluorescence decay measurements
Ultrashort laser pulses were generated from a mode-locked Ti: sapphire laser (Tsunami, Spectra-Physics) pumped by a diode-pumped solid state laser (Millennia, Spectra-Physics). The former produced 350 ~ 500 mW at 80MHz, with wavelength tunable from 780nm to 905 nm (in this paper, seeding was always tuned to ~885 nm) and a typical pulse width of about 120 fs. Regenerative amplification in a Ti: sapphire regenerative amplifier (Spitfire, Spectra Physics) with custom optics suited for 865 nm to 905 nm, yields output pulses at 885nm with energy of ~0.2 mJ and an autocorrelation pulse width of 350 fs at a repetition rate of 5 kHz. Ultraviolet excitation (295 nm) with an average power up to 30 mW was available by means of optical nonlinear second and third harmonic generation in 1 mm and 0.5 mm BBO crystals, respectively. The UV beam (THG, 295 nm) was then separated from the infrared beam (885 nm) and blue beam (SHG, 442 nm) by two dichroic mirrors, and the power was further attenuated to less than 1 mW before impinging on the sample to avoid photodegradation, hole burning, and other undesirable effects.42 The sample was held in a circular array of thin “demountable” cells (NSG Precision) with a path length below 1 mm (volume of 0.35 ml) in a continuously (>1 m/s) spinning delrin stacked slotted disk, thus avoiding overexposure of the same spot of sample. Emission was collected in off - axis paraboloids and refocused into a 0.2 mm thick BBO mixing crystal, and the upconversion signal was produced via type I sum frequency generation with the residual fundamental pulse (885 nm) delayed by a hollow IR retroreflector on a computer-controlled precision stage. To eliminate various strong background signals (infrared laser, remnant UV and unmixed or DFG fluorescence), a non-collinear configuration was used between the 885 gating pulse and fluorescence. Polarizations of measured fluorescence were fixed by the orientation of nonlinear BBO crystals (vertical in our setup) and the (magic angle) excitation by a halfwave plate. By angle tuning the mixing crystal, the upconverted optical signal, with a wavelength in the range 230–280nm, was directed into a monochromator (Triax 320, Jobin Yvon Inc. with a bandwidth of 0.5nm) and detected by a solar blind photomultiplier tube (R2078, Hamamatsu, dark rate < 1cps). The pulses were discriminated and then recorded by a gated single photon counter (994, EG&G Ortec). The “lamp” instrument response function was determined to be around 400 fs by measuring the cross-correlation between UV-generated spontaneous Raman scattering in water (near 328nm) and the infrared pulse. System polarization purity was tested with the linear fluorophore p-terphenyl, which yielded essentially theoretical intial anisotropy (0.40) and a single rotational correlation time of 41ps in cyclohexane (both from Sigma/Aldrich).
Nanosecond fluorescence decay measurements
A tunable cavity dumped dye laser (S/P 3520 with R6G) was synchronously pumped by a frequency-doubled, mode-locked NdYVO4 laser (Vanguard 2000-HM532, Spectra-Physics) to get 590nm laser pulses. The UV excitation beam (295 nm with pulse FWHM < 2ps) was generated by SHG in a BBO crystal, and magic angle emission/vertical excitation was employed. The fluorescence was scanned from 310nm to 405 nm with 8 nm bandwidth (JYH10) and recorded by a cooled MCP photomultiplier (Hamamatsu). The aggregate lamp function was about 100ps FWHM, so lifetimes of 80ps and longer can be resolved in this instrument. Melatonin in water was used as a monoexponential standard. Lifetimes were obtained by fitting the decay data to a multiexponential model, according to the weighted nonlinear least-squares method. Goodness of fit was evaluated with the inspection of residuals and their autocorrelation and χR2 functions.43 (the fits employed in this work yielded values of 1.01–1.1). For decay-associated spectra (DAS), a time-resolved decay surface was obtained by excitation at 295 nm and observation every 5 nm over the emission band. The instrument lamp function was contemporaneously acquired with a light-scattering suspension of dilute colloidal silica. Alternating the sample with the scatterer, stepping of the emission monochromator, data collection, and transfer of data from the multichannel buffer/analyzer to the computer was done automatically by the program “DAS32”. 44
Steady-state absorption and fluorescence spectra were obtained in a spectrophotometer (HP 8452A) and Fluorolog-3 spectrophotofluorometer (SPEX), respectively. Therefore, the DAS and TRES were normalized to the steady state spectra of Trp in crystallins.
Samples
Mutagenesis, expression, and purification of recombinant Human γ-Crystallins have been described elsewhere.32,33 Briefly, Trp substitutions in HγD- and HγS-crystallin were constructed by site-directed mutagenesis.41,45 Primers (IDT-DNA) encoding the substitutions were used to amplify the gene for HγD- and HγS-crystallin with an N-terminal 6-His tag in a pQE.1 plasmid. The proteins were expressed by Escherichia coli M15 [pREP4] cells.41 All mutant proteins accumulated as native-like soluble proteins The proteins were purified by affinity chromatography using a Ni-NTA resin (Qiagen). The purities of the proteins were confirmed by SDS-PAGE.
The crystallin solutions were prepared in a 10 mM sodium phosphate and 4.55 mM ammonium acetate buffer at pH 6.9 using distilled deionized water, together with 5mM DTT and 1mM EDTA. The concentration of crystallin was determined to be around 0.1 mM using the extinction coefficient ε280 = 26735 M−1cm−1. All samples were made at room temperature. A fresh sample solution was prepared for each time-resolved measurement.
QM-MM Simulations
The hybrid QM-MM method used in this paper has been described in recent publications of Trp fluorescence quenching in proteins.13,14,46–50 The method was developed from an earlier QM-MM procedure used to predict the fluorescence wavelengths of Trp in proteins.50,51 The QM method originates from Zerner’s INDO/SCIS method,52 modified to include the local electric fields and potentials at the atoms. The MM is CHARMM program (version 31b2). Hydrogens were added to the crystal structure of γD-crystallin (PDB code 1HK0), and the entire protein was solvated within a 35 Å radius sphere of TIP3 explicit water. The waters were held within the 35 Å radius with a quartic potential. The sphere was modified with additional waters when the protein drifted near the edge. The quantum mechanical (QM) part includes the selected Trp and the amide of the preceding residue, capped with hydrogens, i.e., N-formyl-tryptophanamide. The electric potential due to all non-QM atoms in the protein and solvent is calculated with a dielectric constant of 1 for each QM atom and added to the QM Hamiltonian. Methods and procedures to estimate electron transfer rates and lifetimes follow closely those of Callis et al. 14
Results and Discussion
Steady State Fluorescence
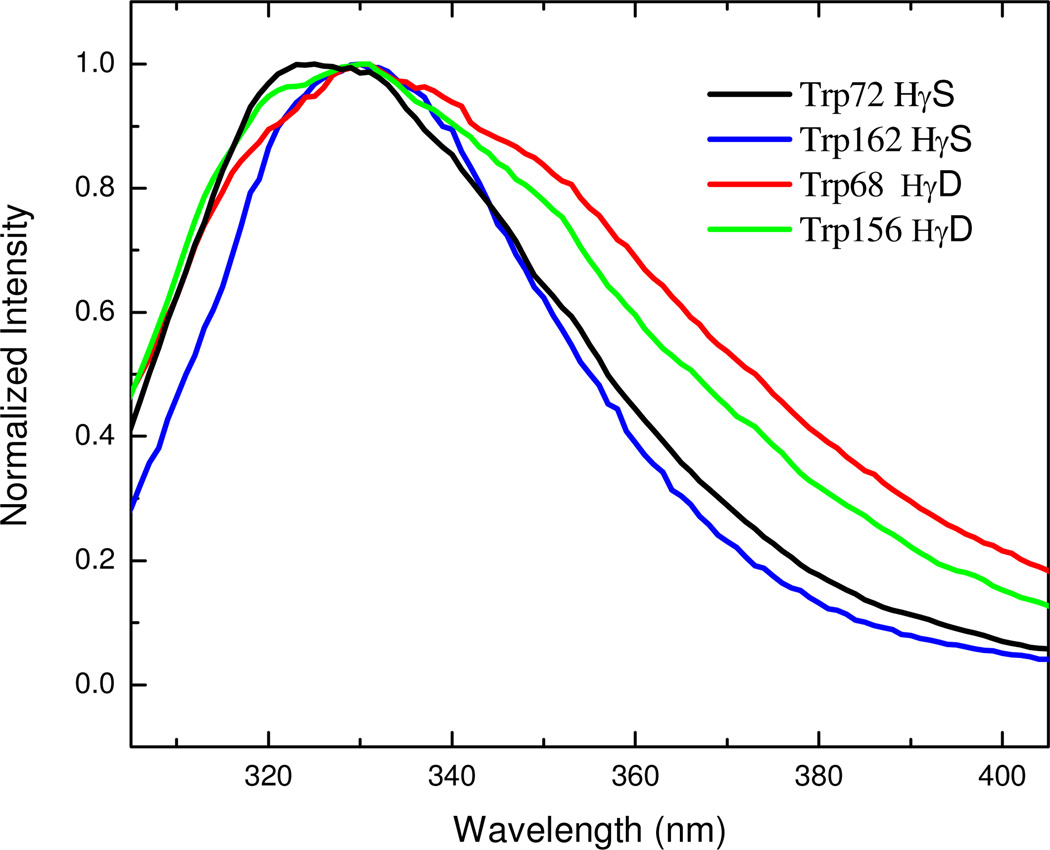
Figure 1 shows the steady state emission spectra of Trp in crystallins, respectively. The fluorescence of Trp68, Trp156 γD-crystallin and Trp162 γS-crystallin solutions all have a maximum around 330nm, while Trp72 γS-crystallin has maximum at 325 nm. All are quite blue shifted relative to Trp in water (355nm).29, 30 Figure 1 also shows that the fluorescence spectral width of the γS-crystallins is much narrower than those of the γD-crystallins. Notably, the steady state fluorescence intensity of Trp162 γS-crystallin is much higher than others (the quantum yield of Trp 162 γScrystallin is 3 times greater than the other crystallins).32
Figure 1.
Steady state fluorescence of Human γ-Crystallins
ns DAS of γ-Crystallins
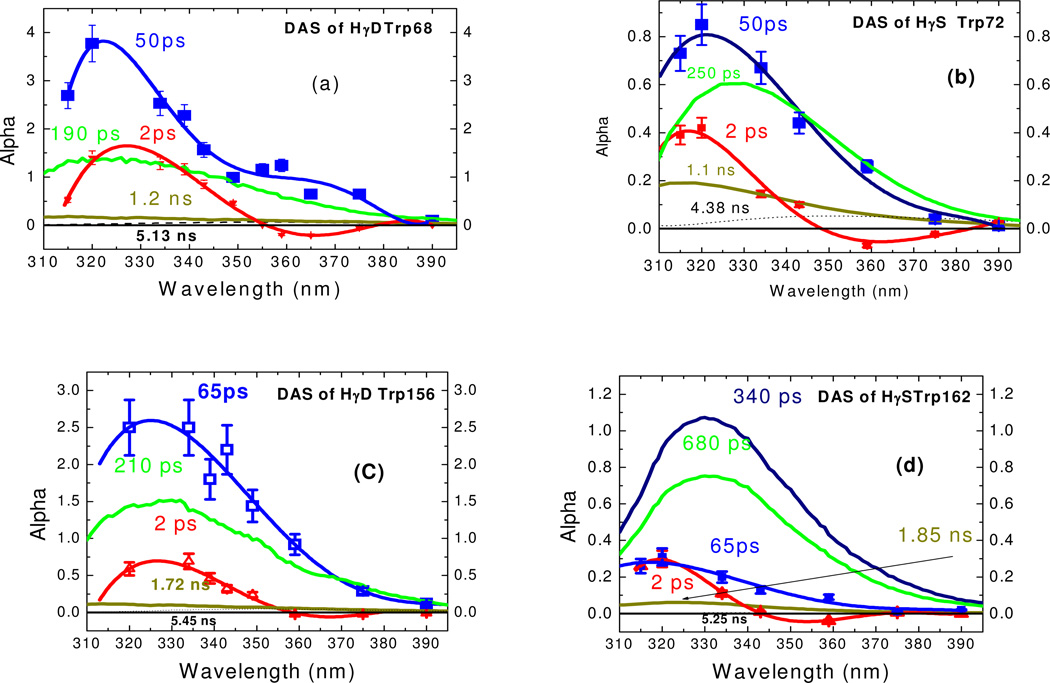
On the time scale from 100ps to 20ns, the decay curves of single Trps in crystallins are multiexponential. The decay surface was globally analyzed using three lifetimes (for W68, W156 γD-, and W72 γS-crystallins) or four lifetimes (for Trp162 γS-crystallin) with different DAS (see Figure 2a, b, c, d). For instance, Figure 2b shows the decay associated spectra for Trp72 γS-crystallin. The lifetimes (0.25ns, 1.1ns, 4.38ns) were obtained by fitting all the ns decay curves, rather than a single curve, to a global three exponential model. Trp68, 156 γD-crystallins and Trp72 γS-crystallin yielded a dominant component (~200ps), while Trp162 γS-crystallin yielded two lifetimes (340ps and 680ps). For comparison, Trp in water yielded a bi-exponential with lifetimes of 0.6ns and 3.2ns, with a mean lifetime of ~ 3ns. 29 On this time scale (above 100 ps), all samples show positive DAS amplitudes. We have noted in all samples the presence of small amounts of (perhaps denatured) contaminants that yield ~5 ns lifetime and vary among preparations. Hence we focus only on τi ≤ 3 ns. As mentioned above, DAS are often used to diagnose the relative importance of heterogeneity vs. relaxation in Trp emission. Since the DAS (measured in TCSPC) are all positive and do not shift in ascending lifetime order (cf., Trp72 in γS-crystallin), we can be confident heterogeneity is important here. As shown below, TRES width changes in this (0.1ns – 3ns) nanosecond time range, which firmly indicates that above 100ps, varying lifetimes come from heterogeneity, e.g. different conformers providing distinct environments for tryptophan.42
Figure 2.
Decay associated spectra of Trp in crystallins
Upconversion DAS/TRES of γ-Crystallins
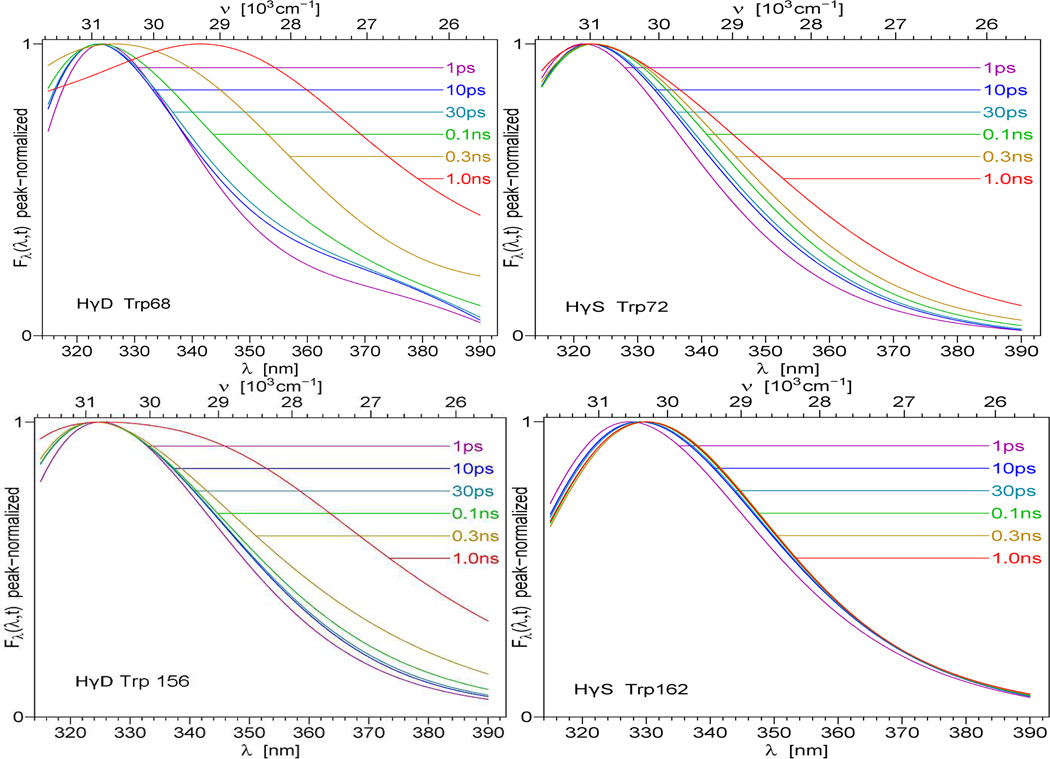
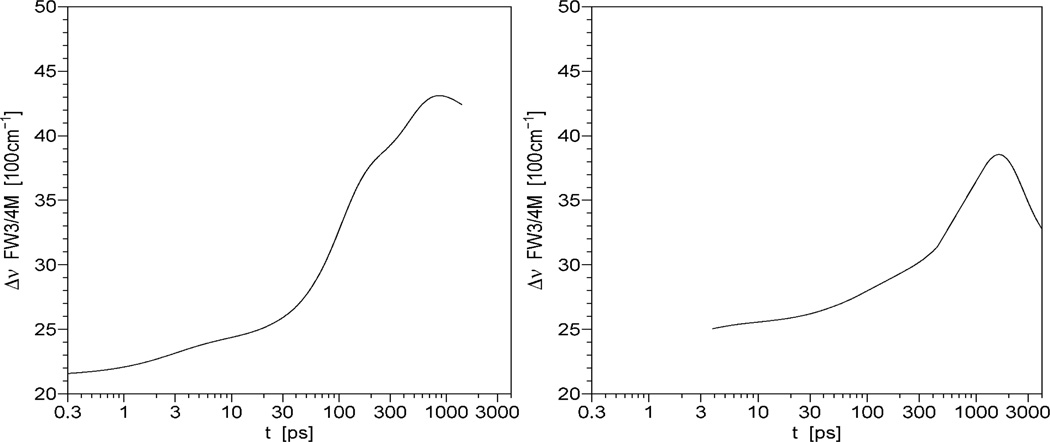
In this work, upconversion data revealed novel and distinctive DAS signatures on the 300 fs ~ 100 ps timescale. As shown in Fig. 2, aside from the ubiquitous “blue positive /red negative” 2 ps preexponential (previously seen for Trp solvation in bulk water), crystallins display a decay process not seen with Trp alone. In this time window, we found good agreement between data at all fluorescence wavelengths and three exponentials for crystallin. One of these decay components is set by the molecular mean lifetime from TCSPC, which is very slow in this window.42 We extracted femtosecond DAS of single Trp in crystallins by properly normalizing upconversion data to the TCSPC “time zero” DAS.42 Since the major nanosecond decay of crystallin was composed of the lifetimes of ~200ps and 1~2ns (in Trp68, 156 γD-crystallins and Trp72 γS-crystallin) or 340ps, 680ps and 2 ns (Trp162 γS-crystallin), we can sum total preexponential amplitude (alphas from the fit: I(λ,t)=Σαi (λ)e−(t/τi)) of tryptophan in crystallins to obtain a spectrum at “zero ns” time (which differs from the steady state spectrum). Of course, this time “zero” comes after the ~2ps solvent relaxation and 50~65ps fast decays seen via upconversion; both are too fast to be observed by TCSPC instruments. We properly normalize the tails of our upconversion data curves to this “zero time” spectrum, not the steady state spectrum (as matching tails to Iss would incorrectly presume a lack of ns decay complexity). The properly normalized fs DAS are shown in Figure 2. Note that the “bulk” water relaxation term (~2ps component) has both positive and negative extent in its DAS (red diamonds) on low wavelength and high wavelength sides, respectively. Interestingly, the novel (50~66ps) component (blue squares) has a significant positive amplitude (even larger than ns DAS) in the longer wavelength region. Unusually, Trp162 γS-crystallin has very small amplitudes of both fs DAS. If solvent relaxation were responsible for the 50~65 ps transient, this should have yielded a positive/negative DAS, or at least a severely blue shifted DAS without a significant positive amplitude at 400nm. Integrating data from both instruments, Figure 4 shows the properly normalized TRES (time resolved emission spectra) across the full scale from 1ps to 1ns. Clearly, these TRES are not shifting homogeneously, as their energy width (in Figure 5) varies dramatically after about 5 ps. The exception is that the energy width of Trp162 γS-crystallin increased from 2150 cm−1 to 2200cm−1 within 10 ps, and then kept nearly unchanged. This is as expected for a bulk water relaxation alone. Note that true solvent relaxation provides a smooth uniform spectral shift on the logarithmic time scale. The crystallin surface, in contrast, cannot be represented by uniform TRES shifting smoothly in time.
Figure 4.
Time-resolved Emission Spectra (TRES) of γ-crystallins
Figure 5.
Energy width of Trp68 γD-crystallin (left) and Trp72 γS-crystallin (right)
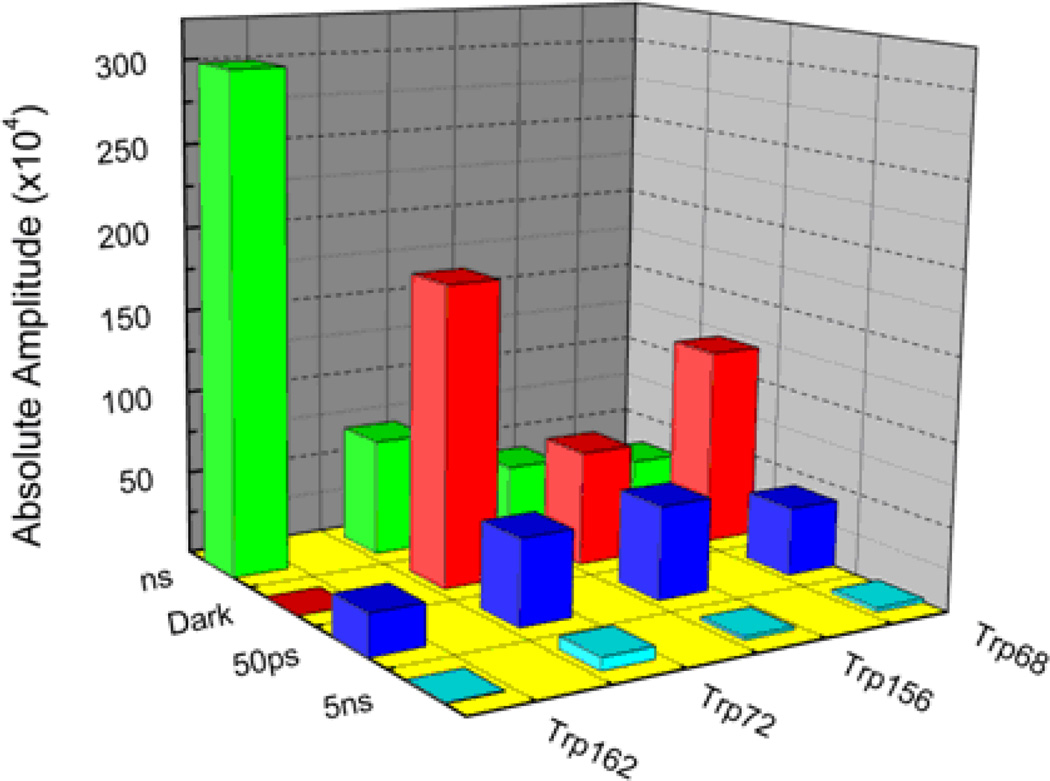
Recently, we have found that even simple dipeptides suffer ultrafast quenching on similar time scales,31 and that helps explain the quantum yield defect previously called QSSQ (“quasistatic self quenching).53 To examine fully the extent of ultrafast quenching in crystallins, we have applied the same analysis here to estimate the subpopulations subject to either 50ps quenching or sub-300fs yield loss. The absolute amplitudes (normalized to quantum yield) of each lifetime component are shown in Fig.3. The “ns” component is the contribution of all TCSPC lifetimes except for the spurious 5ns component. The “dark” component represents sub-ps processes that deplete the product (radiative rate * population) prior to both our upconversion and conventional measurements. We calculate the dark amplitude from the ratio of the apparent natural lifetime to that of a standard with similar spectrum: Adark = [(<τ>/Q)/(<τ>std/Qstd)-1]·ΣAi. Here we have used Trp162 γS-crystallin as the standard since its <τ>/Q is lower than that of Trp, which served as a standard in our previous work quantifying dark states in aqueous dipeptides.31 This reduced radiative lifetime is likely due to its blue-shifted spectrum relative to NATA and Trp.
Figure 3.
Absolute amplitudes (quantum yield) of lifetimes of Human γD, γS crystallins at pH 6.9
We can generally ascribe the QSSQ previously identified by Chen et al.53 to those two ultrafast processes: either 50–65ps or sub-ps processes (dark). As an aside, we neglect model terms for internal conversion between 1Lb and 1La since that process has been found to be faster than 50 fs. 54 Both QM-MM simulation and spectral position comport with our description of the emitting state (at all observed times) as 1LA.
Simulations
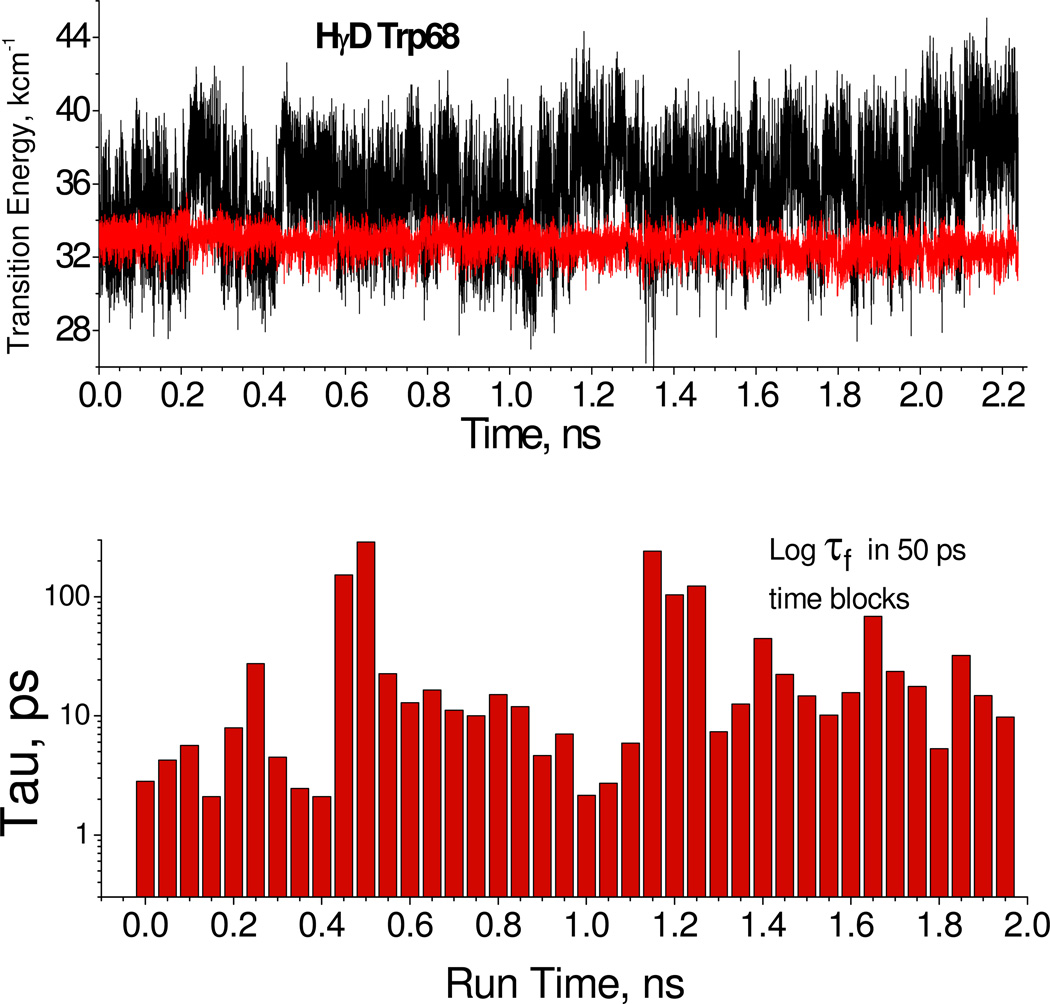
Using the same parameters and procedures as described previously,14 a QM-MM simulation was carried out for Trp68 of γD-Crystallin. Figure 6 shows the relative energies of the 1La state and ring-amide charge transfer state. The small energy gap periods (high quenching rate) correlate with a water donating an H-bond to the amide carbonyl and another accepting an H-bond from the ring HN. Other waters connected to these two collectively stabilize the amide CT state. In contrast, for the large energy gap regions (no quenching) these H-bonds tend to be disrupted and the nearby waters collectively destabilize the CT state, suggesting a source of lifetime heterogeneity due to quenching by electron transfer. The interval histogramming is a qualitative way to display time intervals for which short and long lifetimes persist over times that are a large fraction of the average excited state lifetime, including the frequent occurrence of configurations bearing very fast quenching rates. Another possible source of heterogeneity may come from similar gating of electron transfer to the backbone amide of His65, which is found in near contact with the Trp68 ring,36 but we have not investigated this in detail.
Figure 6.
Top 2.2 ns QM-MM Simulation of lowest CT (black) and 1La (red) state transition energies for Trp68 γD-crystallin with points shown every 1 ps. Bottom: Sequential 50-ps log10 average lifetimes based on the corresponding CT-1La energy gaps in the top figure. The heterogeneity suggested by the plot is consistent with that seen in the observed lifetimes.
Conclusions
The ultrafast photophysics of single Trp residues in various crystallins has been studied using time resolved fluorescence spectroscopy with both ps and femtosecond time resolution. Trp in mutants exhibits a multiexponential fluorescence decay after a water relaxation of ~2ps. This multiexponentiality is associated with ground-state heterogeneity including some very rapidly quenched subpopulations of Trp. The corresponding decay associated spectra have been extracted from the data. In addition to several previously accessible lifetimes over 100ps, a very fast lifetime of 50~65ps was found. The decay associated spectrum of this fast component has a positive amplitude at all detected wavelengths and is comparable in shape and position to other components, leading to TRES widths that increase nonuniformly after 5ps. This indicates that most of this component originates from ground-state heterogeneity, and it is not from solvent relaxation alone. Comparison of apparent radiative rates (<τ>/Q) permitted us to further deduce the existence of an ensemble of Trp lost even faster than our upconversion pulse (e.g. <300fs). This fs channel and the 50 ps channel both represent new, effective shunts for deactivating the singlet of these Trps. This ultrafast deactivation is supported by analysis of the MD (QM-MM) simulations. Much of the fast quenching can be rationally attributed to nearby charged residues and waters that electrostatically stabilize the CT state arising from electron transfer to the Trp backbone amide. Aqueous Trp environments with 3 ns mean lifetime and Q ~0.15 suggest a benchmark for typical vulnerability to photochemistry based on duration in the singlet. In previous work, we used TCSPC to measure how intradomain FRET to the shortest lived Trps might reduce this vulnerability nearly an order of magnitude. Here we show that sequestering of a major portion of the Trp population into ultrafast quenched environments drops that singlet exposure (vulnerability) another 3–4 fold (in all except Trp162). Upconversion clearly opens new windows into understanding the Trp microenvironment of proteins. In this case, it has been revealed that both femtosecond and tens-of-picoseconds quenching processes are powerful protective forces, reducing the exposure of a vulnerable protein to the potentially damaging photochemistry of Trp.
Acknowledgement
This research was supported [in part] by the Intramural Research Program of the NIH, NHLBI. This work was also supported by NIH grant GM 38759, GM 17980 and by NSF grants MCB 0416965, MCB 0719248, MCB-0133064, MCB-0446542 and NEI Grant EY 015834.
References
- 1.Brown O, Lopez S, Fuller A, Goodson T. Biophysical. Journal. 2007;93:1068. doi: 10.1529/biophysj.106.100958. [DOI] [PMC free article] [PubMed] [Google Scholar]
- 2.Santos J, Sica M, Marino Buslje C, Garrote A, Ermacora M, Delfino J. Biochemistry. 2009;48:595. doi: 10.1021/bi801969w. [DOI] [PubMed] [Google Scholar]
- 3.Ross J, Jameson D. Photochemical & Photobiological Sciences. 2008;7:1301. doi: 10.1039/b804450n. [DOI] [PubMed] [Google Scholar]
- 4.Hicks MR, Damianoglou A, Rodger A, Dafforn T. J. Molecular Biology. 2008;383:358. doi: 10.1016/j.jmb.2008.07.091. [DOI] [PubMed] [Google Scholar]
- 5.Beechem JM, Brand L. Annu. Rev. Biochem. 1985;54:43. doi: 10.1146/annurev.bi.54.070185.000355. [DOI] [PubMed] [Google Scholar]
- 6.Lakowicz JR. Principles of Fluorescence Spectroscopy (second edition) New York: Kluwer Academic/Plenum Publishers; 1999. [Google Scholar]
- 7.Pan C, Callis P, Barkley M. J. Phys. Chem. B. 2006;110:7009. doi: 10.1021/jp056164p. [DOI] [PubMed] [Google Scholar]
- 8.Callis PR. Methods Enzymol. 1997;278:113. doi: 10.1016/s0076-6879(97)78009-1. [DOI] [PubMed] [Google Scholar]
- 9.Kamath D, Kartha B, Mahato K. Spectrochimica ACTA part A-molecular and biomolecular spectroscopy. 2008;70:187. doi: 10.1016/j.saa.2007.06.041. [DOI] [PubMed] [Google Scholar]
- 10.Kao P, Chen K, Lin S, Chang L. Journal of Peptide Science. 2008;14:342. doi: 10.1002/psc.943. [DOI] [PubMed] [Google Scholar]
- 11.Roy A, Goss R, Wagner G, Winn M. Chem. Comm. 2008;39:4831. doi: 10.1039/b807512c. [DOI] [PubMed] [Google Scholar]
- 12.Pokalsky C, Wick P, Harms E, Lytle F, Vanetten R. J. Bio. Chem. 1995;270:3809. doi: 10.1074/jbc.270.8.3809. [DOI] [PubMed] [Google Scholar]
- 13.Callis P, Liu T. J. Phys. Chem. B. 2004;108:4248. [Google Scholar]
- 14.Callis P, Petrenko A, Muino P, Tusell J. J. Phys. Chem. B. 2007;111:10335. doi: 10.1021/jp0744883. [DOI] [PubMed] [Google Scholar]
- 15.Chen Y, Barkley M. Biochemistry. 1998;37:9976. doi: 10.1021/bi980274n. [DOI] [PubMed] [Google Scholar]
- 16.Rayner D, Szabo AG. Can J. Chem. 1978;56:743. [Google Scholar]
- 17.Knutson JR, Walbridge DG, Brand L. Biochemistry. 1982;21:4671. doi: 10.1021/bi00262a024. [DOI] [PubMed] [Google Scholar]
- 18.Stortelder A, Buijs J, Bulthuis J, van der Vies S, Gooijer C, van der Zwan G. Journal of Photochemistry and Photobiology B-Biology. 2005;78:53. doi: 10.1016/j.jphotobiol.2004.09.007. [DOI] [PubMed] [Google Scholar]
- 19.Szabo A, Rayner D. J. Am. Chem Soc. 1980;102:554. [Google Scholar]
- 20.Ross JA, Wyssbrod HR, Porter RA, Schwartz GP, Michaels CA, Laws WR. Biochemistry. 1992;31:1585. doi: 10.1021/bi00121a002. [DOI] [PubMed] [Google Scholar]
- 21.She M, Dong W, Umeda P, Cheung H. Biophysical Journal. 1997;73:1042. doi: 10.1016/S0006-3495(97)78137-2. [DOI] [PMC free article] [PubMed] [Google Scholar]
- 22.Vincent M, Gallay J, Demchenko AP. J. Phys Chem. 1995;99:14931. [Google Scholar]
- 23.Adams PD, Chen Y, Ma K, Zagorski MG, Sonnichsen FD, McLaughlin ML, Barkly MD. J. Am. Chem. Soc. 2002;124:9278. doi: 10.1021/ja0167710. [DOI] [PubMed] [Google Scholar]
- 24.Dahms TES, Willis KJ, Szabo AG. J. Am. Chem. Soc. 1995;117:2321. [Google Scholar]
- 25.Gonnelli M, Strambini GB. Biophysical Chemistry. 2003;104:155. doi: 10.1016/s0301-4622(02)00364-2. [DOI] [PubMed] [Google Scholar]
- 26.Kroes S, Canters G, Gilardi G, van Hoek A, Visser A. Biophys. J. 1998;75:2441. doi: 10.1016/S0006-3495(98)77688-X. [DOI] [PMC free article] [PubMed] [Google Scholar]
- 27.Toptygin D, Savtchenko R, Meadow D, Brand L. J. Phys. Chem. B. 2001;105:2043. [Google Scholar]
- 28.Lakowicz JR. Photochemistry and Photobiology. 2000;72:421. doi: 10.1562/0031-8655(2000)072<0421:OSRIP>2.0.CO;2. [DOI] [PMC free article] [PubMed] [Google Scholar]
- 29.Shen X, Knutson JR. J. Phys. Chem. B. 2001;105:6260. [Google Scholar]
- 30.Pal S, Zewail A. Chem. Rev. 2004;104:2099. doi: 10.1021/cr020689l. [DOI] [PubMed] [Google Scholar]
- 31.Xu J, Knutson J. Biophysical Journal. 2003;84:287A. [Google Scholar]
- 32.Chen J, Flaugh S, Callis P, King J. Biochemistry. 2006;45:11552. doi: 10.1021/bi060988v. [DOI] [PubMed] [Google Scholar]
- 33.Chen J, Toptygin D, Brand L, King J. Biochemistry. 2008;47:10705. doi: 10.1021/bi800499k. [DOI] [PMC free article] [PubMed] [Google Scholar]
- 34.Robman L, Taylor H. Eye. 2005;19:1074. doi: 10.1038/sj.eye.6701964. [DOI] [PubMed] [Google Scholar]
- 35.Chen J, Callis PR, King J. Biochemistry. 2009;48:3708. doi: 10.1021/bi802177g. [DOI] [PMC free article] [PubMed] [Google Scholar]
- 36.Smith J, Yang Z, Lin P, Zaidi Z, Abbasi A, Russell P. Biochem. J. 1995;307:407. doi: 10.1042/bj3070407. [DOI] [PMC free article] [PubMed] [Google Scholar]
- 37.Zarina S, Abbasi A, Zaidi Z. Biochem. J. 1992;287:375. doi: 10.1042/bj2870375. [DOI] [PMC free article] [PubMed] [Google Scholar]
- 38.Sandilands A, Hutcheson AM, Long HA, Prescott AR, Vrenson G, Loster J, Klopp N, Lutz RB, Graw J, Masaki S, Dobson CM, MacPhee CE, Quinlan RA. EMBO J. 2002;15:6005. doi: 10.1093/emboj/cdf609. [DOI] [PMC free article] [PubMed] [Google Scholar]
- 39.Meehan S, Berry Y, Luisi B, Dobson CM, Carver JA, MacPhee CE. J. Biol.Chem. 2004;279:3413. doi: 10.1074/jbc.M308203200. [DOI] [PubMed] [Google Scholar]
- 40.Basak A, Bateman O, Slingsby C, Pande A, Asherie N, Ogun O, Benedek G, Pande J. Journal of Molecular biology. 2003;328:1137. doi: 10.1016/s0022-2836(03)00375-9. [DOI] [PubMed] [Google Scholar]
- 41.Kosinski-Collins M, Flaugh S, King J. Protein Science. 2004;13:2223. doi: 10.1110/ps.04627004. [DOI] [PMC free article] [PubMed] [Google Scholar]
- 42.Xu J, Toptygin D, Graver K, Albertini R, Savtchenko R, Meadow N, Roseman S, Callis P, Brand L, Knutson J. J. Am. Chem. Soc. 2006;128:1214. doi: 10.1021/ja055746h. [DOI] [PubMed] [Google Scholar]
- 43.Badea MG, Brand L. Methods Enzymol. 1979;61:378. doi: 10.1016/0076-6879(79)61019-4. [DOI] [PubMed] [Google Scholar]
- 44.Knutson JR, Beechem JM, Brand L. Chem. Phys. Lett. 1983;102:501. [Google Scholar]
- 45.Kosinski-Collins M, King J. Protein Science. 2003;12:480. doi: 10.1110/ps.0225503. [DOI] [PMC free article] [PubMed] [Google Scholar]
- 46.Kurz L, Fite B, Jean J, Park J, Erpelding T, Callis P. Biochemistry. 2005;44:1394. doi: 10.1021/bi048323l. [DOI] [PubMed] [Google Scholar]
- 47.Liu T, Callis P, Hesp B, de Groot M, Buma W, Broos J. J. Am. Chem. Soc. 2005;127:4104. doi: 10.1021/ja043154d. [DOI] [PubMed] [Google Scholar]
- 48.Callis P, Liu T. Chem. Phys. 2006;326:230. [Google Scholar]
- 49.Muino P, Callis P. J. Phys. Chem. B. 2009;113:2572. doi: 10.1021/jp711513b. [DOI] [PubMed] [Google Scholar]
- 50.Vivian J, Callis P. Biophysical Journal. 2001;80:2093. doi: 10.1016/S0006-3495(01)76183-8. [DOI] [PMC free article] [PubMed] [Google Scholar]
- 51.Broos J, Tveen-Jensen K, de Waal E, Hesp B, Jackson J, Canters G, Callis P. Angewandte Chemie-International Edition. 2007;46:5137. doi: 10.1002/anie.200700839. [DOI] [PubMed] [Google Scholar]
- 52.Broo A, Pearl G, Zerner M. J. Phys. Chem. A. 1997;101:2478. [Google Scholar]
- 53.Chen RF, Knutson JR, Ziffer H, Porter D. Biochemistry. 1991;30:5184. doi: 10.1021/bi00235a011. [DOI] [PubMed] [Google Scholar]
- 54.Shen X, Knutson JR. Chem. Phys. Lett. 2001;339:191. [Google Scholar]


