The authors revise last year's predictions and project for the next 3 years, outlining a conceptual framework for contemplating the data based on an ecological model of the oncology delivery system.
Abstract
In 2011, we made predictions on the basis of data from the National Practice Benchmark (NPB) reports from 2005 through 2010. With the new 2011 data in hand, we have revised last year's predictions and projected for the next 3 years. In addition, we make some new predictions that will be tracked in future benchmarking surveys. We also outline a conceptual framework for contemplating these data based on an ecological model of the oncology delivery system. The 2011 NPB data are consistent with last year's prediction of a decrease in the operating margins necessary to sustain a community oncology practice. With the new data in, we now predict these reductions to occur more slowly than previously forecast. We note an ease to the squeeze observed in last year's trend analysis, which will allow more time for practices to adapt their business models for survival and offer the best of these practices an opportunity to invest earnings into operations to prepare for the inevitable shift away from historic payment methodology for clinical service. This year, survey respondents reported changes in business structure, first measured in the 2010 data, indicating an increase in the percentage of respondents who believe that change is coming soon, but the majority still have confidence in the viability of their existing business structure. Although oncology practices are in for a bumpy ride, things are looking less dire this year for practices participating in our survey.
Introduction
In 2011, we completed the first trends analysis1 of 6 years of data from the National Practice Benchmark report2–7 and, on the basis of that analysis, made four predictions about what we would see when we completed the 2012 report on 2011 data. These were (1) the squeeze on operating margins would persist; (2) no new efficiency gains would be evident, (3) service delivery measures would remain at 2010 levels, and (4) labor costs would rise faster than revenue. We made those predictions with a ready acknowledgment of the limitations that are inherent in the survey methodology: practices self-select each year for survey participation, we adapt the survey instrument each year to new market conditions, and we reject data that are implausible or obviously incorrect. These limitations are in addition to the fact that the total number of practices in the delivery system is not known, and therefore we do not know the proportion of the sample size relative to the total. Even with these limitations, however, these data provide insight into this market. The 2012 survey is now complete, and we can see that our predictions were accurate in direction but not always in degree. In this article, we review last year's predictions, add a few new predictions, and make some observations on the viability of the community oncology delivery system.
We believe that it is helpful to think of all economic systems, including the oncology service delivery system, as similar to biologic ecosystems.8,9 In this context, the complexity of the reaction of many health care providers operating in very different market conditions and practice models can be glimpsed, the complexity of adaptation can be appreciated, and the remarkable resiliency of the market can be appreciated. The National Practice Benchmark (NBP), though a vast simplification of the ecology of the cancer care delivery system in the United States, offers the opportunity to quantify market forces that affect the economic ecology community and are in turn shaped by the responses of the community to these changes.
When an ecosystem is stressed, the opportunity for change increases. In fact, with enough stress, change becomes inevitable. In an ecosystem, there are three characteristics that define how and how fast change occurs: change is orderly and directional, it results from adaptation by the community to changes in the environment, and it progresses to a stable state in which symbiotic relationships coexist at the most efficient level of energy use.10
The NPB reveals a process of change that is reasonably orderly and predictable, and demonstrates that the adaptation of the oncology community is directional, moving toward gains in efficiency as assessed by a variety of measures. We believe that the overall trends are predictable though the survey methodology and sample size necessarily lead to data that are “bumpy” from year to year. The modification of the environment by the community is revealed in many ways, large and small. One of the most recognizable environmental changes was in the reimbursement for drugs that resulted in reduced net drug revenue to physicians. That single change ended the period of stabilized ecosystem that followed the shift in chemotherapy administration from the hospital to the office. This caused practices to increase productivity and improve the efficiency of drug inventory management. Adaptation is continuing as our industry seeks a “new normal.”
2011 Prediction 1: The Squeeze
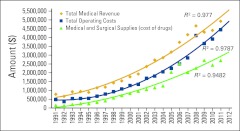
Last year, we predicted that the “squeeze,” defined as the narrowing difference between operating cost and total medical revenue, would continue a decreasing trend traceable back to 2008 and would decrease again in 2011. We predicted total medical revenue per full-time equivalent hematology-oncology physician (FTE HemOnc) of approximately $4.9 million, with operating costs of approximately $4.5 million. Adding the 2011 data to the trend tracker, shown in Figure 1, we see $4.9 million in revenue and $4.4 million in operating cost. The “squeeze” has turned into the “ease” in 2011. Looking to the future, our trend analysis predicts a stable difference between revenue and cost in 2012.
Figure 1.
Oncology Metrics trend tracking of revenue, costs, and drug margins per full-time equivalent hematologist/oncologist (FTE HemOnc), 1991 to 2011.
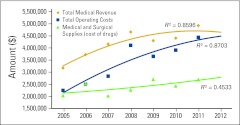
Many would observe that the oncology business environment was markedly different before passage of the Medicare Modernization Act and that the years from 1991 to 2004 should be left out of the trend analysis because they impart a false sense of stability to the overall projection. The same trends data, limited to the years 2005 to 2011, are presented in Figure 2. When presented without the stable years from 1991 to 2004, the “ease” is still observed, but it looks far less assuring. The increase in total operating cost nearly offsets the increase in revenue. Because there is a positive margin on drugs, when we see drug cost increase we expect to see revenue increase more than the increase in cost. Drug costs (green line) do not appear to explain all of the top line revenue increase but still contribute a substantial percentage. It is clear that we need to explore a bit further to see what is driving this observed increase in revenue.
Figure 2.
Oncology Metrics trend tracking of revenue, costs, and drug margins per FTE HemOnc, 2005 to 2011.
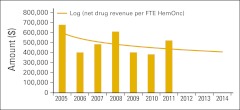
Net drug revenue, defined as total drug revenue less cost of drugs, increases the cash available to operate the practice without any additional direct cost. This makes it a powerful driver of overall revenue in every oncology practice and correlates well with overall practice viability. In Figure 3, we see that the net drug revenue per FTE HemOnc was lower in 2010 than it had been in any preceding year in the data. In 2011, that trend reversed, adding important operating cash to the bottom line. Note that we have applied a logarithmic trend line, which decreases the influence of year-to-year variability, in this figure and those that follow.
Figure 3.
Net drug revenue per FTE HemOnc.
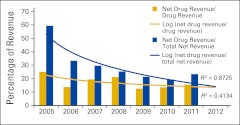
Trends in net drug revenue and the percentage contribution it makes to total net revenue, defined as total revenue less cost of drugs, are seen in Figure 4. In these data, we see a steady decrease of the percentage contribution of net drug revenue to top line net revenue, shown by the gold line, from a high of almost 60% in 2005 to approximately 20% in 2010 and 2011. The blue line shows a corresponding reduction in drug margin as a percentage of drug cost in the same period. Both of these were higher in 2011 than in 2010. So here is the cause of the ease: slightly higher drug margins on higher drug volume.
Figure 4.
Net drug revenue as a percentage of total drug revenue and total net revenue, per FTE HemOnc.
The respective R2 values shown in Figure 4 reflect the relative poor ability of the NPB survey data to predict results for cost of drugs and drug revenue. We believe that these data reflect variations among survey participants rather than a fundamental trend toward higher margins and a greater percentage of revenue attributable to drug margin. But it may be that we are reaching a new relatively stable balancing point of drug margin and drug volume. As we saw in the wake of the shift from average wholesale price to average sales price reimbursement for drugs, payment reform is powerfully disruptive, and at the time of this writing, that reform seems certain, though its timing is not predictable. Before, during, and after that reform, we stand by our statement from last year's trend analysis that drugs will continue to be a part of successful oncology practices.
So to remain successful, oral oncolytics must become part of the pharmacy program for the practicing oncologist because so many important new drugs are formulated for oral administration. This opens the door for a new definition of the specialty pharmacy and perhaps a new relationship between specialty pharmacy and oncology practices. Generally, specialty pharmacy programs are designed to address drugs and biologics that are high in cost and difficult to manage, and have challenging reimbursement issues. These products often are problematic from all perspectives, including those of manufacturers, prescribers, patients, pharmacies, and payers. Specialty pharmacy programs evolved to address these issues by focusing on improving the access, delivery, disease state management, and financial support associated with these agents. Originally, specialty pharmacy could best be defined as a “cottage industry” that sprang up to support pharmacy benefit managers as they struggled with the management of increasingly high-cost agents. “There is tremendous change both in and around the market (ie, new drugs), particularly in oncology, personalized medicine and genomics, a more integrated approach to patient care with medical home and accountable care organizations, and integrated patient care facilitated by electronic health records.”11 Specialty drugs for cancer are market leaders for specialty pharmacy, and industry forecasters predict that biotech products targeting cancer will be among the top 10 selling pharmaceuticals in 2016.12 A June 2011 article published in Managed Care stated, “Overall, cancer drugs constitute 47% of the specialty drug pipeline, with about 125 drugs in phase 3 clinical development for cancer, 38 of which are oral medications.”13 Community oncology is well positioned to add value in this developing treatment modality. In future benchmarking studies, we will monitor this trend. This leads to a new prediction for 2013 and beyond: the management of oral oncology drugs will grow and become part of the pharmacy business unit, supported by electronic medical records for management of companion diagnostics and patient compliance.
2011 Predictions 2 and 3: Efficiency and Service Delivery
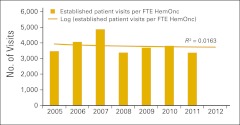
Last year, we predicted a leveling off of gains in practice efficiency. In prior years, we noted that the chief contributor to observed gains in economic efficiency was the freeing up of capital in accounts receivable and drug inventory. We believe that the FTE HemOnc is the rate-limiting resource in oncology practice. That is to say, when the work output of the HemOnc goes up, all the other supporting assets of the practice are made more efficient because they are predominately fixed costs. With that in mind, patient visits per FTE HemOnc (Figure 5) is a reasonable proxy for overall practice efficiency. Consistent with the data from the 2011 report on 2010 data, we see no change in the number of patient visits per FTE HemOnc and again predict no significant increase in 2013.
Figure 5.
Number of patient visits per FTE HemOnc.
A more direct measure of HemOnc work production is achieved by using physician work relative value units (wRVUs). The American Medical Association (AMA) formed the AMA/Specialty Society Relative Value Scale Update Committee, which makes recommendations to the Centers for Medicare & Medicaid Services on the relative values to be assigned to new and revised codes in the Current Procedural Terminology.14 All procedures that involve a physician work component have a wRVU value that is set by the RUC and used by Medicare and many other payers in setting reimbursement. These wRVUs can be measured for each HemOnc and are comparable across many different practice environments. In addition, they can be measured for each HemOnc across all services or for specific areas of work production.
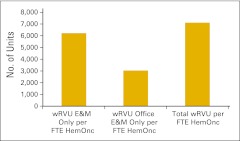
Figure 6 presents several wRVU benchmarks for 2011. Going forward, we intend to use wRVUs to track practice efficiency and productivity. Practices vary in their ability to report this metric, depending on their practice environment and business structure. A typical physician-owned practice should be able to track and measure total wRVUs for all procedures. This generally includes wRVUs attributed to evaluation and management (E&M) services in both the office and hospital settings, chemotherapy administration services, procedures, and any other service with a physician work component. In 2011 the average wRVU per FTE HemOnc was 7,000, as noted in Figure 6. We have established that as the standard production for a full-time HemOnc. We have also reported wRVU for practices in settings where only E&M wRVU can be measured and reported, as is the case in some hospital-owned or academic-based oncology practices. Figure 6 shows an average of just over 6,000 wRVUs per FTE HemOnc for E&M services delivered in both the hospital and office, and 3,000 wRVUs for E&M services delivered only in the office setting.
Figure 6.
Work relative value units (wRVUs) per FTE HemOnc in 2011. E&M, evaluation and management.
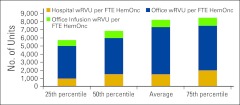
The data in Figure 6, showing a difference of about 3,000 wRVUs for E&M codes provided in the hospital as compared with those in the office setting, are based on a blend of all survey participants and represent practices in all settings. Figure 7 shows a subset analysis of members of the Oncology Circle, a peer-to-peer benchmarking cooperative of practices from across the United States, and participants in the National Practice Benchmark survey. In this subset of practices that are office based, we see about 1,500 wRVUs produced in the hospital setting; 5,800 in the office, which here includes procedures as well as E&M services, and approximately 800 is attributable to infusion services. The 50th percentile of the Oncology Circle practices is about the same as the average of the National Practice Benchmark survey participants while the Oncology Circle average is higher. There are certainly practices in both groups that are producing wRVU per FTE HemOnc significantly above the 7,000 that we have adopted as the standard. This fact suggests that further productivity gains are both possible and perhaps inevitable as greater efficiency is demanded by market conditions.
Figure 7.
wRVUs per FTE HemOnc in Oncology Circle practices, 2011.
2011 Prediction 4: Labor, Cost, and Revenue
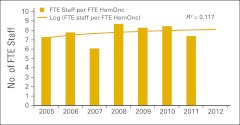
As noted in Figure 5, there was no gain seen in the number of patient visits per FTE HemOnc in 2011. Further, as is seen in Figure 8, the number of FTE staff per FTE HemOnc, though down in 2011, remains relatively stable for all but one year since 2005.
Figure 8.
FTE staff per FTE HemOnc.
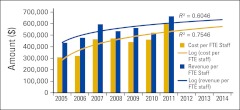
Last year we looked at revenue and cost trends through 2010 and presented a second-order polynomial trend line that predicted that the amount of the positive difference between practice cost per FTE staff and practice revenue per FTE staff would shrink in 2011, and that the lines would cross in 2012. However, when the 2011 data were added—and we represent the trend line using a log fit, which decreases the influence of year-to-year variability as mentioned earlier—a much more favorable future is predicted, as seen in Figure 9.
Figure 9.
Practice cost and practice revenue per FTE staff.
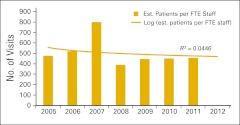
Patient visits drive the demand for clinical support staff. In the years 2005 through 2010, the data showed a decreasing number of patient visits per FTE staff with growing numbers of staff per FTE HemOnc. In Figure 10, we see that the downward trend in the number of patient visits per FTE staff is not supported and that this trend appears stable for the past 3 years at approximately 450 patient visits per FTE staff per year.
Figure 10.
Number of patient visits per FTE staff. Est., established.
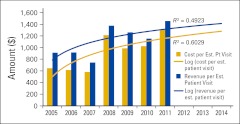
The trends in total practice cost and revenue per established patient visit are unchanged from 2010, as seen in Figure 11. The projection is for a moderately declining positive difference between cost and revenue per established patient over the next 3 years.
Figure 11.
Practice cost and practice revenue per established patient visit.
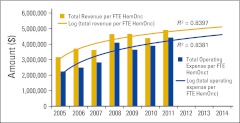
Whereas we measure margin per established patient visit, business viability comes down to operating margin per FTE HemOnc, at least in practices where the HemOnc is also the practice owner (Figure 12). The gap between total revenue and total practice expense is the money left over after all the bills are paid. From this sum, three checks need to be written. One is to the HemOnc physician as salary for the clinical services that were provided throughout the year. Another is to the business owner (typically the HemOnc physician) as a return on the investments made in the practice and for the risk associated with owning and operating a business. The third is to make investments in the business in order to keep it viable. Our projection is that this margin, though narrowing, is not shrinking as was predicted in the 2010 data.
Figure 12.
Total revenue and total operating expense per FTE HemOnc.
2012 New Prediction: Practice Business Structure
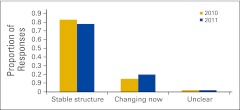
As discussed in the Introduction, stress spurs change. There is ample objective evidence of stress in the NPB data, as well as subjective anecdotal evidence about practices migrating to the hospital and clinics closing. In this article, we present two data points that provide an objective view into business structure change in the oncology delivery system. Figure 13 shows the answer, expressed as a percentage of the number of FTE HemOncs in the business organizations, to the question, “How long do you expect your current business structure to remain unchanged and viable?”
Figure 13.
Responses to question “How long do you expect your current business structure to remain unchanged and viable?”
Although this percentage remained the same in 2011 as 2010 for those unsure or unclear about the business structure, the percentage involved in change increased by 5% in 2011. And the number that remain confident that their business structure will remain unchanged for at least 3 to 5 years remains quite high. It appears that cautious optimism may be the overall mood of these survey respondents. We predict a continued slow but steady change in business structure, but not a wholesale shift in structure on a national basis.
Summary
Readers of the 2012 survey may reasonably have a sense of optimism as they reflect on the amazing resiliency and adaptability that allow this system to positively respond to stress. Time and time again, spanning back to our first survey in 2005, we have quantified the results of oncology practices getting the job done when the rules change.
Others may equally reasonably say “yes, but,” based on the correct observation that there is a fine line between a practice “making it” and not. In the present reimbursement ecology, making it requires careful attention to the business within the business: the wonderful (but expensive) drugs that are used to provide quality care. These drugs now include oral medications, and they are increasingly part of this business operation. You can do everything else right and still struggle if that component of the business is not perfect. There are many examples of economies that experienced epic failures, resulting in widespread business failure.15 Environmental change and the accompanying failure to react in time are the hallmarks of such disasters. So far, so good for the oncology delivery system, but new challenges are inevitable.
Authors' Disclosures of Potential Conflicts of Interest
Although all authors completed the disclosure declaration, the following author(s) and/or an author's immediate family member(s) indicated a financial or other interest that is relevant to the subject matter under consideration in this article. Certain relationships marked with a “U” are those for which no compensation was received; those relationships marked with a “C” were compensated. For a detailed description of the disclosure categories, or for more information about ASCO's conflict of interest policy, please refer to the Author Disclosure Declaration and the Disclosures of Potential Conflicts of Interest section in Information for Contributors.
Employment or Leadership Position: Thomas R. Barr, Oncology Metrics, a division of Altos Solutions, Inc. (C); Elaine L. Towle, Oncology Metrics, a division of Altos Solutions (C) Consultant or Advisory Role: None Stock Ownership: None Honoraria: None Research Funding: None Expert Testimony: None Other Remuneration: None
Author Contributions
Conception and design: All authors
Administrative support: All authors
Collection and assembly of data: All authors
Data analysis and interpretation: All authors
Manuscript writing: All authors
Final approval of manuscript: All authors
References
- 1.Barr TR, Towle EL. Oncology practice trends from the national practice benchmark, 2005-2010. J Oncol Pract. 2011;7:268–290. doi: 10.1200/JOP.2011.000389. [DOI] [PMC free article] [PubMed] [Google Scholar]
- 2.Barr TR, Towle EL. National oncology practice benchmark: An annual assessment of financial and operational parameters—2010 report on 2009 data. J Oncol Pract. 2011;7(suppl):2s–15s. doi: 10.1200/JOP.2011.000223. [DOI] [PMC free article] [PubMed] [Google Scholar]
- 3.Towle EL, Barr TR. National practice benchmark: 2010 report on 2009 data. J Oncol Pract. 2010;6:228–231. doi: 10.1200/JOP.000121. [DOI] [PMC free article] [PubMed] [Google Scholar]
- 4.Towle EL, Barr TR. 2009 national practice benchmark: Report on 2008 data. J Oncol Pract. 2009;5:223–227. doi: 10.1200/JOP.091017. [DOI] [PMC free article] [PubMed] [Google Scholar]
- 5.Barr TR, Towle EL, Jordan WM. The 2007 national practice benchmark: Results of a national survey of oncology practices. J Oncol Pract. 2008;4:178–183. doi: 10.1200/JOP.0843501. [DOI] [PMC free article] [PubMed] [Google Scholar]
- 6.Akscin J, Barr TR, Towle EL. Benchmarking practice operations: Results from a survey of office-based oncology practices. J Oncol Pract. 2007;3:9–12. doi: 10.1200/JOP.0712504. [DOI] [PMC free article] [PubMed] [Google Scholar]
- 7.Akscin J, Barr TR, Towle EL. Key practice indicators in office-based oncology practices: 2007 report on 2006 data. J Oncol Pract. 2007;3:200–203. doi: 10.1200/JOP.0743001. [DOI] [PMC free article] [PubMed] [Google Scholar]
- 8.Hammerstein P, Hagen E.H. The second wave of evolutionary economics in biology. Trends Ecol Evol. 2006;20:11. doi: 10.1016/j.tree.2005.07.012. [DOI] [PubMed] [Google Scholar]
- 9.Rothschild M. New York, NY: Henry Holt and Company; 1990. Bionomics: Economy as an Ecosystem. [Google Scholar]
- 10.Odum EP. The strategy of ecosystem development. Science, 1969;164:262–270. doi: 10.1126/science.164.3877.262. [DOI] [PubMed] [Google Scholar]
- 11.Jorgenson JA. Specialty pharmacy: Status and future direction. http://www.ajpblive.com/media/pdf/AJPB_10nov_Jorgenson_347to348.pdf.
- 12.Correia RJ. Oral oncology therapies: Specialty pharmacy's newest challenge. http://specialty.pharmacytimes.com/publications/specialty-pharmacy-times/2011/May-2011/Oral-Oncology-Therapies-Specialty-Pharmacys-Newest-Challenge-
- 13.Managed Care. Cancer drug category facing 34% to 42% growth. http://www.managedcaremag.com/archives/1106/1106.news_cancerdrugs.html.
- 14.American Medical Association. Overview of the RBRVS. [Accessed June 21, 2012]. http://www.ama-assn.org/ama/pub/physician-resources/solutions-managing-your-practice/coding-billing-insurancE&Medicare/the-resource-based-relative-value-scale/overview-of-rbrvs.page.
- 15.Diamond J. Collapse. New York, NY: Viking Penguin Group; 2005. [Google Scholar]


