

Abstract
Enzymes of the de novo purine biosynthetic pathway may form a multienzyme complex to facilitate substrate flux through the ten serial steps constituting the pathway. One likely strategy for complex formation is the use of a structural scaffold such as the cytoskeletal network or subcellular membrane of the cell to mediate protein–protein interactions. To ascertain whether this strategy pertains to the de novo purine enzymes, the localization pattern of the third purine enzyme, glycinamide ribonucleotide transformylase (GAR Tfase) was monitored in live Escherichia coli and mammalian cells. Genes encoding human as well as E. coli GAR Tfase fused with green fluorescent protein (GFP) were introduced into their respective cells with regulated expression of proteins and localization patterns monitored by using confocal fluorescence microscopy. In both instances images showed proteins to be diffused throughout the cytoplasm. Thus, GAR Tfase is not localized to an existing cellular architecture, so this device is probably not used to concentrate the members of the pathway. However, discrete clusters of the pathway may still exist throughout the cytoplasm.
The de novo purine biosynthetic pathway produces purines that are essential for many cellular processes. Purines serve as the building blocks for DNA and RNA synthesis, as an energy source for chemical reactions (ATP), in cellular redox reactions (NADH, NADPH, FAD, etc.), and as signaling molecules in various regulatory pathways (cAMP) (1). Because cancer cells require large amounts of purines to sustain their accelerated growth, the de novo purine biosynthetic pathway has attracted considerable attention as a target for cancer chemotherapy (2). Purine biosynthesis is a ten-step enzymatic pathway that involves the conversion of phosphoribosylpyrophosphate to inosine monophosphate (IMP; Fig. 1). IMP contains an intact purine nucleus, which serves as the precursor for adenosine and guanosine monophosphate formation. The two folate-requiring reactions, glycinamide ribonucleotide transformylase (GAR Tfase) and aminoimidazole ribonucleotide transformylase (AICAR Tfase), have attracted particular attention because some of the most successful anticancer drugs to date have been folate antimetabolites such as methotrexate (3). These two enzymes carry out similar chemistry in catalyzing the transfer of a formyl group from 10-formyltetrahydrofolate to the amino group of the substrates GAR and AICAR to form fGAR and fAICAR. Investigators have invested their efforts in understanding the mechanisms of the two transformylases with the express purpose of rationally designing inhibitors that specifically target them, and in so doing disrupt purine biosynthesis (4–8). These and other purine enzymes may function in concert as a multienzyme complex, thus providing another target for chemotherapeutic intervention. Disruption of the complex with concomitant inhibition of the growth of cancerous cells would introduce an alternative approach to antineoplastic treatment.
Figure 1.

The de novo purine biosynthetic pathway. It is a ten-step pathway involving the conversion of phosphoribosylpyrophosphate to inosine monophosphate. All substrates and intermediates in the pathway are labeled. The third step is catalyzed by the enzyme glycinamide ribonucleotide transformylase (GAR Tfase). This enzyme is monofunctional in E. coli, but exists as part of a trifunctional protein in mammalian cells. The three activities that are condensed are GAR Tfase, GAR synthase, and AIR synthase. The latter enzymes catalyze step 2 and step 5 of purine biosynthesis. Aminoimidazole ribonucleotide transformylase (AICAR Tfase) catalyzes step 9 and exists as a bifunctional, condensed with the tenth activity of the pathway inosine monophosphate (IMP) cyclohydrolase from E. coli to humans. AICAR Tfase uses the same 10-formyltetrahydrofolate cofactor as GAR Tfase.
In the last 20 years examples have been found of sequential enzymes, which operate within a metabolic pathway, interacting with each other to form highly organized complexes (9, 10). Among the mitochondrial enzymes of the Krebs tricarboxylic acid cycle, interactions occur between six of the eight sequential enzymes. Moreover, it has been shown that all of these enzymes bind to the inner surface of the mitochondrial inner membrane, whereas purified isozymes from other cellular compartments do not possess such binding ability (11). Organized enzyme complexes may possess several kinetic advantages for the cell (12, 13). One possible advantage is in preventing intermediates from escaping into solution where sequestration may occur by other enzymes for use in different metabolic pathways. A second is the proximity of consecutive enzymes of a metabolic pathway that may serve to increase the metabolic flux through this pathway, especially by channeling the substrate at reduced bulk substrate concentration.
However, methodological problems are often encountered in demonstrating the in vitro existence of such intermediate channeling within enzyme–enzyme complexes as has been the case for purine biosynthesis (14). First, many of these interactions between enzymes are relatively weak, and isolation of their complexes from cells is difficult because during the isolation procedure (gel filtration, affinity chromatography) dilution effects or changes in the ionic strength will tend to dissociate the complexes. Different strategies have been used to obtain evidence for the proximity of active sites of consecutive enzymes and to assess the possible kinetic advantages of such an arrangement in several metabolic systems. Datta et al. (15) showed channeling of oxaloacetate (OAA) between mitochondrial malate dehydrogenase (mMDH) and citrate synthase (CS) in a polyethylene glycol precipitate of the two enzymes by using aspartate aminotransferase (AAT) as a trap for the intermediate OAA. Their results indicated that OAA is channeled between mMDH and CS, because large amounts of AAT are unable to trap OAA in the precipitate of the CS and mMDH. Another approach has been the use of genetic fusions of consecutive enzymes to approximate the molecular crowding of intracellular conditions. For instance, recent experimental work of Lindbladh et al. (16) on connecting yeast mitochondrial CS and MDH via a short linker sequence into a fusion protein provided channeling of OAA between the two active sites. The glycolytic pathway is another metabolic pathway that has been intensively studied. Kinetic evidence failed to elucidate the existence of a metabolon. However, Pagliaro and Taylor (17, 18) showed that the aldolase enzyme localizes in vivo to the cytoskeletal matrix, which may act as a structural scaffold to mediate protein–protein interactions between aldolase and other glycolytic enzymes. We adopted a similar in vivo approach for studying the locus of the GAR transformylase enzyme in Escherichia coli and mammalian cells.
There is circumstantial evidence for proposing the existence of a purine complex, such as the clustering of nonsequential activities onto single polypeptide chains (19), the unstable nature of some of the pathway intermediates (14, 20), and the copurification of the two transformylases (21). In mammals and birds the second, third, and fifth activities are all fused within the same polypeptide chain, whereas in E. coli the activities all exist as discrete proteins. It is possible that the fourth activity noncovalently associates with the trifunctional protein. Moreover, the Rosetta Stone Hypothesis (22), which is based on a computational method, postulates that the second, third, and fourth activities in E. coli may associate noncovalently to reconstitute or mimic the human trifunctional protein. Substrate channeling may occur via multienzyme complexes to protect and rapidly process reactive species such as the unstable phosphoribosylamine product of the first reaction (14), and the carbamate generated when aminoimidazole ribonucleotide (AIR) is converted into carboxy-AIR (20).
It is highly possible that the purine enzymes therefore use a structural scaffold or subcellular membrane to mediate protein–protein interactions, as was evidenced for the glycolytic enzyme aldolase (18). To probe for this strategy, green fluorescent protein (GFP) was used to label the human and E. coli GAR Tfase. The cellular localization patterns of the cells were monitored by using confocal fluorescence microscopy. GFP is an intrinsically fluorescent protein and conveniently does not require the addition of any exogenous substrates (23, 24).
Materials and Methods
Materials.
Restriction enzymes were purchased from either New England Biolabs or Promega; T4 DNA ligase, Calf Intestinal Alkaline Phosphatase, DNA polymerase I Klenow fragment, and Polynucleotide Kinase were from New England Biolabs. N10-formyl-5,8-dideazafolate (fDDF) was bought from the John Hynes Laboratory and GAR was synthesized as described (5). G-75 resin was from Sigma, Q-Sepharose resin from Amersham Pharmacia, and nickel-nitrilotriacetic acid from Qiagen (Chatsworth, CA). dNTPs were from Boehringer Mannheim. pET22(b) was obtained from Novagen and pCI-Neo from CLONTECH. An Advantage GC DNA PCR Kit was purchased from CLONTECH. IPTG (isopropyl β-D-thiogalactoside) was from Alexis Biochemicals (San Diego, CA). All materials for making bacterial media were purchased from Fisher or Difco. Trypsin-EDTA, FBS, 1× penicillin-streptomycin-fungicide (PSF), and G418 were purchased from GIBCO/BRL. All protein gel electrophoresis agents and kaleidoscope molecular weight markers were obtained from Bio-Rad. Polyclonal rabbit anti-GFP antibodies were from Molecular Probes, goat anti-rabbit IgG (H + L) conjugate with alkaline phosphatase was from Bio-Rad. BCIP (5-bromo-4-chloro-3-indoyl phosphate) and NBT (nitroblue tetrazolium) were from Sigma. All other biochemical reagents were from either Sigma or Fisher.
Purification of GFP, E. coli GAR Tfase, and E. coli GAR Tfase-GFP.
The plasmids, pLTG82 (E. coli GAR Tfase-GFP) and pMSW2 (E. coli GAR Tfase) (25), were transformed into CaCl2 competent BL21(DE3) cells, grown in 2 l of LB at 30°C (37°C for GAR Tfase) until an OD600 of 0.6 was attained. Protein expression was then induced with 100 μM IPTG for 3 h. The proteins were purified to 95% homogeneity as determined by SDS/PAGE, using the protocol for wild-type GAR Tfase (25). N-terminal His-tagged GFP was expressed from the pRSETB vector (generous gift from Klaus Hahn, The Scripps Research Institute, La Jolla, CA) and purified by using Ni-NTA chromatography.
Construction of the GAR Tfase-GFP Gene Fusion.
A cloning vector was constructed by replacing the multiple cloning site (MCS) of pUC19 with a customized polylinker containing the restriction sites: NdeI, XhoI, EcoRI, BamHI, SacI, and HindIII. To ensure that NdeI was unique, an NdeI site 183 bp upstream of the native pUC19 MCS was removed before insertion of the polylinker. The polylinker (made by annealing two separate strands: A, 5′-AATTGCATATGGGCCAGTAGCTCGAGGCAAGTACTGGTTCGAATTCAGGGGATCCCAGGAGCTCGGCA-3′, and B, 3′-CGTATACCCGGTCATCGAGCTCCGTTCATGACCAAGCTTAAGTCCCCTAGGGTCCTCGAGCCGTTCGA-5′) was ligated into EcoRI/HindIII-digested pUC19. The new plasmid was designated pLTG19. GFP's internal NdeI site was removed and the PCR-amplified gene was subcloned into the EcoRI/HindIII-digested pLTG19 to give pLTG20. The E. coli purN gene was then amplified from pMSW2 by using a forward primer and a reverse mutagenic primer that converts the stop codon to an XhoI restriction site. The purN was then cloned into the NdeI and XhoI site of pLTG20 to generate pLTG21. This procedure placed the GFP gene on the 3′ end of purN. The entire fusion construct was subcloned between the NdeI and HindIII sites of the pET22(b) expression vector to give pLTG82.
Integration of GAR Tfase-GFP into E. coli Genome.
The method of Hamilton et al. (26) was used, and as such entailed use of a plasmid, pMAK705, possessing a temperature-sensitive origin of replication in conjunction with a bacterial host, JM105, that has functional recA. This plasmid carries the gene fusion construct, E. coli GAR Tfase-GFP–uracil phosphoribosyltransferase (upp). The upp gene is downstream of purN in the native bacterial genome, and as such drives a recombination event that results in integration of the fusion construct into the genome of JM105. After the integration event the pMAK plasmid no longer possesses the GFP gene and the plasmid is purged from the cell by growing in the absence of chloramphenicol, which is a selectable marker for the plasmid. Integration is ascertained via PCR using primers flanking the GFP gene (data not shown).
Cloning in the Integration Vector pMAK705.
The Upp gene was amplified from JM105 genomic DNA using a BamHI forward and KpnI reverse primers. The primer sequences were as follows. BamHI For: 5′-GCTGCCGACGAGGGATCCCCCCGTAATTAA-3′; KpnI Rev: 5′-GATAATAGAGCAGGTACCGCGTTCGCGAA-3′. The 1300 bp fragment was ligated into the BamHI/KpnI sites of pMAK705. The resultant construct was designated pMAK708. The GAR Tfase purN and upstream purM gene sequences were amplified by PCR from genomic JM105 DNA using an NdeI-XbaI forward primer and a XhoI reverse primer which removes the stop codon from the GAR Tfase gene. The primer sequences were as follows. NdeI-XbaI For: 5-GATCAGCGGCATATGTCTAGATTGTCTGCA-3′; XhoI Rev: 5′-AATTACGGGGCTCGAGCTCGTCGGCAGCGT-3′. The ≈1.38 kb fragment was digested with NdeI and XhoI and ligated into NdeI/XhoI-digested pLTG19. The gene was then subcloned into pMAK708 by digestion with XbaI and BamHI. The resultant vector, pMAK709, was used for the integration experiment.
Cloning the Human Trifunctional GAR Tfase-GFP into a pET-Based Vector.
The fusion construct was generated by digesting pCC15, a pET-based plasmid that contains the trifunctional GAR Tfase gene cloned downstream of the T7 promoter (a generous gift from Carol Caperelli, University of Cincinnati), with NcoI and XhoI and replacing the gene fragment with a PCR-amplified NcoI/XhoI fragment that removes the stop codon. The resultant mutant plasmid was labeled pCC16. The mutagenesis was carried out via standard PCR and the primers used were as follows. NcoI Trif For: 5′-TTGCCGTTGGTGCCATGGAGCGAGATCAGA-3′; XhoI Trif Rev: 5′-GTGAGTCTCTATCTCGAGAAAAAATAGATG-3′. The GFP gene from pLTG82 was flanked on either end by XhoI restriction sites that facilitated easy subcloning of the gene adjacent to or downstream of the 3′ end of the trifunctional GAR Tfase gene. The proper orientation was screened for using HindIII. The final plasmid was designated pCC17.
Cloning Trifunctional GAR Tfase-GFP into a Mammalian Expression Vector.
The fusion construct was cloned into pCI-Neo (CLONTECH). This vector carries the human cytomegalovirus (CMV) immediate-early enhancer/promoter region to promote constitutive expression of cloned DNA inserts in a variety of cell types. The fusion construct was cloned into the pCI-Neo vector by insertion of the GFP sequence first, followed by the trifunctional gene. The GFP was removed from pLTG82 by digestion with XhoI, and then inserted into XhoI/SalI-digested pCI-Neo. SalI and XhoI have compatible ends, therefore the GFP gene sequence can be inserted in either orientation. Gene insertion in the correct orientation will regenerate a XhoI restriction site at only the 5′ end. The correct orientation was screened for using a double NotI/XhoI digest. The 3-kb trifunctional gene was then amplified from pCC17 by using a forward mutagenic primer that incorporates an NheI site at the 5′ end of the gene and a reverse primer that includes the XhoI site at the 3′ end of the gene. The CLONTECH Advantage PCR kit was used to amplify this large gene. The ≈3-kb pair PCR fragment was digested with NheI and XhoI and ligated into these sites in the pCI-Neo-GFP vector. DNA sequencing revealed that there were no mutations of the trifunctional gene when using the modified PCR procedure. The resultant plasmid was designated pTGFP.
Transient Transfection of pTGFP into Cos-7 Cells.
pTGFP and pGFP were transiently transfected into Cos-7 cells by using the CLONTECH CLONfectin transfection kit. Protein expression was determined 48 h after transfections and cells were subsequently imaged.
Stable Transfection.
293 T cells were transfected with pTGFP and pGFP to generate transformants that stably express the proteins of interest. The CLONTECH CalPhos mammalian transfection kit was used to generate the transfectants.
Quantitation of Enzyme Concentrations in E. coli and Fibroblast Cells.
Intracellular enzyme concentrations were determined by activity measurements from crude lysates in comparison with the specific activity of purified wild-type protein. The following equation was used to calculate the in vivo concentrations of the protein of interest, P:
 |
where SA is the specific activity of the protein and DF is the dilution factor, a ratio of the total volume of lysate to the volume used in a 1-ml assay. DF is 6 for JM105 cells, and 2.5 for 293 T fibroblast cells. MWP is the molecular weight of the protein of interest. The volume for E. coli and fibroblast cells are 10−15 liters and 4 × 10⁻¹² liters, respectively.
Enzyme Assay.
The purN GAR Tfase and the GAR Tfase-GFP proteins were assayed at 25°C with the alternate substrate fDDF by monitoring the production of 5,8-dideazafolate (DDF) at 295 nm (ɛ = 18.9 mM−1⋅cm−1) on a Gilford 252 spectrophotometer. The standard assay contained 50 mM Tris⋅HCl at pH 7.5, and 350 μM (α, β)-GAR and 195 μM fDDF. The human trifunctional GAR Tfase was assayed in 0.1 M Hepes at pH 7.5, using 20 μM GAR and 50 μM fDDF. The reaction was initiated by addition of a small volume of enzyme to a 1-ml final volume after a 3 min incubation at 25°C. Specific activity is expressed as μmol of product/min/mg of enzyme. The concentration of the purified protein was determined by a BCA assay method according to the protocol provided by the manufacturer (Pierce).
Spectral Analysis of GFP.
The excitation and emission spectrum of GFP and GAR Tfase-GFP were measured by using a FluoroMax-2 fluorimeter (Instruments SA, Edison, NJ).
Western Analysis.
Western analysis of the integration strains and the stable transfectants were conducted by using rabbit polyclonal anti-GFP antibodies (Molecular Probes). The nitrocellulose membranes were blocked overnight in Tris-buffered-saline (TBS), 3% BSA. Membranes were incubated for 1 h at room temperature, using TBS and primary rabbit anti-GFP antibodies, and washed 3 times for 5 min, using TBST (TBS supplemented with Tween-20). The membrane was then incubated with goat anti-rabbit alkaline phosphatase-linked secondary antibody in TBS-BSA, washed again as before, and then developed with NBT (nitroblue tetrazolium) and BCIP (5-bromo-4-chloro-3-indoyl phosphate).
Functional Complementation.
GAR Tfase auxotrophic MW12 cells [ara Δ (gpt-rpo-lac) thi rbs-221 ilvB2102 ilvH1202 purN′-lacZ+ Y+∷KanR purT] were used. Electrocompetent cells were transformed with the appropriate plasmid and the cell strains were plated on purine-deficient minimal media to confirm enzyme activity in vivo.
Microscopy.
For the bacterial studies, the microscope system used was an Olympus BX 60 (New Hyde Park, NY) equipped with a MicroMax (Princeton Instruments, Trenton, NJ) cooled charge-coupled device camera driven by the METAMORPH software package (Version 4.0 from Universal Imaging, Media, PA). The GFP and phase-contrast images were captured by using a U-MWIB excitation cube unit (Olympus) with a band-pass excitation filter (460–490 nm) and a long pass barrier filter (≥515 nm). Cos-7 and 293 T fibroblast cells were grown on coverslips in DMEM, 7.7% FBS, and 1× penicillin-streptomycin-fungicide (PSF), washed twice with PBS, and placed on the stage of the microscope for imaging. For the mammalian system, the cells were imaged by using an axiovert microscope attached to an LSM 410 confocal microscope (Zeiss), using 488 nm (argon laser), 488 dichroic, and 515–560 nm emission filtration. Under these imaging conditions the low level of punctate autofluorescence represented <10% of the GFP signal.
Results
To assess whether the GFP fusion altered the enzyme's ability to fluoresce, the E. coli GAR Tfase fusion protein was purified and its GAR Tfase activity and GFP spectral properties were compared with the individual unfused proteins. Table 1 lists the comparison of the two proteins. As is evident, the two proteins were essentially unchanged after the fusion. The fusion protein had similar in vitro activity to the wild-type GAR Tfase and was active in vivo as is evident from the positive functional complementation test. The spectral characteristics of GFP in the fusion protein were unchanged. It was then critical to determine whether the fusion protein could be visualized within a live bacterial cell via confocal fluorescence microscopy. The cells were grown in LB at 25°C and induced with 50 μM IPTG. Under these conditions, it was found that the protein was diffuse within the cytoplasm (Fig. 2). In this experiment, very high concentrations of protein were being produced within the cell because of the “all or nothing” inducibility of the T7 promoter and hence may have lead to distribution artifacts. To confirm the validity of this result, another experiment was done in which the fusion construct was integrated under control of the native GAR Tfase bacterial genome by replacing the native GAR Tfase gene with the GAR Tfase-GFP chimera. Because the gene is under the control of the native promoter, physiological concentrations of the GAR Tfase are produced inside the cell (Table 2). The cells were grown in minimal purine-deficient media and harvested at an OD600 nm of 1, washed with 1× PBS, and imaged. The GFP signal was visible above background autofluorescence, and was essentially diffuse throughout the cytoplasm (Fig. 3). This result does not negate the existence of a complex as units of the complex may still exist, diffused throughout the cytoplasm, but it eliminates the formation of the complex mediated by cytoskeletal or membrane elements in the cell. Western analysis confirmed that the intact, full-length fusion protein was produced within the bacterial and mammalian cells (Fig. 4 A and B).
Table 1.
Comparison of unfused GFP and GAR Tfase to GAR Tfase-GFP
| Protein |
In vitro
activity
|
In vivo activity
|
|
|---|---|---|---|
| S.A. of GARTfase | GFP (λex; λem) | Complementation of MW12 cells | |
| GARTfase | 50 | — | + |
| GAR Tfase-GFP | 46 | 489 nm; 508 nm | + |
| GFP | — | 489 nm; 508 nm | — |
SA, specific activity of E. coli GAR Tfase in μmol min−1⋅mg−1. λex and λem, excitation and emission maxima, respectively.
Figure 2.
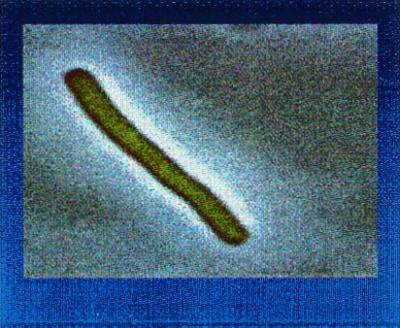
Image of E. coli GAR Tfase-GFP in BL21(DE3). Cells were grown in LB at 25°C, induced with 50 μM IPTG, and imaged with an Olympus BX 60 microscope equipped with a Micromax cooled charge-coupled device camera driven by the METAMORPH software package. Images were captured by using a U-MWIB excitation cube (Olympus) with a band-pass excitation filter (460–490 nm) and a long pass barrier filter (≥515 nm).
Table 2.
Intracellular GAR-TFase and GAR Tfase-GFP concentrations in E. coli and fibroblast cells
| Cell | Media (+ purine rich) (− purine free) | Enzyme assayed | Rate of DDF formation, μmol⋅min−1 | SA of wt GARTfase, μmol min−1⋅mg−1 | Enzyme, μM |
|---|---|---|---|---|---|
| JM105 | + | E. coliGARTfase | 2.1 × 10⁻⁴ | 50 | 1.00 |
| JM105 | − | E. coliGARTfase | 6.3 × 10⁻⁴ | 50 | 3.30 |
| JM105-Integrate | + | E. coliGAR Tfase-GFP | 3 × 10⁻⁴ | 46 | 0.72 |
| JM105-Integrate | − | E. coliGAR Tfase-GFP | 7.7 × 10⁻⁴ | 46 | 2.00 |
| 293 T | + | Human GARTfase | 1.1 × 10⁻⁴ | 2.6 | 0.18 |
| 293 T Stable TGP | + | Human GAR Tfase-GFP | 4.2 × 10⁻⁴ | 2.6 | 0.67 |
All assays were performed in 1 ml. SA, specific activity of wild-type enzyme in μmol min−1⋅mg−1.
Figure 3.

Image of GAR Tfase-GFP Integration Strains. (A) GFP fluorescence image. (B) Phase contrast image of the JM105 integrate strains.
Figure 4.

(A) Western analysis of JM105 integrates. (B) Western analysis of the 293 T stably transfected cells. Westerns were performed by using primary rabbit polyclonal anti-GFP antibodies (Molecular Probes) and secondary goat anti-rabbit alkaline phosphatase linked secondary antibody, and developed with nitroblue tetrazolium (NBT) and BCIP (5-bromo-4-chloro-3-indoyl phosphate). Lane 1 and lane 2 are GAR Tfase-GFP from JM105 integrates and lane 3 is a control using purified S65T GFP. (B) Western analysis from 293 T stably transfected cells. M, kaleidoscope molecular weight markers.
The trifunctional GAR Tfase-GFP protein could not be purified after its expression in E. coli cells because of the formation of insoluble inclusion bodies. However, green fluorescence and GAR Tfase activity were detected in crude lysates of BL21(DE3)pLysS pCC17 cells, suggesting that a properly folded protein could be obtained by directly expressing the fusion in mammalian cells. Cos-7 fibroblast cells were transiently transfected with the pTGFP vector encoding the trifunctional GAR Tfase-GFP fusion. Again the signal was diffused throughout the cytoplasm and was excluded from the nucleus (Fig. 5). This expression, like the expression of the pLTG82 in E. coli cells, may contain distribution artifacts owing to the production of large quantities of protein within the cell. 293 T fibroblast cells were therefore stably transfected with the pTGFP construct. In stable transfections, the levels of GFP fusion protein produced within the cells are substantially reduced and are similar to wild-type levels (Table 2). Once again the signal was found to be diffused throughout the cytoplasm (Fig. 6).
Figure 5.
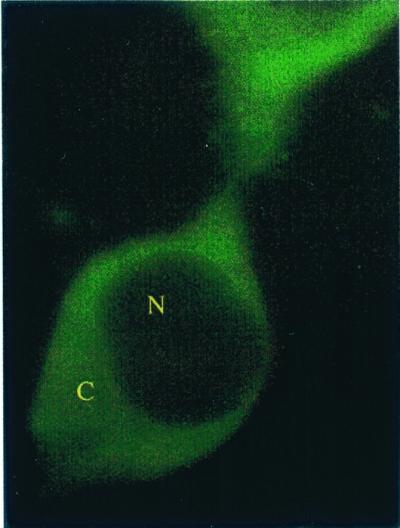
Image of Cos-7 cells transiently transfected with pTGFP. Cells were imaged 48 h after transfection. The cells were imaged by using an axiovert microscope attached to a LSM 410 confocal microscope (Zeiss), using 488 nm (argon laser), 488 dichroic, and 515–560 nm emission filtration. Under these imaging conditions, the low level of punctate autofluorescence represented <10% of the GFP signal. The nucleus and cytoplasm are labeled N and C, respectively.
Figure 6.

Stable trifunctional GAR Tfase-GFP transfectants of 293 T cells. (A) 293 T cells expressing the trifunctional GAR Tfase-GFP. (B) 293 T fibroblasts expressing GFP. Cells were grown on coverslips, washed twice with 1× PBS, and imaged. The nucleus and cytoplasm are labeled N and C, respectively.
Discussion
The uniform cytoplasmic distribution of the GAR Tfase-GFP fusion proteins appears to argue against the presence of a complex localized by any structural or subcellular architecture. Measurement of the in vitro and in vivo activity of the Tfases rule out the possibility of inactivation by the fusion. Western analysis of the fusion proteins by using anti-GFP antibodies also argues against the formation of truncation mutants that maintain catalytic activity. Moreover, the integration of the fusion protein into the bacterial genome, the equivalent concentrations within the cell of the GAR Tfase-GFP fusion proteins (Table 2), and their counterpart wild-type enzymes ensure that the observations are not artifactual. Therefore, the purine enzymes do not appear to use a subcellular membrane or cytoskeletal network to mediate protein–protein interactions, as in the case of the glycolytic enzymes or the mitochondrially bound enzymes of the Kreb's cycle.
Of course, one must also remain aware of the possibility that the placement of the GFP within the fusion protein disrupts its interactions with the matrix. Furthermore, units of the complex may still be present but dispersed throughout the cytoplasm.
The discovery that the mechanism of complex formation differs from that established for other metabolic systems compels one to believe that perhaps some other type of structural scaffold is used. A likely candidate is the fourth purine enzyme, formylglycinamidine ribotide (FGAM). This enzyme is quite large—about 130 KDa, much larger than even the human trifunctional GAR Tfase (106 KDa)—yet it contains only one known enzymatic activity. It is possible that this enzyme serves a dual function in purine biosynthesis and acts as a scaffold protein mediating the interactions between the intervening second GAR Synthase, third GAR Tfase, and fifth AIR Synthase enzymes. Alternately, one must entertain the possibility that a multienzyme complex of the purine biosynthetic enzymes does not form intracellularly.
Acknowledgments
We thank Jennifer Kemp for imaging the bacterial cell strains, Dr. Mark Warren for his help in constructing the original GFP cloning vector, Dr. D. M. Wojchowski for a tutorial in mammalian cell culturing, and Dr. James D. Stevenson for proofreading the manuscript. This work was supported by National Institutes of Health Grant GM 24129
Abbreviations
- GAR
glycinamide ribonucleotide
- Tfase
transformylase
- GFP
green fluorescent protein
- fDDF
N10-formyl-5,8-dideazafolate
- AIR
aminoimidazole ribonucleotide
- AICAR
aminoimidazole ribonucleotide
References
- 1.Warren M S, Mattia K M, Marolewski A, Benkovic S J. Pure Appl Chem. 1996;68:2029–2036. [Google Scholar]
- 2.Elion G B. Science. 1989;244:41. doi: 10.1126/science.2649979. [DOI] [PubMed] [Google Scholar]
- 3.Seeger D R, Cosulich D B, Smith J R, Hultquist M E. J Am Chem Soc. 1949;71:1753–1758. [Google Scholar]
- 4.Inglese J, Johnson D L, Shiau A, Smith J M, Benkovic S J. Biochemistry. 1990;29:1436–1443. doi: 10.1021/bi00458a014. [DOI] [PubMed] [Google Scholar]
- 5.Shim J H, Benkovic S J. Biochemistry. 1998;37:8776–8782. doi: 10.1021/bi980244k. [DOI] [PubMed] [Google Scholar]
- 6.Wall M, Shim J H, Benkovic S J. J Med Chem. 1999;42:3421–3424. doi: 10.1021/jm990323+. [DOI] [PubMed] [Google Scholar]
- 7.Boger D L, Labroli M A, Marsilje T H, Jin Q, Hedrick M P, Baker S J, Shim J H, Benkovic S J. Bioorg Med Chem. 2000;8:1075–1086. doi: 10.1016/s0968-0896(00)00051-1. [DOI] [PubMed] [Google Scholar]
- 8.Boger D L, Marsilje T H, Castro R A, Hedrick M P, Jin Q, Baker S J, Shim J H, Benkovic S J. Bioorg Med Chem Lett. 2000;10:1471–1475. doi: 10.1016/s0960-894x(00)00271-7. [DOI] [PubMed] [Google Scholar]
- 9.Srere P A. Ann Rev Biochem. 1987;56:89–124. doi: 10.1146/annurev.bi.56.070187.000513. [DOI] [PubMed] [Google Scholar]
- 10.Ovadi J. Cell Architecture and Metabolic Channeling. Austin, TX: R. G. Landes; 1985. [Google Scholar]
- 11.Robinson J B, Jr, Srere P A. J Biol Chem. 1985;260:10800–10805. [PubMed] [Google Scholar]
- 12.Welch G R. Prog Biophys Mol Biol. 1977;32:103–191. [PubMed] [Google Scholar]
- 13.Spivey H O, Merz J M. BioEssays. 1989;10:127–130. doi: 10.1002/bies.950100409. [DOI] [PubMed] [Google Scholar]
- 14.Rudolph J, Stubbe J. Biochemistry. 1995;34:2241–2250. doi: 10.1021/bi00007a019. [DOI] [PubMed] [Google Scholar]
- 15.Datta A, Merz J M, Spivey H O. J Biol Chem. 1985;260:15008–15012. [PubMed] [Google Scholar]
- 16.Lindbladh C, Rault M, Hagglund C, Small W C, Mosbach K, Bulow L, Eans C, Srere P A. Biochemistry. 1994;33:11692–11698. doi: 10.1021/bi00205a004. [DOI] [PubMed] [Google Scholar]
- 17.Pagliaro L, Kerr K, Taylor D L. J Cell Sci. 1989;94:333–342. doi: 10.1242/jcs.94.2.333. [DOI] [PubMed] [Google Scholar]
- 18.Pagliaro L, Taylor D L. J Cell Biol. 1992;18:859–863. doi: 10.1083/jcb.118.4.859. [DOI] [PMC free article] [PubMed] [Google Scholar]
- 19.Aimi J, Qiu H, Williams J, Zalkin H, Dixon J E. Nucleic Acids Res. 1990;18:6665–6672. doi: 10.1093/nar/18.22.6665. [DOI] [PMC free article] [PubMed] [Google Scholar]
- 20.Mueller E J, Meyer E, Rudolph J, Davisson V J, Stubbe J. Biochemistry. 1994;33:2269–2278. doi: 10.1021/bi00174a038. [DOI] [PubMed] [Google Scholar]
- 21.Smith G K, Mueller T K, Wasserman G F, Taylor W D, Benkovic S J. Biochemistry. 1980;19:4313–4321. doi: 10.1021/bi00559a026. [DOI] [PubMed] [Google Scholar]
- 22.Marcotte E M, Pellegrini M, Ng H, Rice D W, Yeates T O, Eisenberg D. Science. 1999;285:751–753. doi: 10.1126/science.285.5428.751. [DOI] [PubMed] [Google Scholar]
- 23.Cubitt A B, Heim R, Adams S R, Boyd A E, Gross L A, Tsien R Y. Trends Biochem Sci. 1995;20:448–455. doi: 10.1016/s0968-0004(00)89099-4. [DOI] [PubMed] [Google Scholar]
- 24.Heim R, Cubitt A B, Tsien R Y. Nature (London) 1995;373:6633–6649. doi: 10.1038/373663b0. [DOI] [PubMed] [Google Scholar]
- 25.Warren M S, Marolewski A, Benkovic S J. Biochemistry. 1996b;35:8855–8862. doi: 10.1021/bi9528715. [DOI] [PubMed] [Google Scholar]
- 26.Hamilton C A, Aldea M, Washburn B K, Barbitzke P, Kushner S R. J Bacteriol. 1989;171:4617–4622. doi: 10.1128/jb.171.9.4617-4622.1989. [DOI] [PMC free article] [PubMed] [Google Scholar]