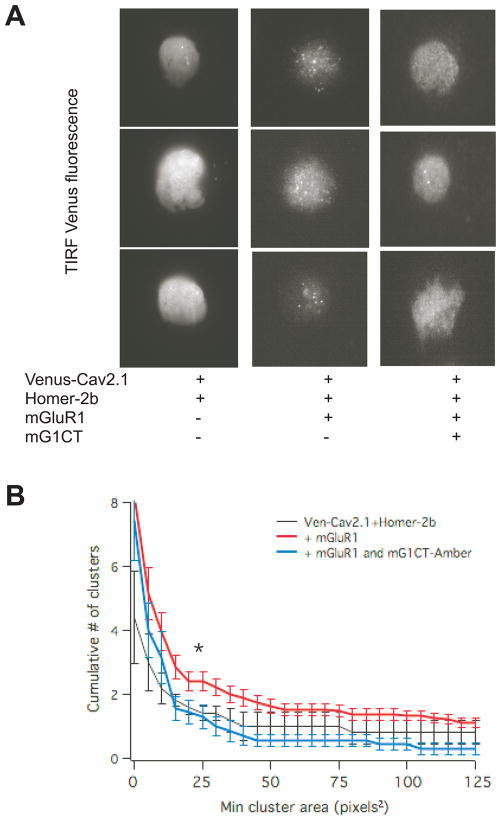
Fig. 6.
Coexpression of mGluR1 and Homer-2b induces Venus-CaV2.1 clustering, which is reduced by expression of an untagged mGluR1-CT construct. A, TIRF fluorescence images showing three sample images each of SCG neurons with the indicated expression. B, Clusters were quantified with a cumulative histogram of cluster number vs. size (in pixels2). * indicates statistically significant difference between the number of clusters in cells expressing Venus-CaV2.1, mGluR1 and Homer-2b (red; n=19) compared to cells also expressing mGluR1-CT-Amber (blue; n=7). Cluster histogram for neurons expressing Ven-CaV2.1 + Homer-2b (n=5) are shown in black. Lines represent average clusters ± SEM at 5 pixels2 bins.

