


Abstract
DNA is subject to large deformations in a wide range of biological processes. Two key examples illustrate how such deformations influence the readout of the genetic information: the sequestering of eukaryotic genes by nucleosomes and DNA looping in transcriptional regulation in both prokaryotes and eukaryotes. These kinds of regulatory problems are now becoming amenable to systematic quantitative dissection with a powerful dialogue between theory and experiment. Here, we use a single-molecule experiment in conjunction with a statistical mechanical model to test quantitative predictions for the behavior of DNA looping at short length scales and to determine how DNA sequence affects looping at these lengths. We calculate and measure how such looping depends upon four key biological parameters: the strength of the transcription factor binding sites, the concentration of the transcription factor, and the length and sequence of the DNA loop. Our studies lead to the surprising insight that sequences that are thought to be especially favorable for nucleosome formation because of high flexibility lead to no systematically detectable effect of sequence on looping, and begin to provide a picture of the distinctions between the short length scale mechanics of nucleosome formation and looping.
INTRODUCTION
In its role as the chief informational molecule of the living world, DNA is subjected to a wide variety of physical manipulations. Examples include the looping events that occur during DNA replication (1,2), bending of DNA during recombination (1,2), the bending and twisting induced by a variety of different architectural proteins such as IHF, H-NS and HU in bacteria (3), the bending induced by the histones responsible for packing the genetic material in eukaryotes (4,5) and the physical rearrangements of genomic DNA induced by transcription factors (1,2,4,6). In fact, one of the most ubiquitous classes of regulatory architecture found in all domains of life is often referred to as ‘biological action at a distance’ where transcription factors bind several sites on the DNA simultaneously, thus looping the intervening DNA (7–9).
Interestingly, many of the biological manipulations experienced by DNA, but especially many cases of ‘action at a distance’ in transcriptional regulation, involve bending and twisting the DNA on length scales that are short in comparison with its natural scale of deformation, that is, the persistence length (6). Eukaryotic DNA is subjected to enormous deformations when packed in nucleosomes, with 147 bp of DNA (already smaller than the persistence length) wrapped one and three-quarters times around the histone octamer (4,5). Similarly, in the context of prokaryotic transcription factor-mediated DNA looping, not only are such lengths the default in naturally occurring transcriptional networks, but the optimal in vivo lengths as determined by the maximal regulatory effect are often at loop lengths smaller than 100 bp (6,10). Despite the clear importance of the short-length-scale mechanical properties of DNA, however, there remains both uncertainty and controversy about the ease with which such short DNAs can be deformed, and also about the role of sequence at these short scales, particularly in the context of protein-mediated bending [reviewed recently in (11,12)].
Here, we exploit insights about DNA flexibility garnered from one class of genetic regulation where it has been studied extensively, that of nucleosome formation, to make predictions about how a different class of mechanical deformations in regulatory biology, that of DNA looping by a transcription factor, will be altered by these same sequences. We test these predictions experimentally with a single-molecule assay in conjunction with ideas from statistical mechanics for the case of one of the most well-known transcriptional regulators in bacteria, that of the Lac repressor, though there are clear implications for other prokaryotic and eukaryotic regulatory motifs as well.
As shown schematically in Figure 1, we have combined tethered particle motion (TPM), in which the Brownian motion of a reporter bead is the readout of the state of its DNA ‘leash’ (13,14), with a statistical mechanical model and the systematic variation of four biologically relevant parameters. The most important of these parameters for the purpose of this study is the flexibility of the DNA in the loop, which is captured in a parameter called the looping J-factor. The looping J-factor is analogous to the cyclization J-factor obtained in the ligation-mediated cyclization assays that are commonly used to measure DNA flexibility at short lengths, and can be thought of as the effective concentration of one end of the loop in the vicinity of the other (15,16), providing a measure of the energetics of bending the DNA into the loop. The approach we have developed here allows us to measure these looping J-factors in a way that provides quantitative insights into how each of the four biologically important parameters we tested affects DNA looping and permits us to contrast the role of sequence in DNA cyclization and nucleosome formation with that of looping. We find that two sequences with significantly different propensities for forming DNA minicircles in in vitro cyclization assays or for forming nucleosomes create a more complicated sequence dependence in the context of DNA loop formation than has been previously appreciated.
Figure 1.

Schematic of the TPM assay. (A) DNA looping is observed as a result of changes in the Brownian motion of the tethered bead (13,14,30): looping decreases the effective length of the DNA tether, which decreases the bead's root-mean-squared (RMS) motion. (B) Four distinct tunable biological parameters varied in the measurements: (i) Repressor binding site, or operator. In this article we use the strong, synthetic ‘Oideal’ (Oid) operator, the strongest naturally occurring O1 operator and the weaker naturally occurring O2 operator. (ii) Loop length. The wild-type lac operon contains three operators, O1, O2, and an even weaker operator O3, which have the potential to generate three loops of different lengths: the 380 bp O1–O2 loop, the 71 bp O1–O3 loop and the 472 bp O2–O3 loop. In our synthetic constructs, we use two operators and systematically tune the distance between them as shown in the figure. (iii) Loop sequence. ‘E8’ refers to a synthetic random sequence, ‘TA’ to a synthetic nucleosome positioning sequence [part of the 601TA sequence (38)]. The TA sequence has a higher cyclization J-factor than E8 and is wrapped into nucleosomes in vitro more readily than E8 (29,33) and (iv) Lac repressor concentration.
MATERIALS AND METHODS
A statistical mechanical model of looping
A key tool for making the measurements presented here is the concentration titration (see Figure 2): by tuning the repressor concentration and measuring the looping probability, we can fit for other parameters that affect looping probability, namely the operator dissociation constants (Kd’s) and more importantly the looping J-factors for different DNA sequences and lengths. Intuitively, at low protein concentrations, the probability of forming a loop is small. Similarly, at high concentrations, the looping probability is low because the two operators are each occupied by separate transcription factors. At intermediate concentrations, the looping state has its highest probability. These intuitions can be captured mathematically by statistical mechanical models that take into account all of the different ways that the operators can be decorated with repressors. These models make very strict predictions about the functional form of the looping probability curves as a function of the various biological parameters.
Figure 2.

Theoretical (A–C) and experimental (D–F) results for the looping probability as a function of operator strength, loop sequence and repressor concentration. In the theoretical predictions of (A)-(C), Kid = 5.4 pM, K1 = 16 pM and Jloop = 54 pM unless otherwise indicated; curves with these default parameters are shown as dashed blue lines for comparison across panels. In the experimental results of (D)-(F), unlike in (A)-(C), curves are fits to Equation 1, not predictions. (A) Theoretical prediction for the effect of changing the strength of one of the operators on the looping probability as a function of repressor concentration. (B) Theoretical prediction for the effect of changing the flexibility of the DNA in the loop. (C) Extension of the simple model to the case of two experimentally distinguishable looped states (see ‘Materials and Methods’ section and the section on loop length), which we model as having different J-factors. The two looped states are labeled ‘middle’ (‘M’) and ‘bottom’ (‘B’) in reference to their relative tether lengths. The dashed blue line shows the sum of the probabilities of the two states, which we refer to as the total looping probability. (D) Measured looping probabilities for 94 bp of the random E8 sequence, flanked by three different combinations of operators. Dashed lines indicate individual fits to each data set as described in Section S4.4 in the Supplementary Data; solid lines indicate a global fit to all the three data sets simultaneously. The global fit, which enforces identical values of the J-factor and O1 dissociation constant in all the three data sets, describes the data as well as the individual fits, demonstrating the consistency of the model when the operators are changed. (E) Looping probabilities for the E8 (black) and TA (red) sequences as function of concentration. The Oid-E894-O1 data are the same as in (D); the dotted black line is the result of the global fit shown in that panel as well. The dashed red line represents an individual fit to the Oid-TA94-O1 data; the solid red and black lines are from a global fit to all three E8 data sets in (D) plus this TA data. (The results of this global fit that includes the TA data for the O1-E894-O1 and O2-E894-O1 data sets are shown in Section S4.4 in the Supplementary Data.) The TA data can be fit with the same Kd values as the E8 data, but have a significantly larger J-factor, or a more flexible sequence. Fit parameters for (D) and (E) are listed in Table 1. (F) Looping probabilities for a DNA with two looped states, Oid-E8107-O1. Curves represent a simultaneous fit of the ‘B’ and ‘M’ data to Equations S6 and S7, using the values of Kid and K1 from the global fit to all three E8 data sets in (D) and the TA data in (E). The procedure for determining the errors on the fit follows the bootstrapping scheme used throughout this work and is described in Section S4.4 in the Supplementary Data. We find that the two looped states differ only in J-factor, as we and others (19,20) assume in our models; that is, the binding affinity of the repressor for operator DNA does not change with the different loop and/or repressor conformations that generate the two observed loop states. Note that the total J-factor of 330 pM obtained from this concentration curve is within error of the J-factor of 280 ± 40 pM determined from only the 100 pM data point shown in Figure 3C; likewise, the J-factors for the two looped states are within error of those determined from the 100 pM data alone (Supplementary Figure S8B).
Our model states that if the operators have dissociation constants Ki and Kii, and the intervening DNA has looping J-factor Jloop, the looping probability ploop will be
 |
(1) |
where [R] is Lac repressor concentration. [See (17) and Section S1 in the Supplementary Data for derivation and details.] Although this model was first derived in our earlier work in (17), as a result of the fact that we here explore the analytic consequences of this model, we consider the results presented here to be the first rigorous and successful test of its applicability to DNA looping experiments and its robustness under numerous experimental variations.
In Equation 1 Jloop is the sum of the J-factors for each of the four possible loop configurations that have different DNA-binding orientations, as well as for any additional loop conformations arising from protein flexibility (diagrammed in the legend of Figure 4). The J-factor depends on the length, phasing and flexibility of the DNA, as well as the precise shape of the looped complex (18–20). In fact, we observe two looped states in almost all of our DNA constructs (see Figure 3B and E), as have other studies with Lac repressor (17,21–26). Modifications to Equation 1 that account for these multiple looped states, as well as for experimental issues which may affect the Kd's and J-factors we report, such as the tetramer-to-dimer dissociation at low repressor concentrations, are discussed in Section S1 in the Supplementary Data. However, Equation 1 is the main workhorse of the paper since we found it to be sufficient to account for the data presented here. Similarly, in Section S5, we note a number of experimental controls that were performed to ensure that the parameters we fit to this model were not affected by the effects of the reporter bead size on loop formation, the large amount of surface area in the TPM sample chamber which could cause a difference between the pipetted and actual concentrations of repressor, or the particular repressor batch used in these experiments.
Figure 4.
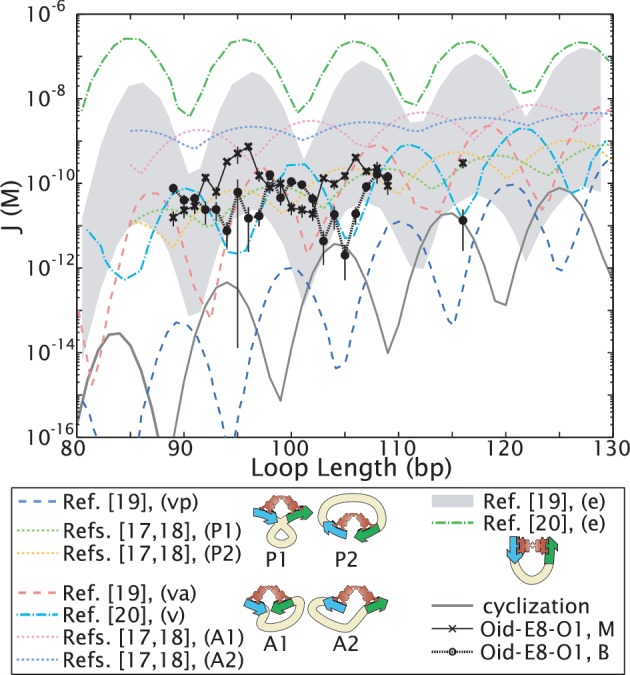
Theoretical predictions of the length dependence of the looping J-factor demonstrate that different assumptions about loop conformation and/or protein flexibility lead to predicted looping J-factors that can differ by orders of magnitude. Elasticity theory with ‘canonical’ values for the stiffness of random DNA sequences, in conjunction with various models of the geometric and mechanical constraints imposed by the Lac repressor tetramer, have been used to compute the looping J-factor (17–20). The model of (17,18) also explicitly includes the boundary conditions of a TPM experiment, with a bead on one end of the DNA and a surface on the other. The assumed constraints can be roughly grouped into V-like repressor conformations, similar to the shape seen in the crystal structure 1LBI (47) [‘P1’ and ‘P2,’ indistinguishable unless as in TPM there are symmetry-breaking boundary conditions, and therefore collapsed into one state, ‘vp,’ in (19); and ‘A1’ and ‘A2,’ collapsed into ‘v’ or ‘va’ in (19,20)]; and more extended repressor conformations (‘e’), which are favored by the DNA mechanics. These conformations are indicated schematically in the legend; for the case of (17,18), the blue operator has been chosen to be Oid, that is, the operator closest to the surface. The prediction for the extended conformation of (19) is a range of values, reflecting estimated uncertainty in the free energy costs of opening the repressor tetramer. Details of how these curves were obtained are given in Section S2 in the Supplementary Data. Our experimental measurements for the two looped states of the no-promoter E8 sequence (‘Oid-E8-O1, M’ and ‘Oid-E8-O1, B,’) as well as the cyclization result of Shimada and Yamakawa (16,17) (‘cyclization’) have been included for comparison.
Figure 3.

Looping probability as a function of loop length at constant repressor concentration. Surprisingly, the sequence dependence of Figure 2E for the 94 bp construct is absent at other loop lengths. However, the bottom panels show data for constructs where 36 bp of either E8 or TA nearest O1 has been replaced with the lacUV5 promoter sequence (and for technical reasons O1 has been replaced with O2, which should not affect our measurements of J-factors as demonstrated by the data in Figure 2D). The presence of this promoter ‘restores’ a sequence dependence to looping across several helical periods. (A) Total looping probability (that is, both looped states summed) for the constructs Oid-E8-O1 and Oid-TA-O1, at 100 pM repressor. The red hatched region represents a prediction for where the TA data should fall, assuming the TA sequence has a J-factor anywhere from 5 to 30 times larger than the J-factor for the E8 sequence [a range based on the cyclization J-factors of (29)]. The lengths used in earlier cyclization assays (29) are a subset of those shown in this figure. (B) Looping probabilities for the two looped states separately (labeled ‘bottom’ (‘B’) and ‘middle’ (‘M’) as in Figure 2C and F) for the constructs in (A). The two states alternate in likelihood: the bottom state predominates near 89 and 100 bp, but the middle state near 94 and 106 bp. It is more clear in this panel than in (A) that E8 and TA are in phase with each other, with a period close to the canonical period of 10 bp, everywhere except near 94 bp, where TA has a maximum that is instead at 95–96 bp for E8. Therefore, a simple offset in phase between the two sequences cannot account for the behavior at 94 bp. (C) Looping J-factors for the constructs shown in (A). The J-factors for both E8 and TA span at least an order of magnitude as a function of loop length, and the J-factors for the two looped states (see Figure 4 and Supplementary Figure S8B) can also differ by an order of magnitude at a given loop length. However, as shown in Figure 4, this degree of modulation by operator phasing is less than might be predicted, depending on the assumptions made about Lac repressor conformation and flexibility. (D) Looping probabilities for constructs where part of the looping sequence of the constructs in (A) has been replaced with the 36-bp lacUV5 promoter. The red hatched region is the same kind of cyclization-based prediction as in (A). In sharp contrast to the data in (A), with the promoter sequence in the loop, TA loops as much or more than E8 at all lengths measured, as would be expected from cyclization and nucleosome formation assays with the pure E8 and TA sequences. Note that because of the replacement of O1 by O2, the looping probabilities for these constructs will not necessarily match those of (A) even when the J-factors for the loops, plotted in (F), are the same. (E) As in (B), here the two looped states have been separated out for the constructs in (D). With the promoter in the loop, the two sequences have the same phasing even at 94 bp [and in fact share the same phasing as the pure E8 constructs in (A)]. Interestingly, the preferred looped state with the promoter is almost exclusively the middle state at all lengths—note for example that at 107 bp without the promoter, the two looped states are comparable in likelihood (see also Figure 2F), but with the promoter at 107 bp only the middle state contributes to looping (see also Supplementary Figure S8D and E). (F) J-factors for the constructs in (D) (open circles), overlaid on the J-factors for the no-promoter E8 construct shown in (C) (grayed-out closed circles). The addition of the promoter to the loop does not appreciably change the J-factors for E8-containing loops, only those the TA-containing loops. See Supplementary Figure S8C for the J-factors of the two states of (E). Solid, dashed and dotted lines in (A), (B), (D), and (E) are guides to the eye only, not theoretical predictions or fits. Their purpose is to highlight general trends. Example bead motion-versus-time trajectories for these constructs can be found in Section S7 in the Supplementary Data, and the effective tether lengths of the two looped states as a function of the loop length, with and without the promoter, are presented in Section S6 in the Supplementary Data.
Lac repressor purification
As discussed in Section S5 in the Supplementary Data, we obtained reproducible TPM results only with Lac repressor purified in-house. We used a protocol modified from one received from Kathy Matthews in May 2009, essentially described in (27). The Escherichia coli lacI− BLIM cells and pJCI plasmid used for the purification were kind gifts from the Matthews lab. After elution from the phosphocellulose column, our protein was found to have a concentration between 1 and 2 mg/ml, using a monomer extinction coefficient of 0.6 (mg/ml)−1cm−1 (28), and was ≥99% pure by SDS-PAGE. In one case, some repressor was also purified over a Superdex 200 10/300 GL size-exclusion column (GE Healthcare) using an AKTA system and eluted as a single peak at a molecular weight corresponding to the expected weight of a LacI tetramer.
DNAs
Plasmids pZS25′ Oid-E/T(89–116)-O1−45-YFP, where ‘E/T(89–116)’ indicates that the sequence of the loop is either from the random E8 sequence or the 601TA sequence from (29) and has a length of 89–116 bp, were constructed by site-directed mutagenesis as described in (17). Jonathan Widom kindly provided the E8 and TA sequences used in (29), which are a subset of those studied here and from which the other E8 and TA lengths were derived. The operator and loop sequences used in this work can be found in Section S3 in the Supplementary Data; schematics of the constructs without the lacUV5 promoter are shown in Figure 1B. QuikChange site-directed mutagenesis (Agilent Technologies) was used to make the operator changes Oid to O1 and Oid to O2, additional loop lengths, and the promoter-containing constructs. Linear labeled DNAs used in tethering assays were created by polymerase chain reaction (PCR) with primers labeled at the 5′ ends with digoxigenin (forward primers) or biotin (reverse primers) (Eurofins MWG Operon); a PCR of the pZS25 plasmid resulted in ∼450 bp tethers. Primer sequences can be found in Table 3 of (17). See Figure 1B for flanking DNA lengths for the no-promoter PCR products; the promoter-containing constructs of Figure 3D–F are identical to the no-promoter constructs shown in Figure 1B, except that the O1 operator closest to the bead was replaced by O2, 36 bp of the loop closest to this O2 operator were replaced by the lacUV5 promoter sequence, and the length of the flanking DNA between O2 and the bead was 139 bp rather than 172 bp.
TPM sample preparation, data acquisition and analysis
Our TPM protocol was essentially that of (17), with the following modifications:
The addition of 0.2% Tween-20 (Sigma) to the TPB buffer that some batches of beads were washed in, to reduce aggregation and non-specific binding.
Unless otherwise indicated, the beads used in this work were 0.49 μm diameter, streptavidin-coated polystyrene beads (Bangs); for some controls in the Supplementary Data, 0.27 μm-diameter beads from Indicia Biotechnology were used instead.
Brightfield microscopy instead of differential interference contrast (the results are equivalent).
A Basler A602f camera was used to acquire images at a native frame rate of 60 frames per second (fps) however, for consistency with previous results from our lab, every other frame was dropped for a final frame rate of 30 fps but an exposure time of 10 ms/frame.
Improvements to the speed of the acquisition code that allowed up to 45 beads to be tracked at once, which corresponds to the maximal tether density obtainable in the field of view of the camera without a significant number of multiply tethered particles.
In addition to the symmetry-of-motion and length-of-motion checks that were used as initial screens for acceptable tethers in (17), data were first acquired for 500s in the Lac repressor (LRB) buffer but in the absence of protein in order to characterize each tether in the unlooped state. Not only does this allow a more rigorous screening of tethers for anomalous behavior (e.g. non-uniformity of tether length over time), but it also records the unlooped length of each individual bead, which allows easier identification of looped states, especially in DNAs with short loops that have high looping probabilities. This must be done on a tether-by-tether basis due to the significant variability of tether lengths that we see, and allows us to observe small differences in tether length in the presence versus absence of looping, which we attribute to operator bending (see Section S6 in the Supplementary Data).
The non-covalent attachments of the DNAs to the surface and to the bead can result in release of the tether from the surface before the conclusion of the experiment (usually about 1.5 h in total). As discussed in more detail in Section S4.2 in the Supplementary Data, beads that broke before 3000 s were excluded from the final analysis so that all trajectories were sufficiently sampled to obtain the equilibrium looping probability, and each data point includes at least 20 beads because fewer beads resulted in unreproducible looping probabilities.
In the case of the 0.49 μm beads, drift was removed as described in (17) by subtracting the results of a low-pass first-order Butterworth filter with a cutoff frequency of 0.05 Hz; for the 0.27 μm beads, the cutoff frequency was 0.07 Hz. Similarly, in the case of the 0.49 μm beads, the root-mean-square motion was obtained by applying a Gaussian filter with a −3 dB frequency of 0.0326 Hz, corresponding to a 4s standard deviation of the filter; but for the 0.27 μm beads, a 0.461 Hz filter was used, corresponding to a 2.8s standard deviation of the filter. A 4s Gaussian filter has a dead time of 5.5 s; the temporal resolution of a TPM experiment is usually taken to be twice the dead time, or in our case, 11 s (24,30,31). The shortest lived states that we observe have average lifetimes of the order of 30 s, which we so far have found to be long enough, compared with the temporal resolution imposed by the filter, as to make corrections for missed events negligible. This issue will be addressed in more detail in a forthcoming paper on the kinetics of looping.
We observe a population of tethers that never loop regardless of DNA construct or repressor concentration, and discarded these tethers from the calculation of the mean looping probability as described in Section S4.3 in the Supplementary Data.
Fits were performed using custom Matlab routines as described in Section S4.4 in the Supplementary Data. Tracking and analysis code is available on request. All data were obtained at 22–24oC. Looping probabilities are reported as means with standard errors; the calculation of looping J-factors and associated errors is described in Section S4.6 in the Supplementary Data.
RESULTS
Effect of repressor concentration and operator strength on looping probability
We first explore how the Lac repressor concentration and its affinity for several known binding sites alter the looping probability, and how these alterations may be used to extract the looping J-factor of the DNA, as well as the repressor–operator dissociation constants. Looping by the Lac repressor has been studied by TPM (17,24–26,30–32), as well as by other single-molecule techniques such as Förster resonance energy transfer (FRET) (21–23), but in all cases only one or a couple loop lengths, operators and repressor concentrations were studied. In many cases, therefore, the repressor–operator dissociation constants were assumed (as opposed to measured) in order for a looping J-factor to be calculated. Here, we describe a new way of measuring both the operator dissociation constants and the relative flexibilities of different DNA sequences as contained in the looping J-factor, by tuning both repressor concentration and operator strengths, with a rigorous comparison between these experiments and theory. We find that the most accurate and logically consistent way of measuring both the J-factors and operator dissociation constants involves a global fit of our model to multiple data sets with different combinations of operators simultaneously.
As described in the ‘Materials and Methods’ section, we can use the tools of statistical mechanics to relate J-factors, operator dissociation constants and transcription factor concentrations to the experimentally observable looping probability through the expression in Equation 1. The main workhorse of our approach to test this statistical mechanical description of looping probability is the repressor concentration curve, where we measure this probability at different repressor concentrations, and then fit Equation 1 to obtain dissociation constants (Kd’s) and J-factors. Equation 1 makes very specific and falsifiable predictions for how these repressor concentration curves should change as the model parameters change. Figure 2 shows a suite of previously untested predictions based upon this statistical mechanical model (as well as the comparison of these predictions to experiment). We consider first the effect of changing the affinity of the repressor for its operators, and in the next section we consider the effect of changing the J-factor.
Figure 2A shows the prediction of our model for how the concentration curves should change as the dissociation constant for one of the operators is varied: changing the strength of one of the operators should change both the concentration at which looping is maximal, and the amount of looping at that maximum, but the curves should overlap at high repressor concentrations. These observations can be formalized by appealing to Equation 1. The concentration at the maximum in the looping probability can be found by differentiating Equation 1 with respect to [R] and results in
| (2) |
Note that the concentration at which the looping probability is maximized does not depend upon the DNA flexibility as captured in the parameter Jloop. The looping probability at this maximum, however, does depend on Jloop, according to
| (3) |
and will, therefore, be discussed in more detail in the next section where our measurements of the J-factors of two different sequences are directly addressed. Finally, we note that at high concentrations, Equation 1 approaches the limit Jloop/(2[R]), which is independent of operator strength, explaining why the curves in Figure 2A overlap at high concentrations. As an experimental consequence, data at low concentrations are essential for determining operator strengths, whereas high concentration data are sufficient for determining J-factors.
Figure 2D shows experimental results for a loop containing 94 bp of a synthetic random sequence called E8, described previously (29,33), flanked by three different combinations of the operators Oid, O1 and O2, which are known to have distinct affinities for the Lac repressor. As predicted by our model, increasing the binding strength of one of the operators (i.e. decreasing the value of one Kd) shifts the maximum of the curve to the left and increases its amplitude: that is, stronger operators allow more looping at lower concentrations. Similarly, since the J-factor is a property of the DNA loop length and sequence, we would expect all three curves to be fit by the same J-factor, and for the fits to reflect the reality that they share O1 as one of the operators. This is indeed what we find, as shown in the fit parameters listed in Table 1: fits to the individual data sets (dashed lines in Figure 2D) and a global fit to all three data sets simultaneously (solid lines), where we have enforced the constraint that all three data sets share the same J-factor and dissociation constant of the O1 operator, are comparable in their fidelity. We find that the fitted values for the Kd's agree well with values in the literature obtained through bulk biochemical techniques (see references cited in Table 1), as well as for the most part agreeing between individual fits to different data sets; and that the fitted J-factor also agrees well between data sets, with a value of 300 ± 20 pM. We are, therefore, confident that this combined concentration titration plus statistical mechanical model approach provides us with reasonable parameter values for both dissociation constants and J-factors, and that the global fit supplies the most reliable parameter estimates.
Table 1.
Measured dissociation constants and looping J-factors, in pM, obtained by fitting Equation 1 to the data shown in Figure 2D and E
| Data | Kid | K1 | K2 | Jloop,E8 | Jloop,TA |
|---|---|---|---|---|---|
| Oid-E894-O1 | 3 (± 1) | 90 (± 20) | – | 350 (± 40) | – |
| O1-E894-O1 | – | 47 (± 4) | – | 380 (± 30) | – |
| O2-E894-O1 | – | 26 (11, 125) | 300 (± 200) | 320 (± 90) | – |
| Oid-TA94-O1 | 10 (5, 46) | 80 (± 40) | – | – | 5500 (± 600) |
| Global Fit, E8 | 9 (± 1) | 42 (± 3) | 210 (± 40) | 300 (± 20) | – |
| Global Fit, E8 & TA | 12 (± 3) | 44 (± 3) | 240 (± 50) | 330 (± 30) | 4200 (± 600) |
| Literature values | 8.3±1.7 | 37±5 | 350±130 | – | – |
In most cases, the best fit parameter, plus or minus the standard deviation of the distribution of fit parameters from bootstrapped data, is reported; however in cases where the standard deviation includes negative parameter values, a 95% confidence interval is reported in parentheses instead. The first four rows are individual fits to the indicated data sets; the fifth row is a global fit to all three of the E8-containing data sets in Figure 2D; and the sixth row is a global fit to these three E8 data sets and the TA data set in Figure 2E. Fitting procedures are discussed in Section S4.4 in the Supplementary Data. Literature values for Kid taken from (48), for K1 from (49–51) and for K2 from (49).
The looping J-factor for E894 is higher than the corresponding cyclization J-factor of 54 pM reported in earlier work (29), and significantly higher than cyclization J-factors for other sequences of similar lengths (34). However, since the looped geometry imposes less stringent constraints on the DNA than does cyclization (discussed in more detail below), we would expect the looping J-factor to be larger than the cyclization J-factor.
Effect of sequence on looping probability
Though the role of DNA sequence has not been extensively studied in the particular case of transcription factor-mediated looping, it has become a key parameter in the discussion of a different mechanism of transcriptional regulation, that of nucleosome positioning in eukaryotes (35). A number of sequences with very different nucleosome affinities have been identified, some isolated from natural sources and others from nucleosome affinity assays with synthetic sequences (35). It has been argued for both classes that their nucleosomal affinities stem from different intrinsic flexibilities, and not in response to some other in vivo condition or to a property specific to nucleosome binding, which in turn has led not only to many theoretical and experimental studies on the relationship between sequence and flexibility (11,12,36,37), but also to the determination of certain sequences that are claimed to be highly flexible. For example, Cloutier and Widom characterized a sequence, 601TA, which has a significantly higher affinity for nucleosomes and a J-factor for cyclization 5–30 times greater than the random E8 sequence described in the previous section, depending on the phasing discussed in the next section (29,33,38). If 601TA and E8 differ in mechanical bendability in some general sense, then 601TA should increase looping by a bacterial transcription factor just as it increases nucleosome binding and cyclizes more readily than E8.
As derived in Equations 2 and 3 and shown graphically in Figure 2B, if the 601TA and E8 sequences have different J-factors, then the concentration at which looping is maximal should be the same for both sequences, but looping should increase at all concentrations with the more flexible sequence. This is indeed what we find experimentally in Figure 2E, which shows results for the looping probability as a function of repressor concentration for a loop with 94 bp of a sequence derived from 601TA (henceforth abbreviated to ‘TA’), flanked by the Oid and O1 operators. In analogy with the case of different operators discussed in the previous section, the agreement between the individual fit to the TA data (red dashed line) and the global fit to both the E8 and TA data (solid lines) demonstrates that the two data sets can be fit by the same operator dissociation constants but different J-factors (Table 1). The outcome of this measurement is a looping J-factor of 4.2 ± 0.6 nM for the TA sequence, about 10 times higher than the random E8 sequence. This is again higher than the cyclization J-factors in (29) and (34) in terms of absolute magnitude, and significantly so: if we use Equation 3 and the cyclization J-factors of (29) to predict maximal looping probabilities, we would expect the maximal looping probability for Oid-E894-O1 to be 0.25 ± 0.3 (compared to the experimentally observed 0.62 ± 0.01), for Oid-TA94-O1 to be 0.87 ± 0.2 (compared to 0.95 ± 0.01) and the O2-E894-O1 construct to show essentially no looping at all. The looping J-factor we measure for the TA sequence is not, however, as much higher than E8 as the 30-fold difference measured in cyclization (29), hinting that the constraints imposed on the DNA in cyclization versus loop formation may lead to a different dependence on sequence, as indeed we find below.
Effect of loop length on looping probability
One of the signatures of looping by transcription factors both in vitro and in vivo is a significant modulation of transcription factor activity as the distance between the transcription factor binding sites is varied (2,10,39,40). A similar phasing effect has been observed in cyclization data with the E8 and TA sequences (29). Our experiments, in conjunction with our model that allows us to extract J-factors, permit us to explore this phasing behavior for both of the sequences discussed in the previous section and to compare with several recent theoretical predictions of the looping J-factor.
In the spirit of the kinds of theoretical predictions of Figure 2B, we can use the cyclization results of (29), which looked at the differences between E8 and TA across multiple DNA lengths, to make a naïve prediction of how we would expect the sequence dependence to looping shown in Figure 2E to manifest as the loop length is changed. Such a prediction is shown as a red hatched region in Figure 3A. However, as shown in that figure, to our surprise our experimental results for the looping probabilities for the two sequences, at a constant repressor concentration of 100 pM, show no sequence dependence to looping, with the exception of one or two lengths around the length shown in Figure 2B. The modulation of looping due to phasing is observed in both the E8- and TA-containing sequences, and, with the exception of the 94 bp loop length, it appears that this phasing is the same for both sequences. Yet again, surprisingly, not only does the nucleosome positioning sequence not fall within the hatched predicted region, in fact the nucleosome positioning sequence has comparable or smaller looping probabilities compared with the random sequence at most loop lengths.
Even more surprising is that a difference in loopability between the E8 and TA sequences can be restored when the last 36 bp of the loop is replaced with the bacterial lacUV5 promoter sequence, as shown in Figure 3D. We were motivated to make this change since in parallel work we have measured how this sequence-dependent looping affects gene expression in vivo and the presence of the promoter is a natural part of the full regulatory network. Though these loops contain 36 bp of the loop that are identical between the E8 and TA constructs, the TA-containing DNAs now loop more than the E8-containing DNAs and at some lengths are even as much more flexible than the E8-containing DNAs as predicted based on cyclization assays, as shown by the red hatched region in Figure 3D. Interestingly, the J-factors for the E8 sequence with and without the promoter are comparable—that is, the inclusion of the promoter increases the flexibility of the TA-containing loops only (Figure 3F).
Before discussing the implications of these complex sequence dependencies, we note several additional features of these length data in light of recent theoretical works on the length dependence of Lac repressor-mediated looping, which are plotted in Figure 4. We and others observe two looped states with any pair of operators, which have been hypothesized to arise from the four distinct topological states of the looped DNA and/or several distinct repressor conformations schematized in the legend of Figure 4 (see also the ‘Materials and Methods’ section) (17,18,21–26,41). Regardless of their underlying molecular origins, in Figure 2F we show that the two looped states we observe can be modeled as differing only in effective J-factor; so in Figure 4, we compare the recent theoretical works plotted there with our experimental looping J-factors, but we do so for the two looped states separately, as each of the theoretical results make assumptions about the loop conformation that surely must differ between the two looped states we observe. As can be seen in that figure, different assumptions about the loop and protein geometry, and potential protein flexibility, lead to orders of magnitude differences in the predicted J-factors, reflecting our current uncertainty about the structure of the loop. Moreover, no single theoretical work captures both the magnitude and the phasing of our experimental J-factors, suggesting that none of the theories accurately represents the loop structure yet.
We caution the reader, however, that a detailed direct comparison between these theoretical predictions and with our data may not be possible for several reasons: (i) assumptions about experimental conditions such as salt concentrations differ between references and from the conditions in this work, (ii) it is possible, as argued in (17,18), that the experimentally observed states correspond to superpositions of two or more theoretically predicted states for different loop topologies and/or repressor conformations and (iii) as suggested by FRET data (22), TPM with cross-linked repressor (26) and molecular dynamics simulations (42), the protein conformation in both states may involve some degree of rearrangement relative to the V-like conformation observed in the crystal structure [at the least, rotation of the DNA binding domains, as in (42)]. In these cases, our data would not align with any single theoretical curve. However, we do make some general observations below and in Section S2 in the Supplementary Data.
We find experimentally that the J-factors for the two states have opposite phasings, at least without the promoter, as shown in Figure 3B, and this phasing does not change between sequences except near 94 bp. Such out-of-phase behavior for two different loop structures has been observed for other DNA looping proteins (43), and has been used to explain key features of in vivo repression data (44). However, it is not captured by all of the theoretical models in Figure 4 [e.g. the ‘va’ and ‘e’ states of (19)]. Intriguingly, the promoter changes the relative probabilities of the two looped states: as shown in Figure 3E, the promoter-containing constructs result almost exclusively in the middle state, whereas without the promoter, the two looped states alternate in prevalence (Figure 3B). As these measurements represent the first single-molecule study on the phasing of these two looped states at single base pair resolution, over two helical periods of DNA, at the short loop lengths where the models in Figure 4 show the most pronounced differences in J-factors due to repressor and loop conformations, we hope that our data will help shed light on the molecular origins of the two looped states.
DISCUSSION
We have shown here that the looping J-factors for 94 bp of a random sequence and a nucleosome positioning sequence differ by an order of magnitude, with the nucleosome positioning sequence being more flexible than the random sequence, as expected based on previous cyclization and nucleosome formation assays. To our surprise, however, this sequence dependence occurs only at 94 bp, unless a bacterial promoter sequence is added to the loop, in which case a consistent length-independent sequence dependence is restored.
It is clear that data on more sequences are needed before any definitive conclusions can be drawn. However, we present here one possible hypothesis that we have considered: that the sequence-dependent free energy of bending a DNA depends more strongly than has been previously appreciated upon the specific details of how the DNA double helix is deformed when forming loops versus nucleosomes versus DNA circles. Drew and Travers (45) argued that a DNA minicircle formed by cyclization shares structural similarities with the DNA wrapped around a histone octamer, explaining the usefulness of cyclization assays for understanding the sequence preferences of nucleosome formation. Cyclization has often been cited as a model by which to understand looping as well (8,33,37,46). However, as diagrammed in Figure 4, for DNA loop formation by the Lac repressor, there are multiple looped configurations allowed for a given loop length, most of which are probably quite far from circular as a result of the distinct boundary conditions imposed by repressor binding, and which should have large effects on the associated looping J-factor. We argue that although DNA cyclization may share characteristics with DNA looping such as length-dependent phasing, it apparently does not share other characteristics such as trends in sequence-dependent flexibility, possibly because of this difference in boundary conditions.
We also suspect that the strong sequence dependence at 94 bp without the promoter, and with the promoter at all lengths, is due to a change in the preferred loop conformations of these constructs, compared with the majority of the no-promoter constructs. Indeed, the change in the predominant looped state (the ‘bottom’ and ‘middle’ states alternating without the promoter, but the ‘middle’ state predominating at all lengths with the promoter) supports this hypothesis that the promoter alters the preferred conformation of the loop. Such a change in the preferred loop conformation could arise, for example, because of an intrinsic curvature to the lacUV5 promoter sequence. To further unravel these subtleties, we believe a high-throughput approach that makes it possible to look at many sequences might be necessary. We also hope that additional theoretical analyses, perhaps involving the observed tether lengths of the looped state with and without the promoter given in Section S6 in the Supplementary Data, may shed further light on the conformations of looping for these different sequences.
As discussed in the Introduction, the mechanics of loop formation at these short loop lengths that are so prevalent in cellular processes is a subject of much debate, regardless of their sequences (6,11). However, the question of how flexible we expect short DNAs to be is more complicated to answer in the case of protein-mediated DNA looping than in the case of cyclization. As shown in Figure 4, varying the boundary conditions of the loop or the assumed protein flexibility can lead to enormous differences in predicted looping J-factors. Some of these predicted J-factors, using canonical assumptions about DNA flexibility, and without invoking anharmonic elasticity, are in fact consistent with the J-factors we measure, so perhaps it should not be surprising that short transcription factor-mediated loops can form readily in vitro.
CONCLUSION
Transcription factor-mediated loops are a common motif in both prokaryotic and eukaryotic gene regulation. Here, we have presented a combined single molecule plus modeling approach that allows us to explore how such looping is influenced by four distinct, tunable biological parameters: transcription factor binding site strength, transcription factor concentration, DNA loop length and DNA loop sequence. We have demonstrated that this approach explains how the looping probability depends upon the strength of the operator dissociation constants and that our measured Kd's agree well with values previously obtained by bulk biochemical methods. Further, our model accounts well both quantitatively and qualitatively for the effects of varying the loop flexibility, as well as for details of our single molecule looping experiments such as the presence of two looped states. Our method provides a way of measuring J-factors that is orthogonal to, and therefore complementary to, current methods in use, which we argue has led to important new insights into the role of sequence in DNA flexibility. In particular, we have argued here that the sequence-dependent free energy of bending a DNA must depend more strongly than has been previously appreciated upon the specific details of how the DNA double helix is deformed when forming loops versus nucleosomes versus DNA circles. It is not the case that the TA sequence can be claimed to be more flexible in some general sense, nor can cyclization assays be used to determine DNA flexibility for all biological contexts, as we have shown here that loop formation does not necessarily follow the same sequence rules as cyclization. Measurements of looping J-factors with many more sequences, and further theoretical explorations of the possible effects of sequence on these looping J-factors, will be necessary to understand the initial results presented here. Continuing decades of work on the sequence-dependent mechanics of DNA, the influence of sequence on DNA looping by transcription factors now demands the same kind of scrutiny that has already been given to nucleosome formation.
SUPPLEMENTARY DATA
Supplementary Data are available at NAR Online: Supplementary Tables 1–3, Supplementary Figures 1–12, Supplementary Methods and Supplementary References [52–59].
FUNDING
National Institutes of Health (NIH) [DP1 OD000217A (Director's Pioneer Award), R01 GM085286, R01 GM085286-01S1, and 1 U54 CA143869 (Northwestern PSOC Center)]; National Science Foundation through a graduate fellowship (to S.J.); Wenner-Gren foundation (to M.L.); Fondation Pierre Gilles de Gennes (to R.P.); and the foundations of the Royal Swedish Academy of Sciences (to M.L.). Funding for open access charge: NIH [1 U54 CA143869].
Conflict of interest statement. None declared.
Supplementary Material
ACKNOWLEDGEMENTS
This work is dedicated to Jon Widom with warmth and appreciation for years of scientific advice and insight including for this project. We thank Kathy Matthews, Jia Xu, Kate Craig, Lin Han, Hernan Garcia, Phil Nelson, John Beausang, Laura Finzi, Jane Kondev, Shimon Weiss, Bob Schleif, Dave Wu, Matthew Johnson, Seth Blumberg, and Luke Breuer for insightful discussions and technical help, and the Mayo, Shan and Bjorkman labs for borrowed equipment and advice on the LacI purification.
REFERENCES
- 1.Echols H. Nucleoprotein structures initiating DNA replication, transcription, and site-specific recombination. J. Biol. Chem. 1990;265:14697–14700. [PubMed] [Google Scholar]
- 2.Schleif R. DNA looping. Annu. Rev. Biochem. 1992;61:199–223. doi: 10.1146/annurev.bi.61.070192.001215. [DOI] [PubMed] [Google Scholar]
- 3.Luijsterburg MS, Noom MC, Wuite GJL, Dame RT. The architectural role of nucleoid-associated proteins in the organization of bacterial chromatin: a molecular perspective. J. Struct. Biol. 2006;156:262–272. doi: 10.1016/j.jsb.2006.05.006. [DOI] [PubMed] [Google Scholar]
- 4.Matthews KS. DNA looping. Microbiol. Rev. 1992;56:123–136. doi: 10.1128/mr.56.1.123-136.1992. [DOI] [PMC free article] [PubMed] [Google Scholar]
- 5.Luger K, Mäder AW, Richmond RK, Sargent DF, Richmond TJ. Crystal structure of the nucleosome core particle at 2.8 Å resolution. Nature. 1997;389:251–260. doi: 10.1038/38444. [DOI] [PubMed] [Google Scholar]
- 6.Garcia HG, Grayson P, Han L, Inamdar M, Kondev J, Nelson PC, Phillips R, Widom J, Wiggins PA. Biological consequences of tightly bent DNA: the other life of a macromolecular celebrity. Biopolymers. 2007;85:115–130. doi: 10.1002/bip.20627. [DOI] [PMC free article] [PubMed] [Google Scholar]
- 7.Ptashne N. Gene regulation by proteins acting nearby and at a distance. Nature. 1986;322:697–701. doi: 10.1038/322697a0. [DOI] [PubMed] [Google Scholar]
- 8.Rippe K, von Hippel PH, Langowski J. Action at a distance: DNA-looping and initiation of transcription. Trends Biochem. Sci. 1995;20:500–506. doi: 10.1016/s0968-0004(00)89117-3. [DOI] [PubMed] [Google Scholar]
- 9.Tolhuis B, Palstra R-J, Splinter E, Grosveld F, de Laat W. Looping and interaction between hypersensitive sites in the active β-globin locus. Mol. Cell. 2002;10:1453–1465. doi: 10.1016/s1097-2765(02)00781-5. [DOI] [PubMed] [Google Scholar]
- 10.Müller J, Oehler S, Müller-Hill B. Repression of lac promoter as a function of distance, phase, and quality of an auxiliary lac operator. J. Mol. Biol. 1996;257:21–29. doi: 10.1006/jmbi.1996.0143. [DOI] [PubMed] [Google Scholar]
- 11.Peters JP, Maher LJ., III DNA curvature and flexibility in vitro and in vivo. Q. Rev. Biophys. 2010;43:22–63. doi: 10.1017/S0033583510000077. [DOI] [PMC free article] [PubMed] [Google Scholar]
- 12.Olson WK, Zhurkin VB. Working the kinks out of nucleosomal DNA. Curr. Opin. Struct. Biol. 2011;21:348–357. doi: 10.1016/j.sbi.2011.03.006. [DOI] [PMC free article] [PubMed] [Google Scholar]
- 13.Schafer DA, Gelles J, Sheetz MP, Landick R. Transcription by single molecules of RNA polymerase observed by light microscopy. Nature. 1991;352:444–448. doi: 10.1038/352444a0. [DOI] [PubMed] [Google Scholar]
- 14.Yin H, Landick R, Gelles J. Tethered particle motion method for studying transcript elongation by a single RNA polymerase molecule. Biophys. J. 1994;67:2468–2478. doi: 10.1016/S0006-3495(94)80735-0. [DOI] [PMC free article] [PubMed] [Google Scholar]
- 15.Jacobson H, Stockmayer WH. Intramolecular reaction in polycondensations. I. The theory of linear systems. J. Chem. Phys. 1950;18:1600–1606. [Google Scholar]
- 16.Shimada J, Yamakawa H. Ring-closure probabilities for twisted wormlike chains. Application to DNA. Macromolecules. 1984;17:689–698. [Google Scholar]
- 17.Han L, Garcia HG, S., B., Towles KB, Beausang JF, Nelson PC, Phillips R. Concentration and length dependence of DNA looping in transcriptional regulation. PLoS One. 2009;4:e5621. doi: 10.1371/journal.pone.0005621. [DOI] [PMC free article] [PubMed] [Google Scholar]
- 18.Towles KB, Beausang JF, Garcia HG, Phillips R, Nelson PC. First-principles calculation of DNA looping in tethered particle experiments. Phys. Biol. 2009;6:025001. doi: 10.1088/1478-3975/6/2/025001. [DOI] [PMC free article] [PubMed] [Google Scholar]
- 19.Swigon D, Coleman BD, Olson WK. Modeling the Lac repressor-operator assembly: the influence of DNA looping on Lac repressor conformation. Proc. Natl Acad. Sci. USA. 2006;103:9879–9884. doi: 10.1073/pnas.0603557103. [DOI] [PMC free article] [PubMed] [Google Scholar]
- 20.Zhang Y, McEwen AE, Crothers DM, Levene SD, Fraser P. Analysis of in vivo Lac R-mediated gene repression based on the mechanics of DNA looping. PLoS One. 2006;1:e136. doi: 10.1371/journal.pone.0000136. [DOI] [PMC free article] [PubMed] [Google Scholar]
- 21.Mehta RA, Kahn JD. Designed hyperstable Lac repressor·DNA loop topologies suggest alternative loop geometries. J. Mol. Biol. 1999;294:67–77. doi: 10.1006/jmbi.1999.3244. [DOI] [PubMed] [Google Scholar]
- 22.Edelman LM, Cheong R, Kahn JD. Fluorescence resonance energy transfer over 130 basepairs in hyperstable Lac repressor-DNA loops. Biophys. J. 2003;84:1131–1145. doi: 10.1016/S0006-3495(03)74929-7. [DOI] [PMC free article] [PubMed] [Google Scholar]
- 23.Morgan MA, Okamoto K, Kahn JD, English DS. Single-molecule spectroscopic determination of Lac repressor-DNA loop conformation. Biophys. J. 2005;89:2588–2596. doi: 10.1529/biophysj.105.067728. [DOI] [PMC free article] [PubMed] [Google Scholar]
- 24.Wong OK, Guthold M, Erie DA, Gelles J. Interconvertible Lac repressor-DNA loops revealed by single-molecule experiments. PLoS Biol. 2008;6:e232. doi: 10.1371/journal.pbio.0060232. [DOI] [PMC free article] [PubMed] [Google Scholar]
- 25.Normanno D, Vanzi F, Pavone FS. Single-molecule manipulation reveals supercoiling-dependent modulation of lac repressor-mediated DNA looping. Nucleic Acids Res. 2008;36:2505–2513. doi: 10.1093/nar/gkn071. [DOI] [PMC free article] [PubMed] [Google Scholar]
- 26.Rutkauskas D, Zhan H, Matthews KS, Pavone FS, Vanzi F. Tetramer opening in LacI-mediated DNA looping. Proc. Natl Acad. Sci. USA. 2009;106:16627–16632. doi: 10.1073/pnas.0904617106. [DOI] [PMC free article] [PubMed] [Google Scholar]
- 27.Xu J, Matthews KS. Flexibility in the inducer binding region is crucial for allostery in the Escherichia coli lactose repressor. Biochemistry. 2009;48:4988–4998. doi: 10.1021/bi9002343. [DOI] [PMC free article] [PubMed] [Google Scholar]
- 28.Butler AP, Revzin A, von Hippel PH. Molecular parameters characterizing the interaction of Escherichia coli lac repressor with non-operator DNA and inducer. Biochemistry. 1977;16:4757–4768. doi: 10.1021/bi00641a001. [DOI] [PubMed] [Google Scholar]
- 29.Cloutier TE, Widom J. DNA twisting flexibility and the formation of sharply looped protein-DNA complexes. Proc. Natl. Acad. Sci. USA. 2005;102:3645–3650. doi: 10.1073/pnas.0409059102. [DOI] [PMC free article] [PubMed] [Google Scholar]
- 30.Finzi L, Gelles J. Measurement of Lactose repressor-mediated loop formation and breakdown in single DNA molecules. Science. 1995;267:378–380. doi: 10.1126/science.7824935. [DOI] [PubMed] [Google Scholar]
- 31.Vanzi F, Broggio C, Sacconi L, Pavone FS. Lac repressor hinge flexibility and DNA looping: single molecule kinetics by tethered particle motion. Nucleic Acids Res. 2006;34:3409–3420. doi: 10.1093/nar/gkl393. [DOI] [PMC free article] [PubMed] [Google Scholar]
- 32.Milstein JN, Chen YF, Meiners J-C. Bead size effects on protein-mediated DNA looping in tethered-particle motion experiments. Biopolymers. 2011;95:144–150. doi: 10.1002/bip.21547. [DOI] [PubMed] [Google Scholar]
- 33.Cloutier TE, Widom J. Spontaneous sharp bending of double-stranded DNA. Mol. Cell. 2004;14:355–362. doi: 10.1016/s1097-2765(04)00210-2. [DOI] [PubMed] [Google Scholar]
- 34.Du Q, Smith C, Shiffeldrim N, Vologodskaia M, Vologodskii A. Cyclization of short DNA fragments and bending fluctuations of the double helix. Proc. Natl. Acad. Sci. USA. 2005;102:5397–5402. doi: 10.1073/pnas.0500983102. [DOI] [PMC free article] [PubMed] [Google Scholar]
- 35.Widom J. Role of DNA sequence in nucleosome stability and dynamics. Q. Rev. Biophys. 2001;34:1–56. doi: 10.1017/s0033583501003699. [DOI] [PubMed] [Google Scholar]
- 36.Hogan M, LeGrange J, Austin B. Dependence of DNA helix flexibility on base composition. Nature. 1983;304:752–754. doi: 10.1038/304752a0. [DOI] [PubMed] [Google Scholar]
- 37.Geggier S, Vologodskii A. Sequence dependence of DNA bending rigidity. Proc. Natl. Acad. Sci. USA. 2010;107:15421–15426. doi: 10.1073/pnas.1004809107. [DOI] [PMC free article] [PubMed] [Google Scholar]
- 38.Lowary PT, Widom J. New DNA sequence rules for high affinity binding to histone octamer and sequence-directed nucleosome positioning. J. Mol. Biol. 1998;276:19–42. doi: 10.1006/jmbi.1997.1494. [DOI] [PubMed] [Google Scholar]
- 39.Krämer H, Niemöller M, Amouyal M, Revet B, von Wilcken-Bergmann B, Müller-Hill B. lac repressor forms loops with linear DNA carrying two suitably spaced lac operators. J. Mol. Biol. 1997;267:1305–1314. doi: 10.1002/j.1460-2075.1987.tb02390.x. [DOI] [PMC free article] [PubMed] [Google Scholar]
- 40.Bellomy GR, Mossing MC, Record MT., Jr Physical properties of DNA in vivo as probed by the length dependence of the lac operator looping process. Biochemistry. 1988;27:3900–3906. doi: 10.1021/bi00411a002. [DOI] [PubMed] [Google Scholar]
- 41.Hirsh AD, Lillian TD, Lionberger TA, Perkins NC. DNA modeling reveals an extended Lac repressor conformation in classic in vitro binding assays. Biophys. J. 2011;101:718–726. doi: 10.1016/j.bpj.2011.06.040. [DOI] [PMC free article] [PubMed] [Google Scholar]
- 42.Villa E, Balaeff A, Schulten K. Structural dynamics of the lac repressor–DNA complex revealed by a multiscale simulation. Proc. Natl. Acad. Sci. USA. 2005;102:6783–6788. doi: 10.1073/pnas.0409387102. [DOI] [PMC free article] [PubMed] [Google Scholar]
- 43.Watson MA, Gowers DM, Halford SE. Alternative geometries of DNA looping: an analysis using the SfiI endonuclease. J. Mol. Biol. 2000;298:461–475. doi: 10.1006/jmbi.2000.3676. [DOI] [PubMed] [Google Scholar]
- 44.Saiz L, Vilar JMG. Multilevel deconstruction of the in vivo behavior of looped DNA-protein complexes. PLoS One. 2007;2:e355. doi: 10.1371/journal.pone.0000355. [DOI] [PMC free article] [PubMed] [Google Scholar]
- 45.Drew HR, Travers AA. DNA bending and its relation to nucleosome positioning. J. Mol. Biol. 1985;186:773–790. doi: 10.1016/0022-2836(85)90396-1. [DOI] [PubMed] [Google Scholar]
- 46.Bellomy GR, Record MT., Jr Stable DNA loops in vivo and in vitro: roles in gene regulation at a distance and in biophysical characterization of DNA. Prog. Nucleic Acid Res. Mol. Biol. 1990;39:81–128. doi: 10.1016/s0079-6603(08)60624-8. [DOI] [PubMed] [Google Scholar]
- 47.Lewis M, Chang G, Horton NC, Kercher MA, Pace HC, Schumacher MA, Brennan RG, Lu P. Crystal structure of the Lactose operon repressor and its complexes with DNA and inducer. Science. 1996;271:1247–1254. doi: 10.1126/science.271.5253.1247. [DOI] [PubMed] [Google Scholar]
- 48.Frank DE, Saecker RM, Bond JP, Capp MW, Tsodikov OV, Melcher SE, Levandoski MM, Record MT., Jr Thermodynamics of the interactions of lac repressor with variants of the symmetric lac operator: Effects of converting a consensus site to a non-specific site. J. Mol. Biol. 1997;267:1305–1314. doi: 10.1006/jmbi.1997.0920. [DOI] [PubMed] [Google Scholar]
- 49.Hsieh W-T, Whitson PA, Matthews KS, Wells RD. Influence of sequence and distance between two operators on interaction with the lac repressor. J. Biol. Chem. 1987;262:14583–14591. [PubMed] [Google Scholar]
- 50.Whitson PA, Olson JS, Matthews KS. Thermodynamic analysis of the Lactose repressor-operator DNA interaction. Biochemistry. 1986;25:3852–3858. doi: 10.1021/bi00361a017. [DOI] [PubMed] [Google Scholar]
- 51.Whitson PA, Matthews KS. Dissociation of the Lactose repressor-operator DNA complex: Effects of size and sequence context of operator-containing DNA. Biochemistry. 1986;25:3845–3852. doi: 10.1021/bi00361a016. [DOI] [PubMed] [Google Scholar]
- 52.Zhan H, Sun Z, Matthews KS. Functional impact of polar and acidic substitutions in the Lactose repressor hydrophobic monomer–monomer interface with a buried lysine. Biochemistry. 2009;48:1305–1314. doi: 10.1021/bi801357f. [DOI] [PubMed] [Google Scholar]
- 53.Barry JK, Matthews KS. Thermodynamic analysis of unfolding and dissociation in Lactose repressor protein. Biochemistry. 1999;38:6520–6528. doi: 10.1021/bi9900727. [DOI] [PubMed] [Google Scholar]
- 54.Chen J, Matthews KS. Subunit dissociation affects DNA binding in a dimeric Lac repressor produced by C-terminal deletion. Biochemistry. 1994;33:8728–8735. doi: 10.1021/bi00195a014. [DOI] [PubMed] [Google Scholar]
- 55.Chen J, Matthews KS. Deletion of Lactose repressor carboxyl-terminal domain affects tetramer dissociation. J. Biol. Chem. 1992;267:13843–13850. [PubMed] [Google Scholar]
- 56.Brenowitz M, Mandal N, Pickar A, Jamison E, Adhya S. DNA-binding properties of a Lac repressor mutant incapable of forming tetramers. J. Biol. Chem. 1991;266:1281–1288. [PubMed] [Google Scholar]
- 57.Plischke M, Birger B. Equilibrium statistical physics. 3rd edn. Hackensack NJ: World Scientific; 2006. [Google Scholar]
- 58.Oehler S, Amouyal M, Kolkhof P, von Wilcken-Bergmann B, Müller-Hill B. Quality and position of the three lac operators of E. coli define efficiency of repression. EMBO J. 1994;13:3348–3355. doi: 10.1002/j.1460-2075.1994.tb06637.x. [DOI] [PMC free article] [PubMed] [Google Scholar]
- 59.Newman MEJ, Barkema GT. Monte Carlo Methods in Statistical Physics. USA: Oxford University Press; 1999. [Google Scholar]
- 60.Segall DE, Nelson PC, Phillips R. Volume-exclusion effects in tethered-particle experiments: bead size matters. Phys. Rev. Lett. 2006;96:088306. doi: 10.1103/PhysRevLett.96.088306. [DOI] [PMC free article] [PubMed] [Google Scholar]
Associated Data
This section collects any data citations, data availability statements, or supplementary materials included in this article.