Abstract
Ultrasound-based real-time molecular imaging in large blood vessels holds promise for early detection and diagnosis of various important and significant diseases, such as stroke, atherosclerosis, and cancer. Central to the success of this imaging technique is the isolation of ligand-receptor bound adherent microbubbles from free microbubbles and tissue structures. In this paper, we present an alternative approach, termed singular spectrum-based targeted molecular (SiSTM) imaging, which separates signal components using singular value spectra content over local regions of complex echo data. Simulations were performed to illustrate the effects of acoustic target motion and harmonic energy on SiSTM imaging-derived measurements of statistical dimensionality. In vitro flow phantom experiments were performed under physiologically realistic conditions (2.7 cm/s flow velocity and 4 mm diameter) with targeted and non-targeted phantom channels. Both simulation and experimental results demonstrated that the relative motion and harmonic characteristics of adherent microbubbles (i.e. low motion and large harmonics) yields echo data with dimensionality that is distinct from free microbubbles (i.e. large motion and large harmonics) and tissue (i.e. low motion and low harmonics). Experimental SiSTM images produced the expected trend of greater adherent microbubble signal in targeted versus non-targeted microbubble experiments (P < 0.05, n = 4). The location of adherent microbubbles was qualitatively confirmed via optical imaging of fluorescent DiI signal along the phantom channel walls after SiSTM imaging. In comparison with two frequency-based real-time molecular imaging strategies, SiSTM imaging provided significantly higher image contrast (P < 0.001, n = 4) and larger area under the receiver operating characteristic curve (P < 0.05, n = 4).
I. Introduction
Ultrasound-based targeted molecular imaging has recently been proposed as an alternative to anatomical-based imaging modalities for the detection of diseases, such as cardiovascular disease (Kaufmann et al., 2007; Ross, 1993; Villanueva et al., 1998; Rychak et al., 2006; Weller et al., 2002; Lindner et al., 2001; Song et al., 2001; Takalkar et al., 2004; Ferrara et al., 2007; Klibanov, 2007) and cancer (Ferrara et al., 2007; Leong-Poi et al., 2003; Collingridge et al., 2002). Early detection and diagnosis of these diseases offers the potential to facilitate prompt therapy that may improve patient outcomes using simpler, lower risk, and lower cost approaches. Ultrasound-based targeted molecular imaging employs shell-stabilized gas-filled microbubbles (Dejong et al., 1992) that have ligands matched to molecular receptors associated with the disease of interest (e.g. VEGF and αv-integrins for cancer or ICAM-1 and P-selectin for cardiovascular disease). In this way, a microbubble that becomes adhered to the vessel wall, via a specific ligand-receptor bond, provides an ultrasound echo signal “signature” of the presence of that specific molecular marker on the vessel wall.
A central technical challenge to ultrasound-based targeted molecular imaging is the isolation of the echo signal derived from adherent microbubbles – i.e. those that have formed a ligand-receptor bond to a target molecule. Current technologies implemented on clinical ultrasound systems include nonlinear signal detection methods relying on amplitude modulation (AM), pulse inversion (PI), or methods that combine both AM and PI such as “Contrast Pulse Sequences” (CPS) (Phillips, 2001; Phillips and Gardner, 2004; Brock-Fisher et al., 1996; Mor-Avi et al., 2001; Eckersley et al., 2005; Simpson et al., 1999; Deshpande et al., 2010). Limitations of these approaches, include an inability to differentiate between adherent microbubble signal and signal derived from “free” microbubbles (i.e. microbubbles not bound to the vessel wall). As a result, lengthy (e.g. 15–30 minute) waiting periods are needed to clear the free microbbuble signal (Lindner et al., 2001; Pochon et al., 2010). This results in long scan times and precludes real-time imaging. Substantial additional challenges to these techniques also exist when attempted in large vessels (e.g. > 2 mm) in vivo due to low targeting efficiency resulting from high flow velocities and low probability of microbubble-vessel wall contact (Kornmann et al., 2010). To partially address this challenge, the application of acoustic radiation force has been demonstrated to provide a several-fold increase in microbubble adhesion in vitro and in vivo (Dayton et al., 1999; Dayton et al., 2002; Zhao et al., 2004; Rychak et al., 2005; Rychak et al., 2007).
Several groups have recently demonstrated advanced real-time targeted molecular imaging techniques in small vessels in vitro and in vivo (Gessner R, 2009; Needles et al., 2009; Hu et al., 2010), as well as in large vessels ex vivo (Patil et al., 2009; Patil et al., 2011). Common approaches involve the combination of acoustic radiation force, nonlinear signal detection (e.g. harmonic imaging or CPS), and low-pass interframe filtering. Two examples suitable for large vessel imaging include pulse inversion with an infinite impulse response (IIR) filter (PI + IIR) (Patil et al., 2009; Patil et al., 2011) and harmonic imaging with a low-pass IIR filter (Harmonic + IIR). Recent work by Hu et al. (2010) demonstrated a Harmonic + IIR-related method but using a customized transducer enabling a superior range of sensitivity to harmonics while transmitting at a lower frequency. Both PI + IIR and Harmonic + IIR methods make two fundamental assumptions: 1) microbubbles exhibit greater non-linear acoustic response, and thus stronger harmonics in the sample-to-sample (i.e. “fast-time) dimension, than tissue and 2) adherent microbubbles exhibit less motion, and thus lower frequencies in the frame-to-frame (i.e. “slow-time”) dimension, compared with free microbubbles. While these methods address many challenges to real-time imaging in large blood vessels, technical limitations linked to these assumptions limits microbubble imaging sensitivity and specificity. For instance, the vessel wall signal is often difficult to reject using these approaches since it exhibits a bright reflection and non-linear acoustic energy.
In this paper, we present an alternative approach, which we refer to as singular spectrum-based targeted molecular (SiSTM) imaging. Instead of relying on frequency domain-based filtering, SiSTM imaging isolates adherent microbubble signal using a singular value filter-based approach (Mauldin et al., 2011), which delineates signal components using statistical properties of the raw acoustic data. The new method is described and simulations in FIELD II (Jensen and Svendsen, 1992) are performed to illustrate the basic principles. The proposed SiSTM imaging technique is then tested in vitro using targeted microbubbles in a gelatin flow phantom. The method is compared against (PI + IIR) and (Harmonic + IIR) techniques. Results are quantified in terms of sensitivity, specificity, and image contrast.
II. Materials and Methods
A. Singular spectrum-based targeted molecular (SiSTM) imaging
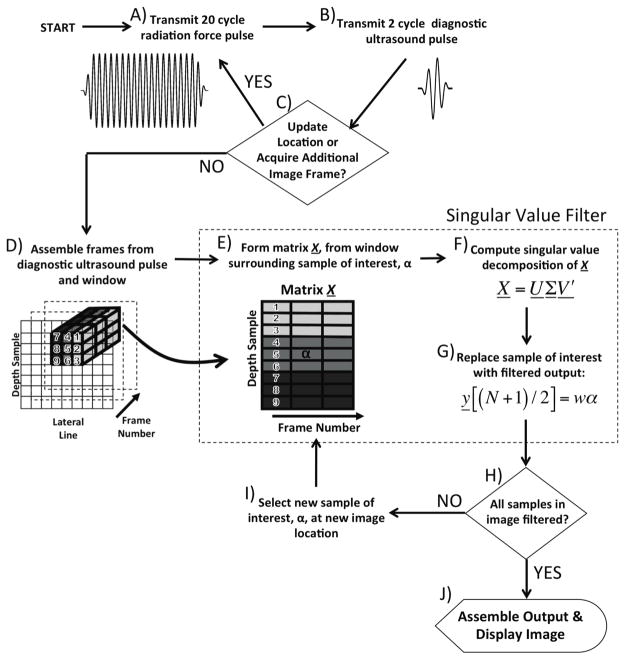
The SiSTM imaging approach, illustrated in Figure 1, is an alternative real-time targeted molecular imaging technique. In a manner similar to several recently proposed methods, SiSTM imaging leverages acoustic radiation force to enhance binding efficiency. Each acoustic radiation force is associated with an imaging pulse, which is used to assemble frames of echo data for filtering. Both imaging and acoustic radiation force pulses were set to a mechanical index (MI) < 0.2 in order to avoid microbubble destruction. In contrast to other proposed techniques, isolation of adherent microbubbles signal from these frames of echo data is achieved by analysis of the local statistical properties rather than the frequency characteristics. This signal processing approach used in SiSTM imaging is derived from a recently introduced principal component analysis (PCA) based scheme, referred to as the singular value filter (SVF) (Mauldin et al., 2011). The SVF allows separation of spatially overlapping clutter artifacts from underlying cardiac tissue. In molecular imaging, however, the primary challenge is to segment image regions corresponding to adherent microbubbles, rather than separate spatially overlapping source signals. As a result, the SVF implementation in SiSTM imaging yields a simple weighting of each sample of interest in the image frame. The weighting coefficients for each sample are obtained from the singular value spectra over local windowed regions surrounding the corresponding sample of interest.
Figure 1.
A block diagram of SiSTM imaging.
A detailed description of SVF is described in detail in (Mauldin et al., 2011). Briefly, the SVF method operates by forming a matrix X (dimension M x N) for every sample of each image frame, where M is the number of samples in the filter window and N is the number of image frames. The matrix X represents a windowed region of complex echo data centered about a sample of interest, α= X[(M + 1)/2,(N + 1)/2]. The formation of matrix X from frames of echo data is illustrated in Figure 1, block D and E. For each sample in the image frame, a new X is formed and the resulting SVF output is used to form the final filtered image.
Once the matrix X is formed, SVF proceeds by computing a singular value decomposition of X (block F):
| (1) |
where U is a matrix with left singular vectors arranged in columns, Σ is a diagonal matrix containing the singular value spectrum, and V is a matrix with right singular vectors, corresponding to PCA basis functions υk, representing the kth column in V.
The filtered output from SVF is:
| (2) |
where y is the SVF filtered output ensemble and γ(k) is the projection of the ensemble of interest xM+1/2 onto the kth PCA basis function, υk:
| (3) |
However, as described above, in the context of segmenting regions of adherent microbubbles, the SVF scheme does not require separation of spatially overlapping source signals. As a result, the weighting function w[k] is not dependent on k and is instead a scalar quantity, w. Equation (2) can therefore be simplified to:
| (4) |
As illustrated in Figure 1, only the middle sample – i.e. sample number (N+1)/2 – of y is retained as the filtered output to replace the sample of interest, α, at the corresponding image location in the final filtered image. Therefore, the output filter value simplifies to the weighting function output value multiplied by the sample of interest:
| (5) |
The final filtered image is subsequently produced by repeating for all samples in the frame of echo data (blocks E through I).
In SVF, the weighting coefficient, w is obtained from the singular value spectra of the matrix X and is formed using statistical assumptions regarding the source signals of interest – i.e. tissue, free microbubbles, and adherent microbubbles. The shape of the singular value spectra provides information regarding the statistical dimensionality of the input matrix X where a flat spectra indicates high dimensionality and a steep spectra indicates low dimensionality (Vautard and Ghil, 1989). If the first singular value is large and the remaining singular values are small, the matrix X can be accurately described by a single PCA basis function. In contrast, a flat spectra where all the singular values are similar in magnitude indicates that matrix X is more disordered and requires many basis functions to represent the information within X. In the context of pre-processed ultrasound echo data, matrix X possesses higher dimensionality with larger amounts of electronic noise, object motion, non-linear reflections, or decorrelation. To parameterize the shape of the singular value spectra, a quantity called the normalized singular spectrum area (NSSA) is computed:
| (6) |
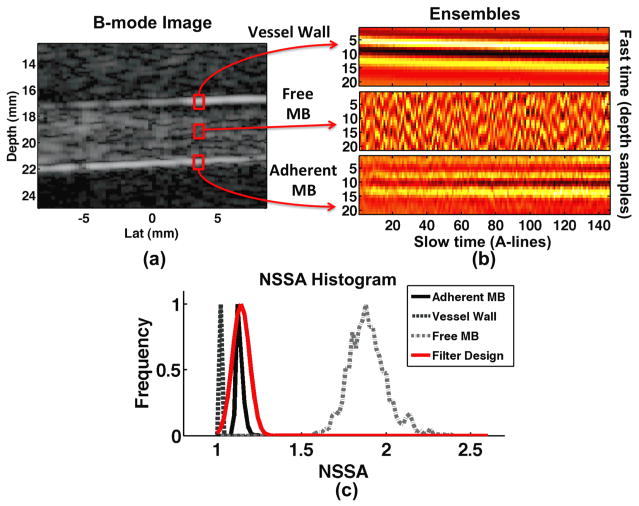
Thus a high NSSA value indicates high statistical dimensionality – flat spectrum – while a low NSSA indicates low dimensionality – steep spectrum. The design of the weighting function is then derived from statistical assumptions common to all real-time targeted molecular imaging strategies including: 1) microbubbles exhibit larger amounts of harmonic reflections than tissue and 2) adherent microbubbles exhibit less motion than free microbubbles. As a result, it is anticipated that tissue – low motion, low non-linear reflections – will exhibit the lowest NSSA followed by adherent microbubbles and finally free microbubbles – large motion, high non-linear reflections – which will exhibit the highest NSSA. Figure 2 illustrates example in vitro experimental results confirming these assumptions. Note that the “adherent microbubble” signal in physiologically relevant environments is actually the superposition of the adherent microbubbles with vessel wall. The ensembles of echo data that form matrix X, illustrated in Figure 2b, demonstrate higher dimensionality when centered on free microbubbles as compared to adherent microbubbles or tissue. The NSSA histogram in Figure 2c illustrates clear delineation of the three source signals along the NSSA domain. In order to isolate the adherent microbubble signal, a Gaussian shaped window function was used:
| (7) |
where parameters μand σ dictate the mean and width of the weighting function, respectively.
Figure 2.
Example in vitro phantom results illustrating vessel wall, free microbubble, and adherent microbubble signal component (a) location and (b) ensembles of un-processed echo data. (c) NSSA histograms from 0.2 mm × 5.1 mm regions of interest for each signal component. The weighting function, illustrated in red, is designed to span the NSSA expected from adherent microbubbles, illustrated in black.
B. Effects of acoustic target motion, echo correlation, and harmonic energy on normalized singular spectrum area
Simulations were performed in FIELD II (Jensen and Svendsen, 1992) to illustrate the relationship between physical characteristics of underlying acoustic targets (i.e. tissue and microbubbles) with the NSSA parameter used to isolate components in SiSTM imaging. As discussed in section II.A., SiSTM imaging assumes that the physical characteristics of adherent microbubble - less motion than free microbubbles and greater harmonics than tissue - results in an NSSA consistently between that of tissue and free microbubbles. The purpose of the simulation study was to confirm that greater motion and larger harmonic contributions do indeed result in echo data exhibiting larger NSSA. The relationship between axial displacement (i.e. along the axis of the acoustic beam), tissue-to-harmonic ratio, and echo correlation with NSSA was assessed in simulation.
Default simulation values are illustrated in Table 1. Ensembles of echo data with the desired motion, correlation, and harmonic characteristics were simulated in FIELD II by first creating a 2 cm × 2 cm × 1.5 cm volume of scatterers with a density greater than 9 scatterers per resolution cell to achieve fully-developed speckle statistics (Wagner et al., 1988). The volume of scatterers was centered about the focus of a simulated linear array transducer, using the xdc_linear_array function in FIELD II, with a 3 cm electronic focus, 300 μm pitch, and 5 mm element height. Pulse-echo ultrasound data was simulated using the calc_scat function at a sampling rate of 400 MHz, then downsampled to 40 MHz prior to computing NSSA values. A-line to A-line displacements were simulated by shifting the block of acoustic scatterers prior to each calculation. Echo correlation was simulated using the Cholesky factorization method described in detail by Mauldin et al (Mauldin et al., 2010). This method enabled simulation of ensembles of echo data with a pre-determined A-line to A-line correlation coefficient similar to the correlation of scatterers moving in to and out of the acoustic beam. Finally, while FIELD II is not capable of simulating non-linear acoustic wave propagation, ensembles of echo data with a pre-defined harmonic-to-tissue ratio could be simulated by superposition of simulated A-lines from a fundamental, 5 MHz pulse and a harmonic, 10 MHz pulse. The simulated ensembles were windowed across 10 periods of the fundamental frequency, or 80 depth samples at 40 MHz sampling rate, using 9 A-lines for each ensemble. The NSSA parameter was computed using the same SVF derived method as described above. Each simulation was repeated 20 times.
Table 1.
Default simulation parameters
| Simulation parameter | Default value |
|---|---|
|
| |
| Sampling frequency | 40 MHz |
| Center frequency | 5 MHz |
| Bandwidth | 50% |
| Displacement | ¼ periods/A-line |
| Differential motion | 0 periods/A-line |
| Echo correlation coefficient | 0.99 |
| Harmonic-to-fundamental ratio | − 30dB |
| Ensemble length | 9 A-lines |
| SVF window length | 10 periods |
C. In Vitro Flow Phantom Experiments
A flow phantom designed to mimic the acoustic and elastic properties of tissue as described in Hall et al (Hall et al., 1997) and with 4 mm diameter channel lumens, was constructed from 6.1% by weight gelatin (Type B, Fischer Scientific), 2.2% by weight agar (Acros Chemicals), and 1.8% by weight graphite particles (2 μm, Sigma-Aldrich) dissolved in water. Graphite was added to the mixture in order for the walls to exhibit reflective speckle of the same magnitude as the microbubble solution, producing a more realistic imaging environment. Channels were incubated for 3 hours with a 50 μg/mL streptavidin (Sigma-Aldrich) solution followed by a 3 hour incubation with bovine serum albumin (BSA, Sigma- Aldrich) to produced targeted channels. Non-targeted channels were incubated with BSA alone.
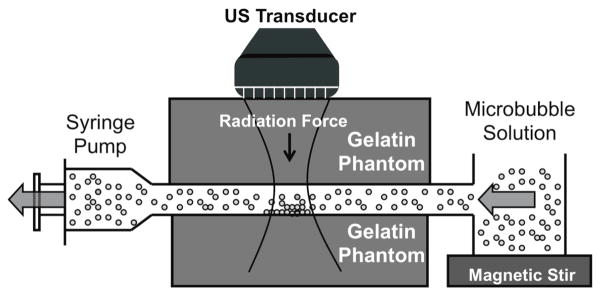
Molecularly targeted microbubbles were prepared as previously described by Klibanov et al (Klibanov et al., 2006). Briefly, a solution of biotinylated distearoyl phosphatidylcholine (Avanti Polar Lipids) and PEG40-sterate (Sigma-Aldrich) was sonicated in the presence of perfluorobutane and trace amounts of the flourophore, DiI (Molecular Probes, Eugene, OR). The resulting fluorescent biotinylated lipid shelled microbubbles had a mean diameter of 2.2 μm and were used at a concentration of 2 × 10⁶ microbubbles/mL. Experiments were performed by pulling the microbubble solution through the channel using a programmable syringe pump (PHD 2000, Harvard Apparatus, Holliston, MA, USA) at velocities of approximately 2.7 cm/s (Figure 3). SiSTM imaging sequences acquired while flowing deionized water alone was used as an additional control. The flow velocity and vessel diameter represent the average velocity over a heart cycle and the typical diameter of large human blood vessels (Ku, 1997; Kelly et al., 1989; Safar et al., 1981; Taylor et al., 2002). The microbubble solution was gently agitated prior to entering the flow phantom to ensure consistent concentrations.
Figure 3.
An illustration of in vitro flow phantom experimental apparatus.
SiSTM imaging sequences, described in the paragraph below, were performed over 4 trials for each of the targeted or non-targeted channels. SiSTM imaging sequences were applied for 1 minute at a frame rate of 5 Hz, while microbubbles were pulled through the phantom. Immediately after cessation of the imaging sequence, deionized water was flushed through the channel for 1 minute to remove any free microbubbles from the channel. Next, a high intensity bursting sequence was applied for 1 minute in order to rupture any remaining microbubbles and deposit the DiI fluorophore from the microbubble shell into the channel wall.
SiSTM imaging sequences were programmed on the Sonix RP (Ultrasonix, Richmond, BC) programmable ultrasound research scanner and compared to two frequency-based targeted molecular imaging approaches – pulse inversion with IIR low pass filtering (PI + IIR) and harmonic imaging with IIR low pass filtering (Harmonic + IIR). In order to directly compare imaging techniques using the same underlying ultrasound data, a single imaging sequence was created. As illustrated in Figure 1 blocks A and B, a 20 cycle 4 MHz center frequency acoustic radiation pulse was first transmitted. Next, a 2 cycle 5 MHz center frequency, to achieve higher resolution, imaging pulse was transmitted. Finally, an inverted but otherwise identical imaging pulse was transmitted. In the PI + IIR technique, received echo data from the pair of diagnostic pulses were summed using standard pulse inversion methods as described in Patil et al (Patil et al., 2009; Patil et al., 2011). In both SiSTM and Harmonic + IIR methods, received echo data from the second diagnostic pulse was discarded. In the Harmonic + IIR approach, a bandpass filter was applied to the received echo data to isolate the harmonic signal component centered at 10 MHz. For both Harmonic + IIR and PI + IIR, the low-pass IIR filter was a 9-tap IIR filter with coefficients optimized for similar phantom studies as described in Patil et al (Patil et al., 2011). The number of ensembles used in SVF was 3 times greater than is illustrated in Fig. 1. Instead of a 3 × 3 window, a 9 × 3 window was used with 9 samples in depth for each of 3 lateral positions. This spatial window size was chosen to approximately match the resolution of the ultrasound imaging system. Larger window sizes have the effect of decreasing standard deviation of NSSA values but also reducing imaging resolution. In order to enable useful comparison, the SiSTM imaging approach used ensembles of 9 A-lines for the SVF filtering steps as illustrated in Figure 1 blocks D–G. Therefore, the M and N parameters for the SVF filtering step as implemented in this manuscript were 27 and 9, respectively.
Targeted molecular images were formed using standard image display functions in MATLAB (MathWorks, Natick, MA) to superimpose the SiSTM, Harmonic + IIR, or PI + IIR image outputs over an underlying gray scale B-mode image. Adherent microbubbles signal from SiSTM, Harmonic + IIR, or PI + IIR were illustrated with a “hot” color mapping overlay, which was displayed using a linear mapping with a 30 dB dynamic range. The background gray scale B-mode image was formed from received echo data after bandpass filtering about the center frequency and displayed using a linear mapping and 55 dB dynamic range.
D. Optical confirmation of adherent microbubble signal
Fluorescence microscopy of the channel wall was performed in order to correlate the optical signal from the DiI with the ultrasound results, thus confirming the presence of adherent microbubbles. Immediately after the SiSTM imaging and bursting sequences were completed, the channels were extracted and sectioned through the central axis of the channel. The bottom half of the channel was then imaged en face using an inverted fluorescence microscope (IX51, Olympus) with a xenon lamp and Cy3 filter. Fluorescence images were acquired along the entire length of both the targeted and non-targeted channels. As an additional control, images from channels that did not undergo SiSTM imaging experiments, and thus had no adherent microbubble signal, were also obtained.
E. Quantitative Analysis
Quantitative analysis was performed on the acoustic data from the in vitro phantom experiments. To estimate sensitivity and specificity of SiSTM imaging to isolate adherent microbubbles, receiver operating characteristic (ROC) analysis (van Erkel and Pattynama, 1998) was performed. Four regions of interest (ROI) spanning 0.2 mm × 5.1 mm spatial areas over 10 consecutive image frames approximately 20 seconds after initiation of the SiSTM image sequence were identified. The dimensions of the ROI were chosen to match the approximate axial resolution of the imaging pulse and one quarter of lateral imaging span. For ROC analysis, the four ROI were considered either ‘true’ for presence of the desired target (i.e. adherent microbubbles) or ‘false’ for presence of the desired target (i.e. free microbubbles, tissue, and vessel wall). The ROI positions are illustrated in Figure 4. The adherent microbubble and free microbubble regions were derived from targeted experiments, while the vessel wall and tissue regions were derived from the water control experiments since it was known for certain that microbubble binding would not occur in water control experiments. ROC curves were calculated for SiSTM imaging, PI + IIR, Harmonic + IIR, and B-mode image data by computing a sensitivity and specificity for each threshold value. Threshold values were varied between − 500 dB and 0 dB with a 0.1 dB step size.
Figure 4.
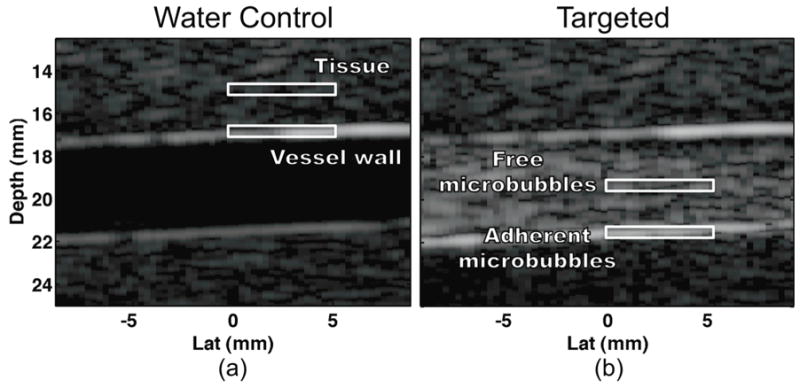
Locations corresponding to ROI for (a) tissue, vessel wall, (b) free microbubble, and adherent microbubble signal components. ROI were taken over 10 frames and a 0.2 mm × 5.1 mm spatial extent. Tissue and vessel wall ROI were acquired from water control experiments while microbubble ROI were acquired from targeted microbubble experiments.
Image contrast was computed in a similar manner using the same 0.2 mm × 5.1 mm ROI as used for ROC. Contrast was computed as:
| (8) |
where C is contrast in decibels (dB), M is the number of pixels within the ROI, and IA[j] is the jth pixel value within ROI A, where A and B represent one of the four ROI illustrated in Figure 4: tissue, vessel wall, free microbubble, adherent microbubble. Statistical significance was determined using a two-tailed student’s t-test (p < 0.05) in MATLAB.
III. Results
A. The effects of acoustic target motion, echo correlation, and harmonic energy on normalized singular spectrum area
As illustrated in Figure 5, statistical dimensionality, and thus NSSA values, of simulated ensembles were larger with increasing axial displacement and harmonic-to-fundamental amplitude ratio. NSSA decreased with increasing echo correlation. As confirmed by several groups, both adherent microbubbles and free microbubbles exhibit higher harmonic-to-fundamental amplitude ratios than tissue (Dejong et al., 1992; Hu et al., 2010; Patil et al., 2009; Zhao et al., 2006). However, free microbubbles exhibit greater displacement and larger amounts of decorrelation than adherent microbubbles. Together, these results provide a physical basis for the separation of signal components by NSSA properties whereby free microbubbles possess higher NSSA than adherent microbubbles and adherent microbubbles possess higher NSSA than tissue and vessel wall components.
Figure 5.
Simulation results illustrating the relationship between (a) axial displacement, (b) echo correlation, and (c) harmonic-to-fundamental reflection amplitude ratio with the NSSA parameter used to isolate adherent microbubbles in SiSTM imaging. For illustrative purposes, the x-axis in (b) is not drawn to scale. Open symbols represent the mean NSSA with error bar representing standard deviation over 20 trials.
B. The effects of imaging strategy on image contrast and the sensitivity and specificity of adherent microbubble signal isolation
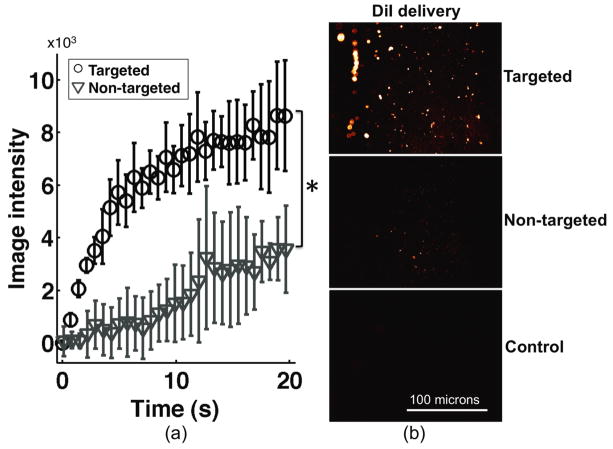
Growing accumulation of adherent microbubbles along the lower wall of the phantom channel between 0 s and 12 s was observed in in vitro phantom experiments (Figure 6). As illustrated in both Figure 6 and 7, average SiSTM image intensity in regions of adherent microbubble were significantly larger in targeted versus non-targeted groups at approximately 20 s after initiation of SiSTM imaging sequences (P < 0.05). En face fluorescence microscopy of the lower phantom channel wall, illustrated in Figure 7b, confirmed deposition of DiI after the SiSTM imaging and burst sequences. These images provide an independent measure of the relative quantity of adherent microbubbles along the lower phantom channel wall and confirmed the same trends as observed in the SiSTM imaging results – targeted experiments possessed the largest amount of adherent microbubble signal followed by non-targeted and control.
Figure 6.
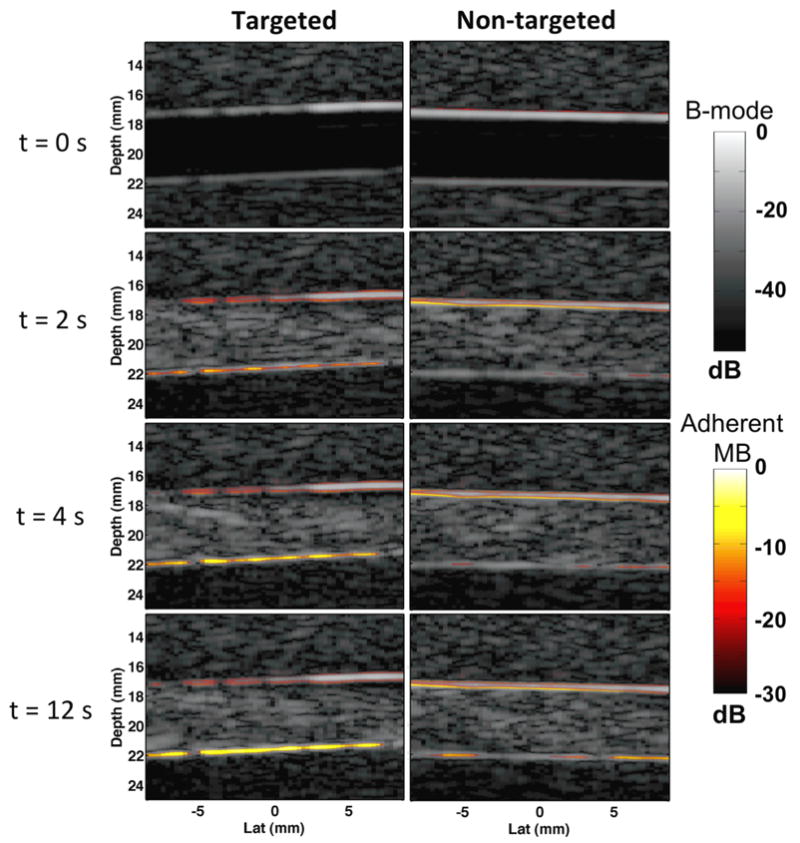
Example in vitro gelatin phantom images acquired using the proposed SiSTM imaging technique at times 0 s, 2 s, 4 s, and 12 s after simultaneous injection of microbubble solution and initiation of the SiSTM imaging sequence. Targeted microbubble experiments (left) used biotinylated microbubbles targeted to streptavidin coated channel walls. Non-targeted experiments (right) used biotinylated microbubbles and BSA blocked channel walls. SiSTM image output indicative of adherent microbubble signal are illustrated by the “hot” color mapping overlay, which is displayed using a linear mapping with a 30 dB dynamic range. The background gray scale B-mode image was formed from received echo data prior to SVF filtering and was displayed using a linear mapping and 55 dB dynamic range.
Figure 7.
(a) Average ultrasound image intensity curves over four runs using the SiSTM imaging technique for targeted and non-targeted experiments. Intensity values for each trial were computed from 0.2 mm × 5.1 mm adherent microbubble ROI illustrated in Figure 4b. SiSTM imaging intensity values in targeted experiments were significantly higher than for non-targeted experiments. Water control results are not displayed in (a) but possessed essentially no change in intensity values above the noise. (b) Representative en face fluorescence microscopy images of DiI signal from targeted (top), non-targeted (middle), and water control (bottom) experiments. The relative DiI signal qualitatively correlates with the degree of adherent microbubble signal measured from SiSTM imaging. * indicates statistical difference using a two-tailed student’s t-test (p < 0.05).
In vitro experimental results, summarized in Figure 8, demonstrate significantly larger image contrast between adherent microbubbles and vessel wall and adherent microbubbles to free microbubble when using SiSTM imaging as compared to B-mode, Harmonic + IIR, and PI + IIR approaches (vessel wall p < 0.001, free microbubble p < 0.0001). While SiSTM imaging also yielded larger adherent microbubble to tissue contrast, it was not found to be statistically significant. Similarly, Figure 9 indicates significantly better sensitivity and specificity for the SiSTM imaging method compared with the alternative approaches in terms of area under the ROC curve (AUC) analysis (p < 0.05). Example images in Figure 10 qualitatively illustrate gains in contrast, sensitivity, and specificity when imaging with the SiSTM imaging technique compared with Harmonic + IIR and PI + IIR.
Figure 8.
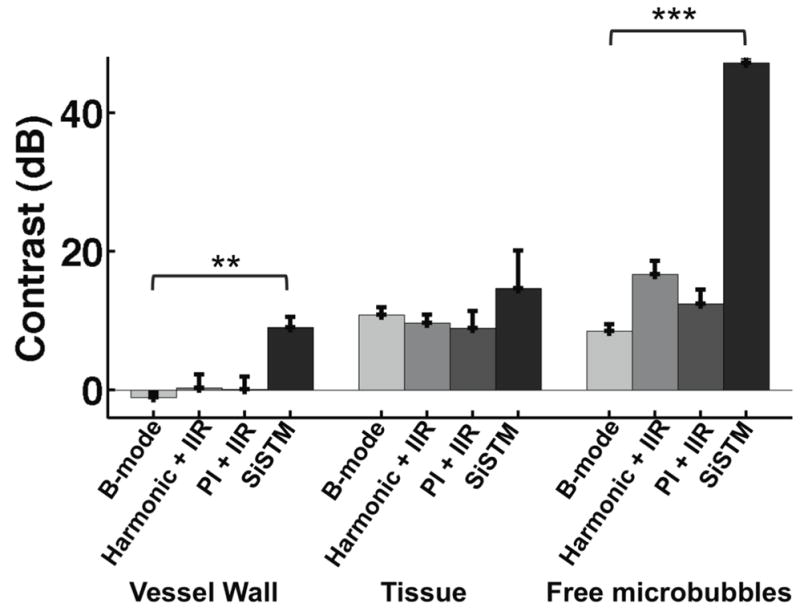
Average image contrast between adherent microbubbles and vessel wall, tissue, and free microbubbles for B-mode, Harmonic + IIR, PI + IIR, and SiSTM imaging techniques. Error bars represent standard deviation of contrast results over 4 trials. Statistical significance between SiSTM imaging and other imaging techniques denoted by ** (p < 0.001) and *** (p < 0.0001) respectively.
Figure 9.
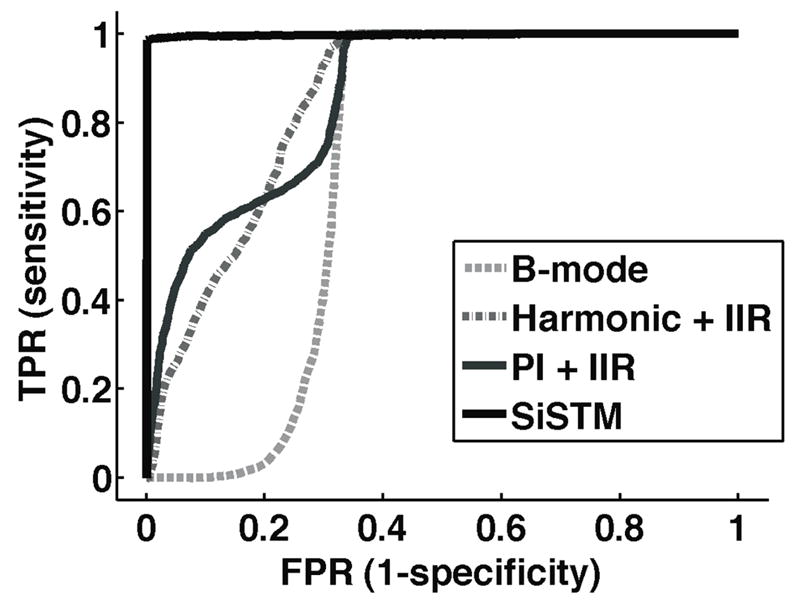
Average ROC curves for B-mode, Harmonic + IIR, PI + IIR, and SiSTM imaging techniques. ROC curves were formed by first defining the adherent microbubble ROI as ‘true’ and all other component ROI as ‘false’. Next, the threshold at which a given pixel was classified as ‘true’ for adherent microbubble was varied between 500 dB and 0 dB at a 0.1 dB step size. Each point on the curve represents the true positive rate (TPR) and the false positive rate (FPR) measurement for the image ROI at each threshold value. Area under the ROC curve (AUC) derived from SiSTM results were significantly larger (p < 0.05) than alternative approaches.
Figure 10.
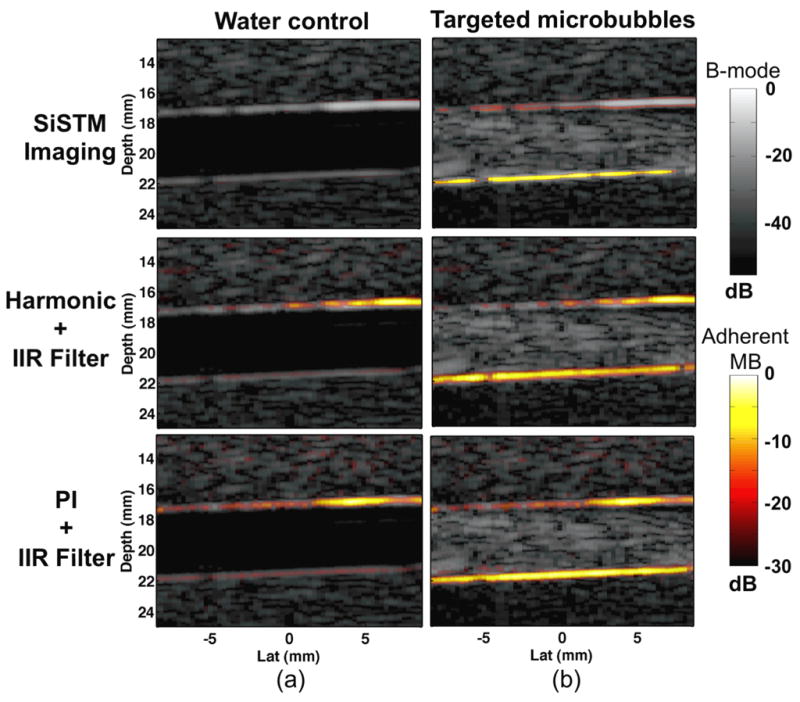
Representative in vitro phantom results from (a) control and (b) targeted microbubble experiments for (top) SiSTM imaging, (middle) Harmonic + IIR, and (bottom) PI + IIR methods. Adherent microbubble signal data detected from the three targeted molecular imaging approaches are illustrated with the “hot” color mapping overlay, which is displayed using a linear mapping with 30 dB dynamic range. The background gray scale B-mode image was formed from received echo data prior to filtering and was displayed using a linear mapping and 55 dB dynamic range.
IV. Discussion
Real-time ultrasound-based targeted molecular imaging in large blood vessels, with high sensitivity and specificity, has the potential to improve early detection of medical conditions that include: atherosclerosis, precursors to stroke and cancer. However, current frequency-based approaches, such as those based on a combination of CPS, harmonic imaging, and Doppler-based slow-time filtering methods, possess limitations that can preclude high sensitivity and specificity for adherent microbubble signal when implemented in large artery imaging. Specifically, these approaches are not able to separate signal components with overlapping frequency content and are degraded by pulse to pulse physiological motion and noise due to the requirement for low transmit pressures. In this paper, an alternative approach, termed singular spectrum-based targeted molecular (SiSTM) imaging, was presented. This method is a PCA-based technique that does not rely on separation of signal components in the frequency domain, low transmit pressures to maintain linear wave propagation (e.g. CPS), or absence of pulse-to-pulse tissue motion. Instead, the approach uses the local statistical properties of ensembles of received echo data to isolate regions of adherent microbubbles based on their statistical dimensionality as quantified by its NSSA signature.
Simulation results demonstrated in Figure 5 illustrated trends in NSSA from ensembles of echo data with varied underlying motion and harmonic characteristics. Results supported experimental observations illustrated in Figure 2 where NSSA is largest for free microbubbles, followed by adherent microbubbles, and smallest for tissue. While both adherent and free microbubbles exhibit harmonic responses, free microbubbles exhibit greater displacement and lower echo correlation. Both experimental and simulation results demonstrate that these characteristics lead to larger NSSA. Tissue structures, such as vessel walls, exhibit both lower harmonic response and less motion, resulting in a lower NSSA (Figure 5). It may be noticed that the NSSA values in simulation were generally larger than those illustrated from experimental results in Figure 2. This result is due to the use of a larger number of ensembles for NSSA calculations in simulation versus experiment (80 versus 27, respectively). As previously discussed, the result of larger window sizes in computing NSSA is lower variability and high NSSA values, but the trade-off is decreased resolution. As a result, windows were restricted to 27 ensembles in experiments while larger windows could be used in simulation for the purpose of illustrating trends.
In vitro experimental results demonstrated the performance of SiSTM imaging under flow conditions relevant for large blood vessel imaging. Under targeted imaging conditions, where the channel wall was incubated in streptavidin, a large adherent microbubble signal was observed relative to the non-targeted experiments (Figure 6). This trend was quantitatively assessed in Figure 7a where average image intensity was tracked through experimental time over the 0.2 mm × 5.1 mm adherent microbubble ROI (ROI location illustrated in Figure 4). In agreement with qualitative trends from Figure 6, Figure 7a shows that biotinylated microbubbles adhered to the lower channel wall in greater quantities when molecular targeting, via streptavidin, occurred. This result was confirmed by fluorescence microscopy as shown in Figure 7b. While Figure 7a shows non-targeted signal that was approximately half of the targeted case, Figure 7b qualitatively shows DiI signal from non-targeted experiments that was much lower than half of the signal from targeting. These results suggest that microbubbles along the vessel wall were cleared following the water flushing phase to a larger degree in the non-targeted channel than the targeted channel. This was expected as targeted microbubbles that are molecularly bound to a ligand, as in the targeted channel, are less likely to be cleared after water flushing.
While SiSTM imaging results (Figure 6) generally agree with optical confirmation of adherent microbubbles, there exist a strong adherent microbubble signal along the top channel wall in the non-targeted experiments (Figure 6b). While Figure 7 confirms the existence of adherent microbubble in non-targeted experiments, it is unlikely that a high concentration would accumulate along the top wall. Therefore, it is likely that at least portions of the strong SiSTM response illustrated in Figure 6b are due to false positive detection. A likely cause of false positives is due to NSSA response from transition regions of the image. For instance, at windowed image locations straddling free microbubbles (high NSSA) and vessel wall (low NSSA), the output NSSA value is a combination of the two components, and therefore, these regions possess the potential for NSSA overlap with that of adherent microbubbles. Overcoming this limitation will require future enhancements to the current SiSTM imaging strategy.
Figure 10 demonstrates example images rendered from the SiSTM imaging technique compared with the Harmonic + IIR and PI + IIR alternatives. The results were produced from the same underlying data with the exception that PI + IIR used an additional inverted diagnostic imaging pulse to perform the PI step. The SiSTM imaging technique demonstrated less false positive measurements in the water control images compared with the alternative methods. In these images, no microbubbles were introduced into the phantom channel, and therefore, no molecular imaging signal (indicated by the ‘hot’ color mapping) should be observed. It is significant to notice that both Harmonic + IIR and PI + IIR show strong false adherent microbubble detection along the top channel wall in locations where the channel wall reflects most strongly. Past studies have demonstrated challenges in rejecting vessel wall signal with harmonic and/or PI based approaches in large vessel imaging environments (Patil et al., 2009; Patil et al., 2011; Hu et al., 2010). Because harmonic and CPS techniques rely on harmonic signal generated from microbubbles only, strong reflections from vessel wall regions that generate harmonics are challenging or impossible to eliminate. SiSTM imaging, however, separates the components according to their statistical dimensionality, and therefore, does not suffer from this particular limitation.
Average contrast and ROC curves in Figures 8 and 9 summarize the trends observed from example images in Figure 10. SiSTM imaging exhibited larger image contrast and greater AUC compared with the alternative techniques. All of these measurements with the exception of the adherent microbubbles to tissue contrast were significant.
Improvements in both ultrasound system instrumentation and software implementation are required for clinical use of the proposed imaging methods. Instrumentation used in the present study enabled collection of image data at real-time frame rates, but did not allow for on-line image processing and display. In addition, data storage to the Sonix RP hard drive precluded frame rates above 10 Hz whereas 30+ Hz frame rates are achievable if data storage limitations are removed. Computational cost must also be considered when assessing real-time implementation of filtering steps in SiSTM imaging. The singular value decomposition (SVD) step in SVF is by far the most intensive computation in either technique with each SVD representing N3 operations (Yu and Lovstakken, 2010). Even without optimization, which has been shown to achieve dramatically reduced SVD computational cost (Lovstakken et al., 2006; Chonavel et al., 2003; Mauldin et al., 2010), the SVF technique can be implemented, using dedicated hardware (e.g. GPUs), to produce frame rates greater than 30 Hz. For example, using a 1 GHz processor, greater than 88 frames/s can be achieved assuming 4 flops per cycle and the same SiSTM imaging parameters and conditions used in this study.
While the SiSTM imaging approach described in this paper has been developed for a large blood vessel environment, the efficacy of the technique in small vessels (i.e. < 200 μm diameter), such as required in many ultrasound-based drug delivery applications, remains an open question to be explored in future work. Because the fundamental assumptions regarding the respective source signals (i.e. highest NSSA for free microbubbles, moderate for adherent microbubbles, and lowest for tissue) is unlikely to change between large and small vessels, the authors anticipate that SiSTM imaging will possess similar efficacy. In addition, the SiSTM imaging implementation described in this paper used filter parameters that were chosen using a priori knowledge of the NSSA associated with the source signals of interest, and was therefore not an adaptive technique. While creating an adaptive SiSTM technique is not necessarily required for clinical utility – several common ultrasound filtering techniques are not adaptive (e.g. Doppler wall filtering, compounding, etc) – the development of an adaptive approach is appealing as it can enable implementation of the technique in an operator-independent, and therefore more robust, manner. In future work, we plan to investigate the possible use of automated histogram thresholding or clustering approaches to test adaptive SiSTM imaging strategies. In future work, we also plan to implement SiSTM imaging on a high performance programmable imaging system before validating the approach in vivo using a rabbit model for cardiovascular disease.
V. Conclusion
A new real-time targeted molecular imaging strategy, termed the singular spectrum-based targeted molecular (SiSTM) imaging, was introduced. The strategy performs signal isolation based on statistical dimensionality rather than frequency spectra. As a result, signal components with overlapping frequency spectra, such as microbubbles and strongly reflecting vessel wall, can be separated. The method was illustrated in linear acoustic wave simulations where it was demonstrated that larger displacement, higher harmonics, and lower echo correlation resulted in higher statistical dimensionality as quantified by the normalized singular spectrum area (NSSA) parameter. These results, in conjunction with experimental observations, informed the design of the weighting parameter, which retained signal from regions of echo data with an NSSA characteristic of adherent microbubbles. In vitro phantom channel experiments with physiologically relevant channel diameters were conducted. Results from SiSTM imaging and fluorescence microscopy demonstrated increased presence of adherent microbubbles from targeted versus non-targeted experiments. More importantly, SiSTM imaging demonstrated enhanced isolation of adherent microbubble signal, especially when rejecting strong channel wall reflections. Results over 4 trials showed a significant increase in contrast, sensitivity, and specificity with SiSTM imaging compared with alternative techniques based on frequency separation, such as PI + IIR and Harmonic + IIR.
Acknowledgments
We gratefully acknowledge our source of funding, the National Institutes of Health NIBIB R01 Grant EB001826.
References
- Brock-Fisher G, Poland M, Rafter P. US Patent # 5577505 Means for increasing sensitivity in nonlinear ultrasound imaging systems. 1996
- Chonavel T, Champagne B, Riou C. Fast adaptive eigenvalue decomposition: a maximum likelihood approach. Signal Processing. 2003;83:307–24. [Google Scholar]
- Collingridge DR, Carroll VA, Glaser M, Aboagye EO, Osman S, Hutchinson OC, Barthel H, Luthra SK, Brady F, Bicknell R, Price P, Harris AL. The development of I-124 iodinated-VG76e: A novel tracer for imaging vascular endothelial growth factor in vivo using positron emission tomography. Cancer Research. 2002;62:5912–9. [PubMed] [Google Scholar]
- Dayton P, Klibanov A, Brandenburger G, Ferrara K. Acoustic radiation force in vivo: A mechanism to assist targeting of microbubbles. Ultrasound in Medicine and Biology. 1999;25:1195–201. doi: 10.1016/s0301-5629(99)00062-9. [DOI] [PubMed] [Google Scholar]
- Dayton PA, Allen JS, Ferrara KW. The magnitude of radiation force on ultrasound contrast agents. Journal of the Acoustical Society of America. 2002;112:2183–92. doi: 10.1121/1.1509428. [DOI] [PubMed] [Google Scholar]
- Dejong N, Hoff L, Skotland T, Bom N. Absorption and scatter of encapsulated gas filled microspheres - theoretical considerations and some measurements. Ultrasonics. 1992;30:95–103. doi: 10.1016/0041-624x(92)90041-j. [DOI] [PubMed] [Google Scholar]
- Deshpande N, Needles A, Willmann JK. Molecular ultrasound imaging: current status and future directions. Clinical Radiology. 2010;65:567–81. doi: 10.1016/j.crad.2010.02.013. [DOI] [PMC free article] [PubMed] [Google Scholar]
- Eckersley RJ, Chin CT, Burns PN. Optimising phase and amplitude modulation schemes for imaging microbubble contrast agents at low acoustic power. Ultrasound in Medicine and Biology. 2005;31:213–9. doi: 10.1016/j.ultrasmedbio.2004.10.004. [DOI] [PubMed] [Google Scholar]
- Ferrara K, Pollard R, Borden M. Ultrasound microbubble contrast agents: Fundamentals and application to gene and drug delivery. Annual Review of Biomedical Engineering. 2007;9:415–47. doi: 10.1146/annurev.bioeng.8.061505.095852. [DOI] [PubMed] [Google Scholar]
- Gessner RLM, Lee M, Tsuruta J, Foster FS, Dayston PA. Radiation force-enhanced targeted imaging and near real-time molecular imaging using a dual-frequency high-resolution transducer. IEEE Ultrason Symp. 2009:9–12. [Google Scholar]
- Hall TJ, Bilgen M, Insana MF, Krouskop TA. Phantom materials for elastography. Ieee Transactions on Ultrasonics Ferroelectrics and Frequency Control. 1997;44:1355–65. [Google Scholar]
- Hu X, Zheng H, Kruse DE, Sutcliffe P, Stephens DN, Ferrara KW. A Sensitive TLRH Targeted Imaging Technique for Ultrasonic Molecular Imaging. Ieee Transactions on Ultrasonics Ferroelectrics and Frequency Control. 2010;57:305–16. doi: 10.1109/TUFFC.2010.1411. [DOI] [PMC free article] [PubMed] [Google Scholar]
- Jensen JA, Svendsen NB. Calculation of pressure fields from arbitrarily shaped, apodized, and excited ultrasound transducers. Ieee Transactions on Ultrasonics Ferroelectrics and Frequency Control. 1992;39:262–7. doi: 10.1109/58.139123. [DOI] [PubMed] [Google Scholar]
- Kaufmann BA, Sanders JM, Davis C, Xie A, Aldred P, Sarembock IJ, Lindner JR. Molecular imaging of inflammation in atherosclerosis with targeted ultrasound detection of vascular cell adhesion molecule-1. Circulation. 2007;116:276–84. doi: 10.1161/CIRCULATIONAHA.106.684738. [DOI] [PubMed] [Google Scholar]
- Kelly R, Hayward C, Avolio A, Orourke M. Noninvasive determination of age-related-changes in the human arterial pulse. Circulation. 1989;80:1652–9. doi: 10.1161/01.cir.80.6.1652. [DOI] [PubMed] [Google Scholar]
- Klibanov AL. Ultrasound molecular imaging with targeted microbubble contrast agents. Journal of Nuclear Cardiology. 2007;14:876–84. doi: 10.1016/j.nuclcard.2007.09.008. [DOI] [PubMed] [Google Scholar]
- Klibanov AL, Rychak JJ, Yang WC, Alikhani S, Li B, Acton S, Lindner JR, Ley K, Kaul S. Targeted ultrasound contrast agent for molecular imaging of inflammation in high-shear flow. Contrast Media & Molecular Imaging. 2006;1:259–66. doi: 10.1002/cmmi.113. [DOI] [PubMed] [Google Scholar]
- Kornmann LM, Reesink KD, Reneman RS, Hoeks APG. Critical appraisal of targeted ultrasound contrast agents for molecular imaging in large arteries. Ultrasound in Medicine and Biology. 2010;36:181–91. doi: 10.1016/j.ultrasmedbio.2009.09.009. [DOI] [PubMed] [Google Scholar]
- Ku DN. Blood flow in arteries. Annual Review of Fluid Mechanics. 1997;29:399–434. [Google Scholar]
- Leong-Poi H, Christiansen J, Klibanov AL, Kaul S, Lindner JR. Noninvasive assessment of angiogenesis by ultrasound and microbubbles targeted to alpha(v)-integrins. Circulation. 2003;107:455–60. doi: 10.1161/01.cir.0000044916.05919.8b. [DOI] [PubMed] [Google Scholar]
- Lindner JR, Song J, Christiansen J, Klibanov AL, Xu F, Ley K. Ultrasound assessment of inflammation and renal tissue injury with microbubbles targeted to P-selectin. Circulation. 2001;104:2107–12. doi: 10.1161/hc4201.097061. [DOI] [PubMed] [Google Scholar]
- Lovstakken L, Bjaerum S, Kristoffersen K, Haaverstad R, Torp H. Real-time adaptive clutter rejection filtering in color flow imaging using power method iterations. Ieee Transactions on Ultrasonics Ferroelectrics and Frequency Control. 2006;53:1597–608. doi: 10.1109/tuffc.2006.1678188. [DOI] [PubMed] [Google Scholar]
- Mauldin FW, Jr, Lin D, Hossack JA. The Singular Value Filter: A General Filter Design Strategy for PCA-Based Signal Separation in Medical Ultrasound Imaging. Ieee Transactions on Medical Imaging. 2011;30:1951–64. doi: 10.1109/TMI.2011.2160075. [DOI] [PMC free article] [PubMed] [Google Scholar]
- Mauldin FW, Viola F, Walker WF. Complex principal components for robust motion estimation. Ultrasonics, Ferroelectrics and Frequency Control, IEEE Transactions on. 2010;57:2437–49. doi: 10.1109/TUFFC.2010.1710. [DOI] [PMC free article] [PubMed] [Google Scholar]
- Mor-Avi V, Caiani EG, Collins KA, Korcarz CE, Bednarz JE, Lang RM. Combined assessment of myocardial perfusion and regional left ventricular function by analysis of contrast-enhanced power modulation images. Circulation. 2001;104:352–7. doi: 10.1161/01.cir.104.3.352. [DOI] [PubMed] [Google Scholar]
- Needles A, Couture O, Foster FS. A method for differentiating targeted microbubbles in real time using subharmonic micro-ultrasound and interframe filtering. Ultrasound in Medicine and Biology. 2009;35:1564–73. doi: 10.1016/j.ultrasmedbio.2009.04.006. [DOI] [PubMed] [Google Scholar]
- Patil AV, Rychak JJ, Allen JS, Klibanov AL, Hossack JA. Dual frequency method for simultaneous translation and real-time imaging of ultrasound contrast agents within large blood vessels. Ultrasound in Medicine and Biology. 2009;35:2021–30. doi: 10.1016/j.ultrasmedbio.2009.07.003. [DOI] [PMC free article] [PubMed] [Google Scholar]
- Patil AV, Rychak JJ, Klibanov AL, Hossack JA. Real-Time Technique for Improving Molecular Imaging and Guiding Drug Delivery in Large Blood Vessels: In Vitro and Ex Vivo Results. Molecular Imaging. 2011;10:238–47. doi: 10.2310/7290.2011.00002. [DOI] [PMC free article] [PubMed] [Google Scholar]
- Phillips P. Contrast pulse sequences (CPS): imaging nonlinear microbubbles. Ultrasonics Symposium; 2001; IEEE. 2001. pp. 1739–45. [Google Scholar]
- Phillips P, Gardner E. Contrast-agent detection and quantification. European Radiology. 2004;14:P4–P10. [PubMed] [Google Scholar]
- Pochon S, Tardy I, Bussat P, Bettinger T, Brochot J, von Wronski M, Passantino L, Schneider M. BR55: A Lipopeptide-Based VEGFR2-Targeted Ultrasound Contrast Agent for Molecular Imaging of Angiogenesis. Investigative Radiology. 2010:4589–95. doi: 10.1097/RLI.0b013e3181c5927c. [DOI] [PubMed] [Google Scholar]
- Ross R. The pathogenesis of atherosclerosis - a perspective for the 1990s. Nature. 1993;362:801–9. doi: 10.1038/362801a0. [DOI] [PubMed] [Google Scholar]
- Rychak JJ, Klibanov AL, Hossack JA. Acoustic radiation force enhances targeted delivery of ultrasound contrast microbubbles: In vitro verification. Ieee Transactions on Ultrasonics Ferroelectrics and Frequency Control. 2005;52:421–33. doi: 10.1109/tuffc.2005.1417264. [DOI] [PubMed] [Google Scholar]
- Rychak JJ, Klibanov AL, Ley KF, Hossack JA. Enhanced targeting of ultrasound contrast agents using acoustic radiation force. Ultrasound in Medicine and Biology. 2007;33:1132–9. doi: 10.1016/j.ultrasmedbio.2007.01.005. [DOI] [PubMed] [Google Scholar]
- Rychak JJ, Lindner JR, Ley K, Klibanov AL. Deformable gas-filled microbubbles targeted to P-selectin. Journal of Controlled Release. 2006;114:288–99. doi: 10.1016/j.jconrel.2006.06.008. [DOI] [PubMed] [Google Scholar]
- Safar ME, Peronneau PA, Levenson JA, Totomoukouo JA, Simon AC. Pulsed Doppler: diameter, blood flow velocity and volumic flow of the brachial artery in sustained essential hypertension. Circulation. 1981;63:393–400. doi: 10.1161/01.cir.63.2.393. [DOI] [PubMed] [Google Scholar]
- Simpson DH, Chin CT, Burns PN. Pulse inversion Doppler: A new method for detecting nonlinear echoes from microbubble contrast agents. Ieee Transactions on Ultrasonics Ferroelectrics and Frequency Control. 1999;46:372–82. doi: 10.1109/58.753026. [DOI] [PubMed] [Google Scholar]
- Song J, Christiansen J, Klibanov AL, Ley K, Kaul S, Lindner JR. Adhesion of P-selectin-targeted microbubbles to venules: Implications for imaging inflammation. Journal of the American College of Cardiology. 2001;37:383A-A. [Google Scholar]
- Takalkar AM, Klibanov AL, Rychak JJ, Lindner JR, Ley K. Binding and detachment dynamics of microbubbles targeted to P-selectin under controlled shear flow. Journal of Controlled Release. 2004;96:473–82. doi: 10.1016/j.jconrel.2004.03.002. [DOI] [PubMed] [Google Scholar]
- Taylor CA, Cheng CP, Espinosa LA, Tang BT, Parker D, Herfkens RJ. In vivo quantification of blood flow and wall shear stress in the human abdominal aorta during lower limb exercise. Annals of Biomedical Engineering. 2002;30:402–8. doi: 10.1114/1.1476016. [DOI] [PubMed] [Google Scholar]
- van Erkel AR, Pattynama PMT. Receiver operating characteristic (ROC) analysis: Basic principles and applications in radiology. European Journal of Radiology. 1998;27:88–94. doi: 10.1016/s0720-048x(97)00157-5. [DOI] [PubMed] [Google Scholar]
- Vautard R, Ghil M. Singular spectrum analysis in nonlinear dynamics, with applications to paleoclimatic time-series. Physica D. 1989;35:395–424. [Google Scholar]
- Villanueva FS, Jankowski RJ, Klibanov S, Pina ML, Alber SM, Watkins SC, Brandenburger GH, Wagner WR. Microbubbles targeted to intercellular adhesion molecule-1 bind to activated coronary artery endothelial cells. Circulation. 1998;98:1–5. doi: 10.1161/01.cir.98.1.1. [DOI] [PubMed] [Google Scholar]
- Wagner RF, Insana MF, Smith SW. Fundamental correlation lengths of coherent speckle in medical ultrasonic images. Ieee Transactions on Ultrasonics Ferroelectrics and Frequency Control. 1988;35:34–44. doi: 10.1109/58.4145. [DOI] [PMC free article] [PubMed] [Google Scholar]
- Weller GER, Villanueva FS, Klibanov AL, Wagner WR. Modulating targeted adhesion of an ultrasound contrast agent to dysfunctional endothelium. Annals of Biomedical Engineering. 2002;30:1012–9. doi: 10.1114/1.1513565. [DOI] [PubMed] [Google Scholar]
- Yu ACH, Lovstakken L. Eigen-Based clutter filter design for ultrasound color flow imaging: a review. Ieee Transactions on Ultrasonics Ferroelectrics and Frequency Control. 2010;57:1096–111. doi: 10.1109/TUFFC.2010.1521. [DOI] [PubMed] [Google Scholar]
- Zhao S, Borden M, Bloch SH, Kruse D, Ferrara KW, Dayton PA. Radiation-force assisted targeting facilitates ultrasonic molecular imaging. Molecular Imaging. 2004;3:135–48. doi: 10.1162/1535350042380317. [DOI] [PMC free article] [PubMed] [Google Scholar]
- Zhao S, Kruse DE, Ferrara KW, Dayton PA. Acoustic response from adherent targeted contrast agents. Journal of the Acoustical Society of America. 2006;120:EL63–EL9. doi: 10.1121/1.2364303. [DOI] [PMC free article] [PubMed] [Google Scholar]


