Abstract
Background
Hematocrit (Hct) is a common interferent in test strips used by diabetes patients to self-monitor blood glucose (BG), resulting in measurement bias. Described is an electrochemical BG monitoring system (OneTouch® Verio™) that uses a cofacial sensor design, soluble enzyme chemistry, and multiphasic waveform to effectively correct for patient Hct, delivering an accurate reading for whole BG.
Methods
The test strip comprises thin-film gold and palladium electrodes arranged cofacially and spatially separated with a thin spacer. Soluble glucose-sensing reagents are located on the lower palladium electrode and are hydrated on sample application. Blood glucose is oxidized by flavoprotein glucose dehydrogenase, with electron transfer via (reduced) potassium ferrocyanide mediator at the palladium electrode. Hematocrit levels are estimated by measuring oxidation of mediator diffusion to the upper gold electrode during the first portion of the assay. The Hct-corrected glucose levels are determined by an on-meter algorithm.
Results
In performance testing of blood samples at five glucose levels (30–560 mg/dl) and five Hct levels (19–61%), using 12 test meters and 3 test strip lots, 100% of results (N = 2700) met International Organization for Standardization accuracy criteria (within ± 15 mg/dl and ± 20% of reference results at glucose levels of <75 and ≥75 mg/dl, respectively). Furthermore, 99.9% (2698 of 2700) of results were within ±12 mg/dl and ± 15% of reference values at glucose levels <80 and ≥80 mg/dl, respectively.
Conclusions
The technology used in this system provides accurate BG measurements that are insensitive to Hct levels across the range 20–60%.
Keywords: hematocrit interference, potential-time waveform, self-monitoring of blood glucose, test strip design
Introduction
Self-monitoring of blood glucose (SMBG) employing simple-to-use, portable meters is a widely used method for patients with diabetes to facilitate improved disease management.1–6 Appropriate use can provide timely information on blood glucose (BG) levels with respect to the individual patient, such as dietary intake, exercise, and medication.7 The SMBG products on the market are subject to regulatory approval to demonstrate safety and effectiveness and must, therefore, adhere to clearly defined levels of performance.8 Device accuracy is a key component of performance and may be influenced by both extrinsic factors (e.g., temperature, altitude, humidity)9 and intrinsic factors (e.g., sample properties, interferents).10
Self-monitoring of blood glucose devices employ test strips incorporating dried sensing reagents in close proximity or intimate contact with a transducer that is typically electrochemically or optically based, for reasons of analytical performance, cost, and simplicity of use. However, such systems exhibit sensitivity toward hematocrit (Hct), the red blood cell (RBC) component of blood.11–14 Hematocrit levels, which are measured in terms of percentage volume fraction of whole blood, can vary significantly between individuals. Values are typically in the range of 36–53% in healthy individuals but can extend significantly beyond this range because of physiological and medical factors.15 A detailed study of distributions of Hct values observed in community, hospital, and critical care patient populations has been given by Lyon and Lyon.16
Self-monitoring of blood glucose devices measure whole blood, a complex medium of plasma and RBCs. Although glucose is distributed within both fractions, SMBG devices essentially interrogate plasma and thus are generally calibrated to yield a plasma glucose equivalent.17 Whole blood samples with Hct levels greater than the nominal condition, generally defined as 42% Hct, act to reduce the BG response, manifested as a negative bias when compared with laboratory reference methods.18 Conversely, for lower Hct values, the meter would record a positive bias relative to the reference. This phenomenon has been attributed to diffusion due to increased sample viscosity or the action of RBCs to impede plasma diffusion to the sensor reagent zone and to pore blockage in membrane-based devices.19
Several methods have been proposed to reduce or eliminate the Hct bias effect, generally based on one of two approaches: (a) compensatory, in which sample properties are directly interrogated in order to derive a measure of Hct loading and hence application of compensation factors,20,21 and (b) test strip design, in which structural features are integrated into the strip that serve to impede Hct interaction with the sensing mechanism.22,23
Compensatory methods are being increasingly applied to SMBG systems, as described by Musholt and colleagues,24 who describe an electrochemical test system that involves application of a complex waveform coupled to a mathematical interrogation of the resultant sensor output as a means of correcting for interfering factors, including Hct. Compensatory methods are primarily based on measurement of the electrical properties impedance, resistivity, and conductivity, directly resulting from the classical work of Fricke25 and later Cole and Cole26,27 on the electric resistance and capacitance of cells and cell suspensions. In the case of resistance measurements, RBC suspensions may be defined by the Maxwell–Fricke relationship, in which plasma and intercellular electrical resistances may be correlated to Hct levels.
The electrical measurement of Hct derives from the effect of particles on the measured resistance of a liquid; strictly, the measured quantity is the impedance, given that alternating current (AC) voltage is used to avoid electrolytic effects at the electrodes. The addition of particles that have higher resistivity than the suspending medium causes an increase in resistance measured between fixed electrodes (decreased conductivity). Maxwell28 originally studied suspensions of spherical particles and derived an equation relating bulk resistivity (resistance per unit length) to the resistivity of the individual components and the volume fraction occupied by the particles. In a suspension of multiple particle types, all particles contribute to the bulk resistivity according to their individual resistivity and volume fraction. The original equation was modified by Fricke and Curtis29–31 to account for nonspherical particles by inclusion of a form factor. Under these conditions, the equation simplifies to
where p is bulk resistivity, pm is resistivity of the medium, f is form factor, and v is volume fraction (%).
Furthermore, it has been shown that plasma resistance and cell membrane capacitance may both be related to erythrocyte sedimentation rates, which, in turn, may be determined by impedance measurements.32 Capacitance measurement of blood samples vary with Hct impedance, hence a measure of opposition to AC is often used to estimate the Hct level of a sample, allowing a corrective factor to be applied.
This article reports on the performance of a novel BG test strip with respect to Hct. The sensor design comprises cofacially arranged electrodes coupled to a complex electrochemical waveform and algorithm as a means of both measuring glucose and determining the diffusion of a key electroactive species within the sample chamber. Diffusion of this species is significantly influenced by its physicochemical properties and bulk sample characteristics, which, in turn, are directly influenced by the proportion of Hct present. This determination allows corrective factors to be applied to yield high-accuracy plasma BG values with reduced sensitivity to Hct.
Methods
Test Strip Design
The design of the OneTouch Verio BG test strip is shown in Figure 1. The test strip incorporates gold and palladium electrodes that are orientated in a cofacial manner. The dimensions of the two electrodes are defined and controlled during the manufacturing process by a die-punch process. The electrodes are separated from each other by a thin plastic spacer that has a nominal thickness of 95 mm. The glucose-sensitive reagents, citraconate buffer salts, potassium ferricyanide mediator, and flavoprotein glucose dehydrogenase, are laid down on the “bottom” palladium electrode. Flavoprotein glucose dehydrogenase enzyme was selected for its high substrate specificity and nonreactivity toward oxygen. The strip may be defined as a “side-fill strip,” because blood may be applied to the 400 nl sample chamber from either the left or the right side of the test strip (Figure 1). The levels of glucose in the sample are determined within 5 s, with the BG value being shown on the meter display in geographically appropriate units (mg/dl or mM).
Figure 1.
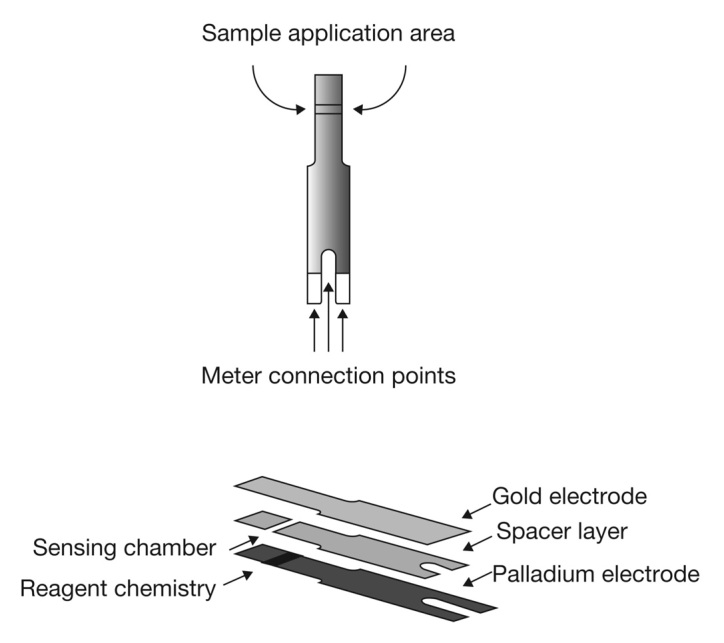
Architecture of the BG test strip.
Manufacturing process controls and built-in signal processing compensation mechanisms eliminate the need for user calibration coding, thus reducing the potential for user error. The meter uses a novel multipulse signal and has an improved glucose–Hct–temperature–antioxidant compensation algorithm for higher accuracy and precision over a wide range of blood samples. The test strip is designed to work with BG monitoring systems that are technically equivalent but have different user interfaces. The performance characteristics of these systems are summarized as follows: plasma equi-valent calibration, 0.4 ml sample size, flavoprotein glucose dehydrogenase enzyme, 20–600 mg/dl glucose range, 20–60% Hct range,33–35 10–90% humidity range (noncondensing), 6–44 °C temperature range, and up to 3048 m altitude use.
Preparation of Blood Samples
Venous blood from healthy volunteers was collected into Na-Heparin blood collection tubes. The “natural Hct level” of the blood was measured using a micro-Hct centrifuge (HemataSTAT-II by Separation Technology Inc., Sanford, FL) and capillary tubes. This instrument includes a built-in automatic tube reader and liquid crystal display to guide the operator through test procedure and result display. For Hct values that are greater than the natural value, the appropriate volume of plasma is removed from the sample (after centrifuging a 10 ml sample to sediment the RBCs). After careful mixing, the Hct values of the “adjusted” blood samples are measured using a HemataSTAT-II.
For samples with a required Hct value of less than “natural,” plasma is added to a sample of whole blood, effectively diluting the RBCs. The Hct value of these adjusted bloods (after mixing) is then measured as indicated earlier.
The glucose level of the blood samples is prepared by “spiking” the samples (2 ml sample of blood with a maximum spike volume of 0.04 ml) with a concentrated stock solution of glucose prepared in isotonic saline. The plasma concentration of glucose, after allowing the sample to equilibrate, is measured by first centrifuging the sample using a bench top centrifuge and presenting a sample of the resultant plasma to a YSI® 2700 SELECT™ glucose analyzer (YSI Inc., Yellow Springs, OH).
Hematocrit Performance
Three production batches of test strips were used in this study. Twelve replicates were obtained (with different meters) for each combination of strip lot/glucose/Hct level/donor blood. This resulted in 180 data points per test strip lot at each Hct level (5 glucose levels × 3 blood donors × 12 meters). Each of three donor venous blood samples was adjusted to five target Hct levels ranging from 19–61% and five target glucose levels (30, 65, 240, 450, and 560 mg/dl). Technicians performed tests with the BG monitoring system and comparison testing (against YSI 2700 SELECT) for each combination of blood donor, Hct level, and glucose level. The meter glucose results were converted to bias-to-YSI values, where absolute bias values (mg/dl) were used at the lowest two glucose levels (30 and 65 mg/dl) and percentage bias values were used at the three higher glucose levels. The number and percentage of accurate results were calculated for all BG monitoring system tests. The mean bias was calculated for each combination of glucose level and Hct for all donors, meters, and test strip lots.
Accuracy Assessment
The International Organization for Standardization (ISO) criterion for acceptable accuracy is ≥95% of BG monitoring system results falling within specified error tolerances.8 The study presented in this article assessed accuracy according to the ISO specification of error tolerance. Individual glucose results are considered accurate if they fall within ±15 mg/dl of the reference result at glucose concentrations <75 mg/dl or within ±20% at glucose concentrations ≥75 mg/dl. In addition, BG monitoring system results were assessed using the tighter accuracy criteria of ±12 mg/dl at glucose levels <80 mg/dl and within ±15% at glucose levels ≥ 80 mg/dl.
Results
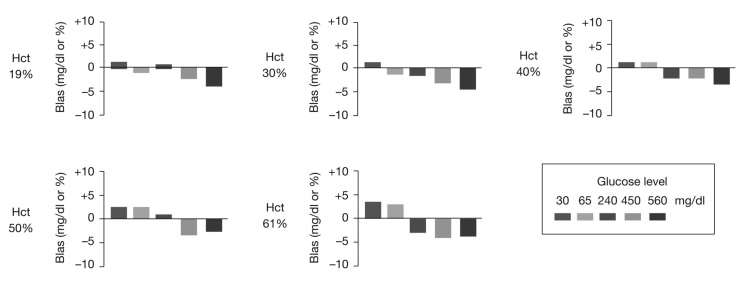
For all donors, Hct values, glucose levels, and test strip lots, 100% (2700 of 2700) of BG monitoring system results were within the ISO error tolerance boundaries (Figure 2). In addition, 99.9% (2698 of 2700) of results were within ±15% of reference result (glucose ≥ 80 mg/dl) or ±12 mg/dl (glucose < 80 mg/dl). The largest bias observed for an individual BG monitoring system result was -17.7% at 61% Hct and 560 mg/dl glucose. At each Hct level, mean bias trended from slightly positive to slightly negative as glucose concentration increased (Figure 3). None of the mean bias values was outside the range of ±5% (Table 1).
Figure 2.
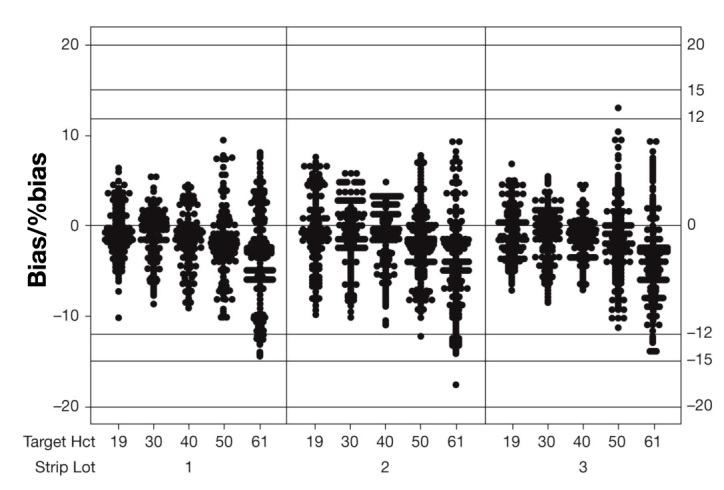
Individual value plot of bias/%bias. The individual bias values between 19% and 61% Hct (all glucose values pooled) are shown for the three individual batches.
Figure 3.
Blood glucose monitoring system Hct performance. Mean bias at each glucose and Hct level is shown. Bias is expressed as mg/dl for BG 30 and 65 mg/dl and as a percentage for 240–560 mg/dl. Each bar represents the mean bias of 108 results.
Table 1.
System Hematocrit Performancea
| BG concentrationb (mg/dl) | |||||
|---|---|---|---|---|---|
| Hct | 30 | 65 | 240 | 450 | 560 |
| 19% | 1.32 | –0.90 | 0.87 | –2.41 | –4.16 |
| 30% | 1.22 | –1.50 | –1.77 | –3.48 | –4.67 |
| 40% | 1.06 | 1.16 | –2.21 | –2.30 | –3.55 |
| 50% | 2.66 | 2.60 | 1.03 | –3.47 | –2.60 |
| 61% | 3.64 | 3.04 | –3.37 | –4.26 | –4.15 |
Mean bias breakdown by Hct level and glucose concentration (n = 108 per glucose/Hct combination).
Bias is expressed as mg/dl for BG 30 and 65 mg/dl and as a percentage for BG 240–560 mg/dl.
Discussion
A key component of the performance exhibited by this BG monitoring system in the presence of widely varying Hct levels is the application of a corrective algorithm based on diffusion of reaction components and interferents to each of the cofacially arranged electrodes, which behaves according to the fundamental “obstruction” principles first elucidated by Fricke.25 In these studies, Fricke examined the electric conductivity and capacitance of spheroids (oblates and prolates) dispersed in dog blood medium, with optimum results being obtained with spheres.
Increase of blood Hct results in a decrease in the apparent diffusion coefficients of molecules in the sample chamber due to the elevated levels of RBCs present. These blood cells act as impermeable barriers to freely diffusing solute molecules that must navigate around them, thereby increasing their diffusion paths. As both electrochemical and kinetic processes (the conversion of substrate to product and the reaction of reduced enzyme with mediator) are sensitive to diffusion, any decrease in the diffusion coefficients of reactants will result in a drop in signal. To help describe solvent diffusion in blood samples, models based on electric conductivity by Maxwell28 and Fricke25 [that assumes immobile impenetrable species (RBCs) suspended in a mobile solvent continuum (plasma) and predicts the maximum reasonable diffusion coefficient in the presence of obstructions when the obstructions are spheres] and models on tortuosity [the increased path length between two points due to obstructions (Figure 4)] in a simple cubic lattice by Mackie and Meares36 are often used. An account of these and other diffusion models is given by Masaro and Zhu.37
Figure 4.
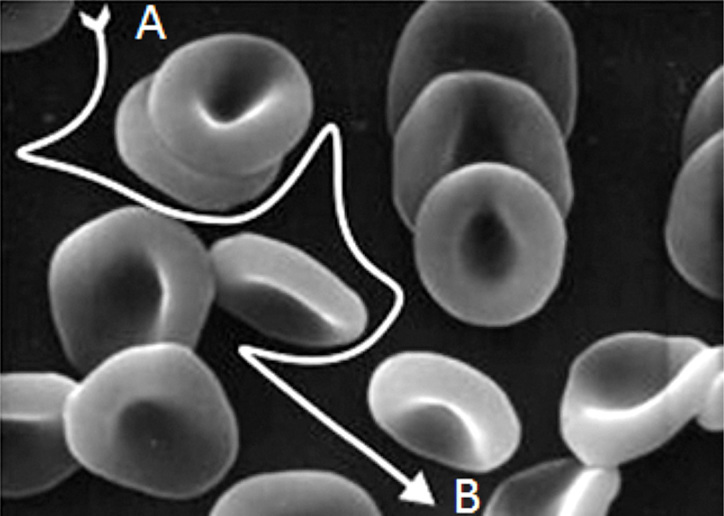
Schematic of tortuosity due to the presence of RBCs in a sample. A molecule, such as glucose, must follow an indirect path from A to B because of the presence of impenetrable barriers (the RBCs).
By considering these models, the effective diffusion constant in a hypothetical medium corresponding to the steady state of a two-phase composite consisting of a fluid with diffusion coefficient D0 and dispersed spheroids with zero diffusion is given by
where h is the volume fraction of the dispersed spheroids and m is a shape parameter varying between 0 and 1. For RBCs in plasma (i.e., whole blood treated as a two-phase composite) h corresponds to Hct, with m = 1/1.05 ≍ 0.952.25
Another important hydrodynamic property of blood that changes with Hct is viscosity (h). As Hct increases, there is a disproportionate increase in viscosity. For example, at a Hct of 40%, the relative viscosity is ∼4. At a Hct of 60%, the relative viscosity increases to ∼8. Therefore, a 50% increase in Hct from a normal value increases blood viscosity by approximately 100%. Such changes in Hct and blood viscosity can occur in patients with polycythemia. The magnitude of this effect can be calculated by considering the Stokes–Einstein equation38 and relating the predicted effect of viscosity on the diffusion coefficient to current via the well-known Cottrell equation. Hence it can be shown that the current response has a proportional relationship with respect to viscosity:
It follows, therefore, that a sensor device that can make an independent measurement of D(h) can make use of this to correct the measurement for the Hct value of the sample. The BG monitoring system described in this study corrects for Hct in the sample based on both strip design and the applied potential waveform and subsequent meter algorithm to calculate the glucose value in the sample.
As the reagent layer is applied only to the bottom palladium electrode, it is, therefore, spatially separated from the top gold electrode, which is essentially naked. During the first 4 s of the test, the gold electrode is polarized at +300 mV relative to the palladium electrode (Figure 5A). Consequently, during this phase of the test, the gold electrode serves as the anode, where reduced species may be oxidized to yield a measurable Faradaic current. During this phase of the test, the enzyme and mediator in the reagent layer turnover glucose in the sample, resulting in a local increase in the concentration of reduced mediator (ferrocyanide anion) close to the surface of the palladium electrode.
Figure 5.
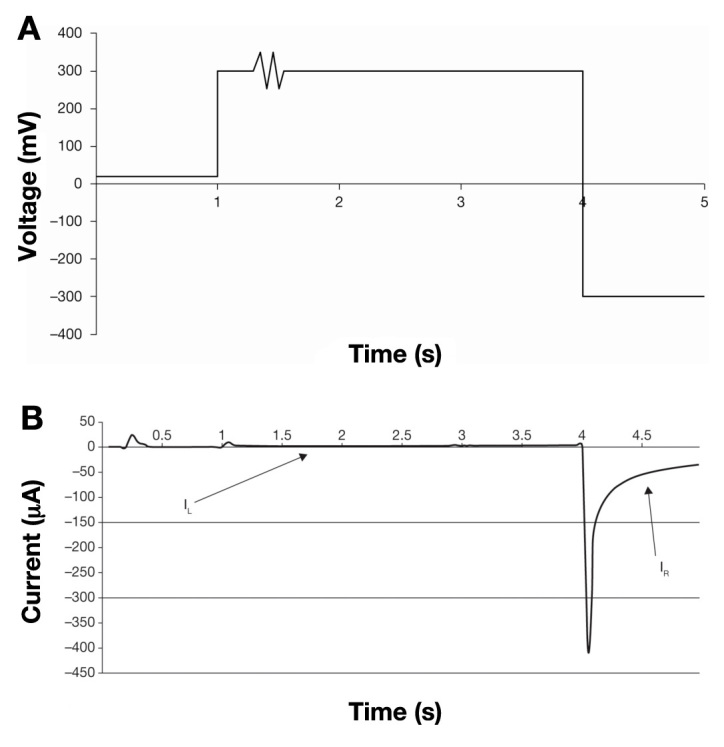
Voltage waveform applied to the BG test strip during the 5 s test time and corresponding voltage excursions during the 5 s of the voltage waveform. (A) During the first second, 20 mV is applied, followed by 300 mV for 0.3 s. The sine wave between 1.30 and 1.32 s is used to determine that the strip has sufficient sample to give an accurate result. It is followed by application of 300 mV until 4 s is reached. For the last second, -300 mV is applied. (B) An example of a current/time output from the meter following the application of the voltage waveform. The current corresponding to the first 4 s of the current/time transient is designated the left-hand current (IL). The current corresponding to the final second is termed the right-hand current (IR).
A proportion of this reduced mediator species can then diffuse away from the surface of the palladium and may contact the gold electrode whereupon it is converted back to the oxidized state. This migration, coupled to oxidation at the electrode surface, results in a rise in current (designated IL or the left-hand current) that is detected over the first 4 s of the measurement (Figure 5B). For a given thickness of spacer material, the magnitude of this current at a given time point is dependent on the concentration of reduced mediator at the palladium surface. This, in turn, is proportional to the rate of enzymatic turnover and hence the concentration of glucose in the sample, coupled to the hydrodynamic properties of the blood sample, specifically blood viscosity and Hct level. Consequently, this part of the current/time curve can be used to obtain information regarding the apparent diffusion coefficient of the ferrocyanide anion in the sample. The comparative effects of Hct on both IL and right-hand current (IR) can be seen in Figure 6.
Figure 6.
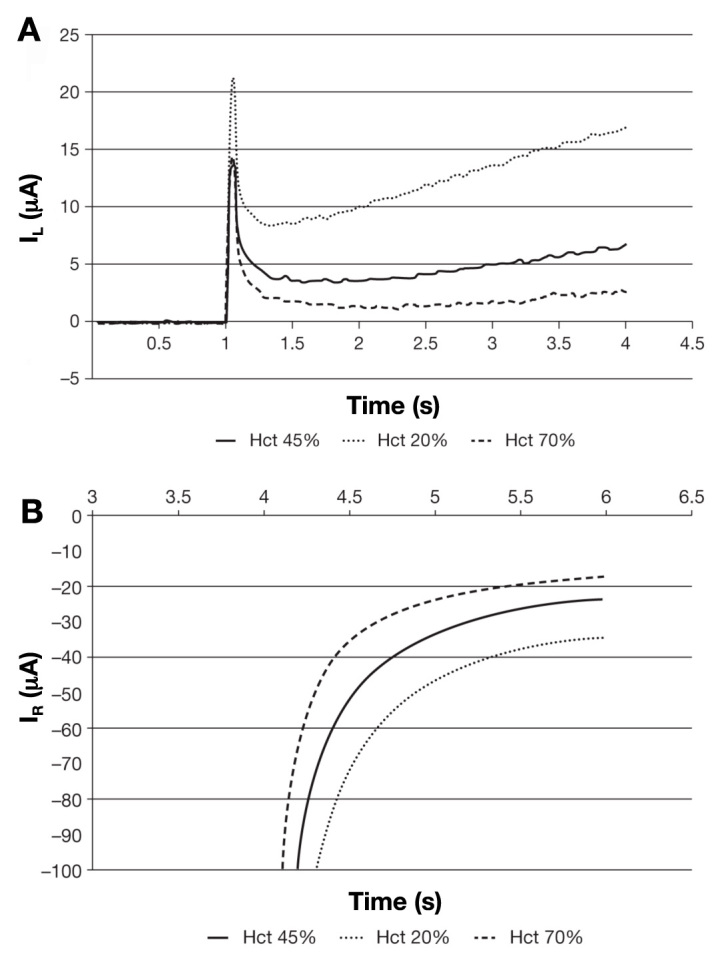
(A) Effect of different Hct levels on the left-hand current (IL) at a fixed concentration of glucose. (B) Effect of different Hct levels on the right-hand current (IR) at fixed concentrations of glucose. In each case, the magnitude of the current at all time points is depressed as a function of increasing Hct.
The meter then calculates the Hct-corrected glucose value by calculating the ratio of the IR and the IL according to the relationship
where G is the value of glucose in the sample, a and p are constant values, zgr (zero glucose response) is a correction term for the background, and i2corr is a derived current that is proportional to the glucose concentration in the sample.
Conclusions
The BG monitoring system described in this article employs a novel BG test strip architecture and potential-time waveform that allows sophisticated compensation for Hct. The sensor assembly comprises cofacial thin-film gold and palladium electrodes separated by a thin spacer material, forming a small volume sample chamber th at fills by capillarity. The applied waveform consists of three distinct phases in which positive and negative voltages are applied. Several current measurements are combined within an algorithm to produce meter results that are accurate measurements of BG concentrations and are insensitive to the Hct effect.
Acknowledgments
Editorial assistance was provided by Excerpta Medica.
Glossary
Abbreviations
- (AC)
alternating current
- (BG)
blood glucose
- (Hct)
hematocrit
- (ISO)
International Organization for Standardization
- (RBC)
red blood cell
- (SMBG)
self-monitoring of blood glucose
Funding
The studies reported in this article were funded by LifeScan Inc.
Disclosures
Maria Teodorczyk is an employee of LifeScan Inc. Marco Cardosi and Steven Setford are employees of LifeScan Scotland Ltd.
References
- 1.The Diabetes Control and Complications Trial Research Group. The effect of intensive treatment of diabetes on the development and progression of long-term complications in insulin-dependent diabetes mellitus. N Engl J Med. 1993;329(14):977–986. doi: 10.1056/NEJM199309303291401. [DOI] [PubMed] [Google Scholar]
- 2.The Diabetes Control and Complications Trial/Epidemiology of Diabetes Interventions and Complications Research Group. Retinopathy and nephropathy in patients with type 1 diabetes four years after a trial of intensive therapy. N Engl J Med. 2000;342(6):381–389. doi: 10.1056/NEJM200002103420603. [DOI] [PMC free article] [PubMed] [Google Scholar]
- 3.Bergenstal RM, Gavin JR, 3rd, Global Consensus Conference on Glucose Monitoring Panel The role of self-monitoring of blood glucose in the care of people with diabetes: report of a global consensus conference. Am J Med. 2005;118(Suppl 9A):1S–6S. doi: 10.1016/j.amjmed.2005.07.055. [DOI] [PubMed] [Google Scholar]
- 4.Karter AJ, Ackerson LM, Darbinian JA, D'Agostino RB Jr, Ferrara A, Liu J, Selby JV. Self-monitoring of blood glucose levels and glycemic control: the Northern California Kaiser Permanente Diabetes registry. Am J Med. 2001;111(1):1–9. doi: 10.1016/s0002-9343(01)00742-2. [DOI] [PubMed] [Google Scholar]
- 5.Blonde L, Karter AJ. Current evidence regarding the value of self-monitored blood glucose testing. Am J Med. 2005;118(Suppl 9A):20S–26S. doi: 10.1016/j.amjmed.2005.07.053. [DOI] [PubMed] [Google Scholar]
- 6.Sarol JN Jr, Nicodemus NA Jr, Tan KM, Grava MB. Self-monitoring of blood glucose as part of a multi-component therapy among non-insulin requiring type 2 diabetes patients: a meta-analysis (1966-2004) Curr Med Res Opin. 2005;21(2):173–184. doi: 10.1185/030079904X20286. [DOI] [PubMed] [Google Scholar]
- 7.American Diabetes Association. Standards of medical care in diabetes--2008. Diabetes Care. 2008;(31 Suppl 1):S12–54. doi: 10.2337/dc08-S012. [DOI] [PubMed] [Google Scholar]
- 8.International Organization for Standardization. In vitro diagnostic test systems -- requirements for blood-glucose monitoring systems for self-testing in managing diabetes mellitus. ISO 15197:2003.
- 9.Fink KS, Christensen DB, Ellsworth A. Effect of high altitude on blood glucose meter performance. Diabetes Technol Ther. 2002;4(5):627–635. doi: 10.1089/152091502320798259. [DOI] [PubMed] [Google Scholar]
- 10.Heinemann L. Quality of glucose measurement with blood glucose meters at the point-of-care: relevance of interfering factors. Diabetes Technol Ther. 2010;12(11):847–857. doi: 10.1089/dia.2010.0076. [DOI] [PubMed] [Google Scholar]
- 11.Ginsberg BH. Factors affecting blood glucose monitoring: sources of errors in measurement. J Diabetes Sci Technol. 2009;3(4):903–913. doi: 10.1177/193229680900300438. [DOI] [PMC free article] [PubMed] [Google Scholar]
- 12.Barreau PB, Buttery JE. Effect of hematocrit concentration on blood glucose value determined on Glucometer II. Diabetes Care. 1988;11(2):116–118. doi: 10.2337/diacare.11.2.116. [DOI] [PubMed] [Google Scholar]
- 13.Kilpatrick ES, Rumley AG, Myint H, Dominiczak MH, Small M. The effect of variations in haematocrit, mean cell volume and red blood cell count on reagent strip tests for glucose. Ann Clin Biochem. 1993;30(Pt 5):485–487. doi: 10.1177/000456329303000513. [DOI] [PubMed] [Google Scholar]
- 14.Tang Z, Lee JH, Louie RF, Kost GJ. Effects of different hematocrit levels on glucose measurements with handheld meters for point-of-care testing. Arch Pathol Lab Med. 2000;124(8):1135–1140. doi: 10.5858/2000-124-1135-EODHLO. [DOI] [PubMed] [Google Scholar]
- 15.Chaplin H, Jr, Mollison PL, Vetter H. The body/venous hematocrit ratio: its constancy over a wide hematocrit range. J Clin Invest. 1953;32(12):1309–1316. doi: 10.1172/JCI102859. [DOI] [PMC free article] [PubMed] [Google Scholar]
- 16.Lyon ME, Lyon AW. Patient acuity exacerbates discrepancy between whole blood and plasma methods through error in molality to molarity conversion: “Mind the gap!”. Clin. Biochem. 2011;44(5-6):412–417. doi: 10.1016/j.clinbiochem.2011.01.005. [DOI] [PubMed] [Google Scholar]
- 17.Saudek CD, Derr RL, Kalyani RR. Assessing glycemia in diabetes using self-monitoring blood glucose and hemoglobin A1c. JAMA. 2006;295(14):1688–1697. doi: 10.1001/jama.295.14.1688. [DOI] [PubMed] [Google Scholar]
- 18.Hirsch IB, Bode BW, Childs BP, Close KL, Fisher WA, Gavin JR, Ginsberg BH, Raine CH, Verderese CA. Self-monitoring of blood glucose (SMBG) in insulin- and non-insulin-using adults with diabetes: consensus recommendations for improving SMBG accuracy, utilization, and research. Diabetes Technol Ther. 2008;10(6):419–439. doi: 10.1089/dia.2008.0104. [DOI] [PubMed] [Google Scholar]
- 19.Vanavanan S, Santanirand P, Chaichanajarernkul U, Chittamma A, Dubois JA, Shirey T, Heinz M. Performance of a new interference-resistant glucose meter. Clin Biochem. 2010;43(1-2):186–192. doi: 10.1016/j.clinbiochem.2009.09.010. [DOI] [PubMed] [Google Scholar]
- 20.Deng Y, Jamison SJ. Methods for performing hematocrit adjustment in glucose assays and devices for same. World Intellectual Property Organization Pub. No. WO/2005/114163. http://www.wipo.int/patentscope/search/en/WO2005114163. Accessed August 24, 2011. [Google Scholar]
- 21.Hönes J, Müller P, Surridge N. The technology behind glucose meters: test strips. Diabetes Technol Ther. 2008;10(s1):S10–S26. [Google Scholar]
- 22.McAleer JF, Scott D, Hall G, Alvarez-Icaza M, Plotkin EV, Davies OW. Disposable test strips with integrated reagent/blood separation layer. World Intellectual Property Organization Pub. No. WO/2000/042422. http://www.wipo.int/patentscope/search/en/WO2000042422. Accessed August 24, 2011.
- 23.Cui G, Yoo JH, Kim MH, Kim JY, Uhm JH, Nam H, Cha GS. Electrochemical biosensor. U.S. Patent Publication No. US 7288174 B2. http://ip.com/patent/US7288174. Accessed August 24, 2011.
- 24.Musholt PB, Schipper C, Thomé N, Ramljak S, Schmidt M, Forst T, Pfützner A. Dynamic electrochemistry corrects for hematocrit interference on blood glucose determinations with patient self-measurement devices. J Diabetes Sci Technol. 2011;5(5):1167–1175. doi: 10.1177/193229681100500520. [DOI] [PMC free article] [PubMed] [Google Scholar]
- 25.Fricke H. The electric capacity of suspensions of red corpuscles of a dog. Phys Rev. 1925;26(5):682–687. [Google Scholar]
- 26.Cole KS. A chapter of classical biophysics. Berkeley: University of California Press; 1968. Membranesions and impulses. [Google Scholar]
- 27.Cole KS, Cole RH. Dispersion and absorption in dielectrics I. Alternating current characteristics. J Chem Phys. 1941;9(4):341–351. [Google Scholar]
- 28.Maxwell JC. 3rd ed. Vol. 2. Oxford: Clarendon Press; 1904. A treatise on electricity and magnetism. [Google Scholar]
- 29.Fricke H. A mathematical treatment of the electric conductivity and capacity of disperse systems II. The capacity of a suspension of conducting spheroids surrounded by a non-conducting membrane for a current of low frequency. Phys Rev. 1925;26(5):678–681. [Google Scholar]
- 30.Fricke H. A mathematical treatment of the electric conductivity and capacity of disperse systems I. The electric conductivity of a suspension of homogeneous spheroids. Phys Rev. 1924;24(5):575–587. [Google Scholar]
- 31.Fricke H, Curtis HJ. The determination of surface conductance from measurements on suspensions of spherical particles. J Phys Chem. 1936;40(6):715–722. [Google Scholar]
- 32.Zhao TX, Lockner D. Electrical impedance and erythrocyte sedimentation rate (ESR) of blood. Biochim Biophys Acta. 1993;1153(2):243–248. doi: 10.1016/0005-2736(93)90411-r. [DOI] [PubMed] [Google Scholar]
- 33.Ma JZ, Ebben J, Xia H, Collins AJ. Hematocrit level and associated mortality in hemodialysis patients. J Am Soc Nephrol. 1999;10(3):610–619. doi: 10.1681/ASN.V103610. [DOI] [PubMed] [Google Scholar]
- 34.Collins AJ, Li S, St Peter W, Ebben J, Roberts T, Ma JZ, Manning W. Death, hospitalization, and economic associations among incident hemodialysis patients with hematocrit values of 36 to 39% J Am Soc Nephrol. 2001 Nov;12(11):2465–2473. doi: 10.1681/ASN.V12112465. [DOI] [PubMed] [Google Scholar]
- 35.Wu WC, Schifftner TL, Henderson WG, Eaton CB, Poses RM, Uttley G, Sharma SC, Vezeridis M, Khuri SF, Friedmann PD. Preoperative hematocrit levels and postoperative outcomes in older patients undergoing noncardiac surgery. JAMA. 2007;297(22):2481–2488. doi: 10.1001/jama.297.22.2481. [DOI] [PubMed] [Google Scholar]
- 36.Mackie JS, Meares P. The diffusion of electrolytes in a cation-exchange resin membrane. I. Theoretical. Proc R Soc Lond. 1955;232(1191):498–509. [Google Scholar]
- 37.Masaro L, Zhu XX. Physical models of diffusion for polymer solutions, gels and solids. Prog Polym Sci. 1999;24(5):731–775. [Google Scholar]
- 38.Einstein A. [On the motion of small particles suspended in a stationary liquid, as required by the molecular kinetic theory of heat] Annalen der Physik. 1905;17:549–560. [Google Scholar]


