

Abstract
With development of massively parallel sequencing technologies, there is a substantial need for developing powerful rare variant association tests. Common approaches include burden and non-burden tests. Burden tests assume all rare variants in the target region have effects on the phenotype in the same direction and of similar magnitude. The recently proposed sequence kernel association test (SKAT) (Wu, M. C., and others, 2011. Rare-variant association testing for sequencing data with the SKAT. The American Journal of Human Genetics 89, 82–93], an extension of the C-alpha test (Neale, B. M., and others, 2011. Testing for an unusual distribution of rare variants. PLoS Genetics 7, 161–165], provides a robust test that is particularly powerful in the presence of protective and deleterious variants and null variants, but is less powerful than burden tests when a large number of variants in a region are causal and in the same direction. As the underlying biological mechanisms are unknown in practice and vary from one gene to another across the genome, it is of substantial practical interest to develop a test that is optimal for both scenarios. In this paper, we propose a class of tests that include burden tests and SKAT as special cases, and derive an optimal test within this class that maximizes power. We show that this optimal test outperforms burden tests and SKAT in a wide range of scenarios. The results are illustrated using simulation studies and triglyceride data from the Dallas Heart Study. In addition, we have derived sample size/power calculation formula for SKAT with a new family of kernels to facilitate designing new sequence association studies.
Keywords: Burden tests, Correlated effects, Kernel association test, Rare variants, Score test
1. Introduction
Advances in high-throughput sequencing technology are reshaping the landscape of medical and human genetics research. In contrast to genome-wide association studies (GWAS), which involves genotyping preselected single-nucleotide polymorphisms (SNPs) that are relatively common, these new sequencing technologies enable us to also genotype rare genetic variants. Rare genetic variants, here defined as variants with minor allele frequency (MAF) <1–5%, have been shown to play a crucial role in complex trait etiology (Cohen and others, 2004). Despite their importance, testing for associations between rare variants and traits has proven challenging. Since standard individual variant tests, typically used for analysis of SNPs, are underpowered to detect rare variant effects due to the low allele frequencies and the large numbers of rare variants in the genome, region-based analysis has become the standard approach for analyzing rare variants in sequencing studies (Li and Leal, 2008).
The earliest and most commonly used class of region-based rare variant tests are the burden tests, which collapse or summarize the rare variants within the region as a single genetic variable which can then be tested for association with any trait of interest (Li and Leal, 2008; Madsen and Browning, 2009; Morris and Zeggini, 2010; Price and others, 2010). For example, the combined multivariate and collapsing method (Li and Leal, 2008) collapses information on all rare variants within a region by counting the number of rare alleles. Many extensions and variations on these methods exist. A key limitation of burden tests is that they suffer a substantial loss of power in the presence of large number of non-causal variants or in the presence of both protective and deleterious variants (Neale and others, 2011).
Recognizing the inherent limitations of burden-based methods, Wu and others (2011) recently proposed the sequence kernel association test (SKAT), which builds upon the kernel machine regression framework, to test rare variants associations. As a kernel machine-based test, SKAT aggregates genetic information across the region using a kernel function and uses a computationally efficient variance component test to test for association. Wu and others (2011) also showed that SKAT is a generalization of the classical C-alpha test (Neyman and Scott, 1966; Neale and others, 2011).
Although SKAT offers improved power over burden-based tests in many cases, if a large proportion of the rare variants in a region are truly causal and influence the phenotype in the same direction, then burden tests can have higher power than SKAT (Basu and Pan, 2011). This scenario can arise in several current sequencing studies, e.g. whole exome sequencing studies. This is because standard evolutionary principles and population genetics models indicate that majority of rare missense mutations are moderately deleterious (Kryukov and others, 2007). In addition, bioinformatic tools are often used to restrict testing to variants that are likely harmful variants. However, such prior knowledge is often lacking in practice. The underlying biological mechanisms vary from one gene to another across the genome and often unknown. It is hence of substantial practical interest to develop a data-adaptive test that is optimal for both scenarios when scanning the genome in genome-wide sequencing association studies.
In this paper, by exploiting the relationship between burden-based tests and SKAT, we propose a data-adaptive optimal test within a class of tests that include both burden tests and SKAT as special cases. Specifically, we consider a class of tests that is an arbitrary linear combination of burden test and SKAT statistics, and identify the optimal test within this class to maximize power. We show that this new class of tests can be formulated as a generalized family of SKAT tests by incorporating a correlation structure of variant effects through a family of kernels. It reduces to the burden tests when the effects of variants are perfectly correlated. We derive the optimal test (SKAT-O) by estimating the correlation parameter in the kernel matrix to maximize the power, which corresponds to the estimated weight in the linear combination of the burden test and SKAT test statistics that maximizes power. We derive the theoretical distribution of the SKAT-O test statistic, which allows us to calculate the p-value analytically with high accuracy in the tail. This is advantageous for analyzing genome-wide sequencing data by avoiding computationally intensive methods, such as resampling or permutation, to calculate p-values, especially in the tail required to reach genome-wide significance.
In addition, we also consider the problem of designing future sequencing association studies. In particular, to design a new sequence association study, it is important to be able to estimate the required sample size to achieve proper statistical power. Although power and sample size calculation can be done via simulation, this computer-intensive approach is not desirable. Therefore, we derive the analytical formula for the statistical power of SKAT under the newly proposed family of kernels, and by inverting the power function, we can compute the necessary sample size to adequately power future studies.
2. Optimal test
For simplicity, we assume that we are interested in testing whether the rare variants in a single region are associated with a complex trait. In a large-scale study of multiple regions, the same methods can be applied with the appropriate adjustment of multiple testing.
2.1. Rare variants testing methods
Assume that n subjects are sequenced in a region with p genotyped rare variants. For the ith subject, let yi denote a phenotype variable, Gi=(gi1,…,gip) the genotypes for the p variants (gij=0,1,2 for 0,1, or 2 copies of the minor allele), Xi=(xi1,…,xiq) the covariates for which we would like to adjust (e.g. demographic or environmental variables). To relate genotypes to continuous/categorical phenotypes, we use the generalized linear model (GLM), such that yi independently follows an exponential family distribution with first two moments E(yi)=μi and Var(yi)=ϕv(μi), and a link function
| (2.1) |
where v(⋅) is a variance function. α and β=(β1,…,βp)′ are the vectors of regression coefficients for the covariates and rare variants, respectively. Under the GLM, the association between the p rare variants and the phenotype y can be tested by evaluating the null hypothesis that H0: β=(β1,…,βp)′=0. However, the standard p degree of freedom (d.f.) test may lose power when p is large. To reduce the d.f., additional assumptions need to be made.
Popular burden-based tests reduce the d.f. by making the assumption that each βj is a function of the MAFs such that βj=w(mj)=wjβ0, where mj is the MAF of the jth variant. Then (2.1) becomes
 |
(2.2) |
and the association between the genetic variants and the phenotype can be tested by conducting a 1 d.f. test with H0: β0=0. We refer to this test as the weighted counting burden test (WBT). The WBT assumes that all variants are causal with the same direction of association and common β0. Violation of these assumptions can result in a significant loss of power.
SKAT takes a different approach to reducing the d.f. It assumes that each βj independently follows an arbitrary distribution with mean zero and variance  , where wj is a fixed number that may depend on MAF. Under this assumption, the null hypothesis H0 : β=0 is equivalent to H0 : ψ=0, i.e. variance component test in generalized linear mixed models by treating β as random effects. Suppose X is the n×q covariates matrix, G=[G1,…,Gn]′ is the n×p genotype matrix, W=diag[w1,…,wp] is a p×p diagonal matrix of weights and K=GWWG′ is an n×n weighted linear kernel matrix. Wu and others (2011) proposed to use a class of flexible weight functions of the MAF using the beta density function as wj=Beta(MAFj,a1,a2), where the parameters a1 and a2 are pre-specified, and MAFj are estimated using the sample MAF of the jth variant.
We define the working vector by y*=Xα+Δ(y−μ), where Δ=diag{g′(μi)}, and the variance matrix by V=diag{ϕv(μi)[g′(μi)]2}. Their estimates under the null hypothesis are  ,
,  , and
, and  , respectively, where
  is an q×1 vector of estimates of α,
  is an n×1 vector of estimates of μ and
  is an estimate of ϕ. All estimates are obtained under the null hypothesis. Following Zhang and Lin (2003), the score test statistic of the variance component ψ is
| (2.3) |
When g(⋅) is a canonical link function, (2.3) can be simplified to  . For binary and Poisson data, ϕ=1.
2.2. New family of kernels
As shown in the previous section, the weighted linear kernel is constructed under the assumption that βjs are independent. If a large percentage of variants in the target region are associated with the phenotype with the same direction of effect, burden tests can outperform SKAT because the current kernels used by SKAT do not account for correlation in β. Therefore, we propose a new family of kernels that explicitly incorporates correlation among the variant effects.
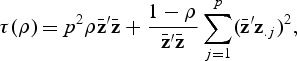
We propose to allow β to follow a multivariate distribution with exchangeable correlation structure. Then the correlation matrix of β is Rρ=(1−ρ)I+ρ11′. With this correlation structure, the SKAT test statistic is a function of ρ:
| (2.4) |
where Kρ=GWRρWG′. When ρ=0, Kρ results in the weighted linear kernel SKAT. When ρ=1, SKAT test statistic is
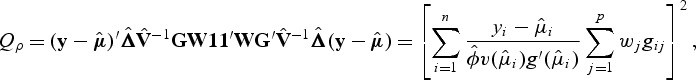 |
which is equivalent to the square of the score test statistic of WBT. Thus, both tests can be framed within this new family of kernels. In fact, one can easily show that Qρ is a linear combination of SKAT and burden test, i.e. Qρ=(1−ρ)QSKAT+ρQburden.
For a fixed ρ, Qρ follows a mixture of χ2 distributions (Liu and others, 2007, 2008; Tzeng and Zhang, 2007). Specifically, if (λ1,…,λm) are the eigenvalues of  , then the null distribution of Qρ can be closely approximated by
  , where
  are independent
  random variables. To reduce small sample bias, the restricted maximum likelihood (REML) estimator of the variance component can be used (Zhang and Lin, 2003). Define
  , where
  , we use the eigenvalues of P1/2KρP1/2 to obtain the null distribution of Qρ. A p-value can be obtained by matching moments (Liu and others, 2009) or by inverting the characteristic function (Davies, 1980).
To understand the role of the parameter ρ, we derive in Supplementary Appendix C (supplementary material available at Biostatistics online) the analytic relationship between ρ and the given regression coefficient β as a function of the proportion of causal variants in a region (i.e. the proportion of the β coefficients that are non-zero) and the proportion of causal variants that are protective (i.e. the proportion of the non-zero β coefficients that are negative), assuming the magnitude of the causal variant effects as a function of the MAFs. We illustrate this relationship and its use in the power calculation section.
2.3. Optimal test (SKAT-O)
In practice, we rarely have any information about ρ. Thus, we need a procedure to select ρ to maximize power. The resulting optimal test corresponds to a best linear combination of SKAT and burden tests that maximizes power. This is in general a challenging problem because ρ disappears under the null hypothesis. Davies (1987) studied this problem and proposed to use a maximum of score test statistic as a test statistic. This approach, however, is not directly applicable here due to the different kurtoses of the Qρs. As ρ increase, the null distribution of Qρ has a heavier tail, and adjustment for this is difficult.
We employ an different approach and use the minimum of p-values as a test statistic rather than the score statistics. Specifically, the test statistic is
| (2.5) |
where pρ is the p-value computed based on Qρ. T can be obtained by simple grid search across a range of ρ: set a grid 0=ρ1<ρ2<⋯<ρb=1, then the test statistic  .
.
2.3.1. Null distribution of the test statistic
In order to obtain the null distribution of T and conduct a hypothesis test, let  and
and  , where
  .
.  is a projection matrix onto a space of spanned by
  . We further let
 |
where z.j is the jth column of Z, and Qρ1,…,Qρb are the score test statistics computed with different ρv,(v=1,…,b). Then we show in Supplementary B (supplementary material available at Biostatistics online) that under the null hypothesis Qρv is asymptotically the same as
 |
(2.6) |
where {λ1,…λm} are non-zero eigenvalues of Z′(I−M)Z, ηk(k=0,…,m) are i.i.d  random variables,
  , and ζ satisfies the following conditions:
 |
Since the Pearson correlation between κ and η0 is zero, we can approximate Qρ as the mixture of two independent random variables. We can approximate the distribution of κ by using the characteristic function inversion method (Davies, 1980) after adjusting for the extra variance term of ζ. Letting qmin(ρv) denote the (1−T)th percentile of the distribution of Qρv for each ρv, the p-value based on the test statistic T is
 |
which can be obtained by one-dimensional numerical integration, which can be easily calculated. When we compute pρv and qmin(ρv), we approximate each marginal distribution of Qρv by modifying the moment-matching method of Liu and others (2009). In particular, instead of matching the first 3 moments, we match the mean, variance and kurtosis to improve the approximation in the tail area. To adjust for small sample bias, one can use REML estimates of the variance components, such that Z=P1/2GW. The following algorithm provides the detailed description of the proposed method.
Step 1: Set a grid 0=ρ1<ρ2<⋯<ρb=1.
Step 2: Compute Qρ1,…,Qρb, Z, and M. Here Z=P1/2GW.
Step 3: Compute λks, τ(ρv), and
 |
Step 4: Calculate pρv, T and qmin(ρv)s using the modified moment matching approximation.
Step 5: Numerically integrate  where
where
 |
 is a density function of
  , and F(δ(x)|λ) is a distribution function of a mixture of chi-square distribution,
  . The p-value is found as
3. Sample size and power calculations for designing sequencing association studies
Estimating the necessary sample size to adequately power a study is an important part of designing new sequencing association studies. In this section, we derive the analytical formula for the statistical power of SKAT. We restrict our interest to continuous traits study designs and dichotomous traits study designs, such as case–control study designs, since both are commonly used designs in association studies. We further note that we consider only SKAT with fixed ρ, since at the design stage, researchers generally specify anticipated alternative hypotheses, i.e. a specific ρ based on the scenario they have in mind. The detailed power calculation method can be found in Supplementary Appendix A (supplementary material available at Biostatistics online). The required sample size to achieve a fixed power level can be easily computed by inverting the power function.
The proposed formula can be used to calculate statistical power efficiently for specified sample sizes and α level, given prior information on the genetic architecture of the genomic region of interest. Also required are the proportion of causal variants within the region (i.e. the fraction of non-zero β coefficients), and the proportion of causal variants that are protective (i.e. the fraction of non-zero β coefficients that are negative). Both of these can be easily posited by investigators based on prior belief, and detailed discussions are provided in Wu and others (2011). What is more challenging to specify is the particular ρ value to be used in power calculations. As discussed in Section 2.2 and Supplementary Appendix C (supplementary material available at Biostatistics online), if the proportion of nonzero βs is p1, the proportion of positive βs among the non-zero βs is p2, and the magnitude of the causal variant effects is a function of the MAFs, the optimal ρ can be estimated as
| (3.1) |
Note that the power computed with this theoretical estimate of ρ will differ slightly from the power of the optimal test (2.5) which is based on the data driven optimal ρ, since we are fixing ρ to obtain the power. However, our simulation studies (Section 4.3) suggest that this difference tends to be small.
4. Simulations and real data analysis
4.1. Type I error rate
For all simulations, sequence genotypes were generated from 10 000 chromosomes over 1 Mb regions by the calibrated coalescent model with mimicking the linkage disequilibrium structure of European ancestry samples (Schaffner and others, 2005). Continuous phenotypes were generated from the null linear model
and binary phenotypes were generated from the null logistic model
where X1 was a continuous covariate generated from N(0,1), X2 was a binary covariate generated from Bernoulli(0.5) and α0 was chosen to make penetrance 0.01. For binary trait simulations, we generated retrospective case−control data with half being cases and half being controls. Since the average length of a gene is around 3 kb, we randomly selected 3 kb regions across the 1-Mb chromosome. For each model, we generated a total of 10 000 datasets.
We applied 6 different methods to each of the simulated datasets: proposed test with default wj=beta(MAFj;1,25) weights (SKAT-O); SKAT-O with flat weights (rSKAT-O); original SKAT (ρ=0) with beta(1,25) weights (SKAT); SKAT (ρ=0) with flat weights (rSKAT); counting-based burden test (N); and weighted counting burden test (W). For rSKAT-O, rSKAT, and counting-based burden test (N), only variants with observed MAF<0.03 were used. The equal size grid of 11 points (from 0 to 1) were used to obtain test statistics of the SKAT-O and rSKAT-O to search for optimal ρ. Table 1 shows that all 6 methods well-controlled type I error rates with α=0.05 and α=0.01.
Table 1.
Type I error estimates of six different methods to test an association between randomly selected 3 kb regions with continuous and binary traits. Each entry represents type I error rate estimates as the proportion of p-values smaller than α under the null hypothesis based on 10 000 simulated datasets
| Sample size | Level α | SKAT-O | SKAT | rSKAT-O | rSKAT | N | W |
|---|---|---|---|---|---|---|---|
| Continuous trait | |||||||
| 2000 | 0.05 | 0.051 | 0.051 | 0.050 | 0.048 | 0.048 | 0.047 |
| 0.01 | 0.009 | 0.009 | 0.009 | 0.009 | 0.009 | 0.009 | |
| 5000 | 0.05 | 0.051 | 0.049 | 0.054 | 0.050 | 0.049 | 0.051 |
| 0.01 | 0.011 | 0.010 | 0.011 | 0.009 | 0.009 | 0.009 | |
| Dichotomous trait | |||||||
| 2000 | 0.05 | 0.051 | 0.049 | 0.049 | 0.048 | 0.047 | 0.047 |
| 0.01 | 0.011 | 0.009 | 0.012 | 0.010 | 0.010 | 0.011 | |
| 5000 | 0.05 | 0.047 | 0.043 | 0.046 | 0.044 | 0.047 | 0.048 |
| 0.01 | 0.010 | 0.009 | 0.010 | 0.008 | 0.009 | 0.010 | |
To investigate type I error rates at very stringent genome-wide α levels, we conducted extensive simulations under a slightly different setting (Supplementary Appendix D, available at Biostatistics online). Table 2 shows that SKAT-O can accurately control type I error with moderate α levels, but produces slightly inflated type I error rates at very small α levels.
Table 2.
Type I error estimates of SKAT-O to test an association between randomly selected 3 kb regions with continuous and binary traits at stringent α level. The sample size was 2000. Each entry represents type I error rate estimates as the proportion of p-values smaller than α under the null hypothesis based on 107 simulated phenotypes
| Level α | Continuous traits | Binary traits |
|---|---|---|
| 10−3 | 1.1×10⁻³ | 1.1×10⁻³ |
| 10−5 | 1.7×10⁻⁵ | 1.2×10⁻⁵ |
| 2.5×10⁻⁶ | 4.1×10⁻⁶ | 3.3×10⁻⁶ |
04.2. Power
As with the type I error simulations, we randomly selected 3 kb regions from the broader 1 Mb region, but we then randomly chose causal variants from among the variants with true MAF<0.03. The continuous phenotype were simulated from
and dichotomous phenotypes were simulated from
where (g1,…,gs) were selected causal variants. Covariates X1 and X2 follow the same distribution in the type I error simulation, and α0 was chosen to make prevalence 0.01.
We considered simulations in which 10%, 20%, or 50% of rare variants were causal. Since it is assumed that rarer variants are more likely to have large effect sizes, we set  , where mj is the MAF of the jth variant. For continuous trait simulations, we set c=0.6, when 10% of the rare variants were causal, which gives maximum β=2.4 for variants with MAF=10−4. We used c=0.3 and c=0.2, when 20% and 50% of the rare variants were causal to compensate for the increased number of causal variants. For dichotomous trait simulations, we set
  , when 10% of the rare variants were causal, which gives maximum OR=13 for variants with MAF=10−4. We scaled down c with larger percentages of causal variants. We allowed the sample size to vary as n=1000,2000, and 5000. Datasets were generated 1000 times for each configuration. We applied the same 6 methods used in the type I error simulations to each dataset, and power was estimated as the proportion of p-values less than α=2.5×10⁻⁶.
Figure 1 shows the empirical power under all considered configurations when non-zero β coefficients are all positive, i.e. causal variants are all in the same directions. When the percentage of causal SNPs was low, both the original SKATs (SKAT and rSKAT) and the proposed SKAT-O (SKAT-O and rSKAT-O) had higher power than the burden tests. When the proportion of causal SNPs increased, the burden tests performed better, and the original SKAT has lower power than burden tests when 50% of variants are causal. The SKAT-O and rSKAT-O perform better (when 20% of rare variants are causal) or similar to the burden tests (when 50% of rare variants are causal). This suggests that the performance of SKAT-O is closer to the burden tests in the presence of a larger proportion of causal variants. The higher power of the weighted test over the unweighted test also suggests that appropriate weighting can increase the power.
Fig. 1.

Empirical power of SKAT-O and competing methods at α=2.5×10⁻⁶ using simulation studies when region size=3 kb and β±=100/0. Top panel considers continuous phenotypes and bottom panel considers dichotomous phenotypes. From left to right, the plots consider the setting in which 10% of rare variants were causal, 20% of rare variants were causal, and 50% of rare variants were causal. The detailed simulation setups are described in “Simulations and Real Data Analysis”.
We also conducted simulations in which 20% of causal variants have negative βs (and 80% have positive βs). Results for these simulations are presented in Figure 2 and show that as expected, burden tests lose a significant amount of power since the effects of the causal variants cancel out due to the presence of negative β coefficients. Both the original and the new optimal SKAT and rSKAT outperform the burden tests no matter where the percentage of causal variants is small or large. In this case, the performance of SKAT-O is closer to SKAT. When 10% or 20% of variants were causal variants, SKAT-O and rSKAT-O had slightly lower power than SKAT and rSKAT. With 50% of variants being causal, SKAT-O and rSKAT-O had slightly higher power than SKAT and rSKAT. Compared to Figure 1, SKAT and rSKAT did not suffer any power loss in continuous trait simulation and had slightly lower power in dichotomous trait simulation which resulted from lower enrichment for causal variants due to fixed prevalence and the presence of protective variants. However, burden tests lose considerable power due to the fact that causal variants β coefficients are in mixed directions. In addition, we present the ρ values selected by SKAT-O in Supplementary Figure S4 (supplementary material available at Biostatistics online), which shows that SKAT-O generally selects large ρ values when the percentage of causal variants is high and β±=100/0 and selects small ρs when either the percentage of causal variants is low or β±=80/20. Overall, our simulation results confirm that the proposed SKAT-O performed very well under broad circumstances.
Fig. 2.

Empirical power of SKAT-O and competing methods at α=2.5×10⁻⁶ using simulation studies when region size=3 kb and β±=80/20. Top panel considers continuous phenotypes and bottom panel considers dichotomous phenotypes. From left to right, the plots consider the setting in which 10% of rare variants were causal, 20% of rare variants were causal, and 50% of rare variants were causal. The detailed simulation setups are described in “Simulations and Real Data Analysis”.
4.3. Sample size and power calculation
We investigated the effect of different ρ values on the power under various models (Supplementary Appendix E, available at Biostatistics online). Supplementary Figures S2 and S3 (supplementary material available at Biostatistics online) show that the test with ρ=0 (original SKAT) or ρ=1 (burden tests) can have reduced power, depending on the model assumptions. For example, if only 10% of the variants are causal, then the test with ρ=1 is significantly less powerful than the test with ρ=0. In contrast, when 50% of the variants are causal and all of the non-zero β coefficients are positive, the test with ρ=0 had lower power than the test with ρ=1. In all scenarios, ρ computed from the proposed formula (ρ=estimated) was most powerful. The figures also show that the theoretical power under the theoretical optimal ρ closely approximates the empirical power of SKAT-O verifying the adequacy of using equation (3.1) to select ρ for power and sample size calculations.
We also conducted simulations to evaluate the accuracy of the power calculation formula given ρ values, and details can be found in Supplementary Appendix F (supplementary material available at Biostatistics online).
4.4. Real data application
We applied the proposed SKAT-O and other competing methods to the resequencing data from the Dallas Heart Study (Victor and others, 2004) to test for association between serum triglyceride (TG) levels and rare variants in 3 genes (ANGPTL3, ANGPTL4, and ANGPTL5). The resequencing dataset has sequence information on 93 observed variants in the 3 genes from each of 3476 individuals in three ethnic groups (white=1043, black=1832, and hispanic=601) (Romeo and others, 2007). A total of 35, 32, and 26 variants reside in the ANGPTL3, ANGPTL4, and ANGPTL5 genes, respectively. All variants except one have MAF<0.03. The histogram of the estimated allele frequencies of the 92 variants with MAF<0.03 is presented in Figure 3(a) and clearly indicates that the majority of variants are very rare.
Fig. 3.

Single variant analysis results of Dallas Heart Study data. (a) Histogram of minor allele frequencies of 92 variants with MAF<0.03. (b)–(d) Plots of  versus t-statistic values of each variant of ANGPTL3, 4, and 5 genes. The dashed line represents the 95% confidence interval of no-association.
We first performed single-variant association analysis between each variant and log-transformed TG level to explore whether there were variants with different directions of effect. Specifically, we regressed the trait value on the variant while adjusting for gender and ethnicity and computed the t-statistic based on the regression coefficient (Figures 3(b)–(d)). There is no clear evidence that ANGPTL3 and ANGPTL5 have variants with opposite effects; however, since some of the t-statistics for the variants in ANGPTL4 have opposing signs and relatively large magnitude, suggesting that there is the potential for variants to have different directions of effect.
We conducted two different analyses. First, we pooled all 93 variants from across the 3 genes and tested for their cumulative effect on log TG level. Second, we considered each gene separately and tested the association between rare variants in each gene and log TG level. We again applied the 6 methods used in the simulation studies with adjusting gender and ethnicity. The results (Table 3) show that when the variants in all three genes were pooled to form a single region for analysis, SKAT-O was by far the most powerful. Our individual variant analysis results suggested that the variants in ANGPTL3 and ANGPTL5 may affect log TG unidirectionally so it is unsurprising that the burden tests (W, N) had comparable or better performance than SKAT and rSKAT for testing the variants in ANGPTL3 and ANGPTL5. Also as expected due to the apparent presence of variants with opposing effects, SKAT and rSKAT performed better than the burden tests for testing the association between ANGPTL4 and log TG level. However, SKAT-O and rSKAT-O performed very well across all settings and had only slightly larger p-values than the best test for the particular setting.
Table 3.
Analysis of Dallas Heart Study sequence data. Each entry represents a p-value from each method after adjusting gender and ethnicity. The selected ρ values by SKAT-O and rSKAT-O are presented in the parentheses. “ALL” indicates analysis results of joint test of all 93 variants in 3 genes
| Gene | SKAT-O | rSKAT-O | SKAT | rSKAT | N | W |
|---|---|---|---|---|---|---|
| Continuous TG level | ||||||
| ALL | 1.8×10⁻⁵ (ρ=0.1) | 4.6×10⁻⁵ (ρ=0.2) | 9.5×10⁻⁵ | 2.9×10⁻⁴ | 7.2×10⁻⁵ | 2.3×10⁻⁴ |
| ANGPTL3 | 2.6×10⁻³ (ρ=0.5) | 1.3×10⁻³ (ρ=1) | 8.9×10⁻³ | 6.2×10⁻³ | 1.1×10⁻³ | 1.9×10⁻³ |
| ANGPTL4 | 1.7×10⁻⁴ (ρ=0) | 8.5×10⁻⁴ (ρ=0.1) | 9.5×10⁻⁵ | 6.9×10⁻⁴ | 4.9×10⁻³ | 3.1×10⁻² |
| ANGPTL5 | 3.4×10⁻¹ (ρ=1) | 5.0×10⁻¹ (ρ=1) | 7.6×10⁻¹ | 8.5×10⁻¹ | 3.3×10⁻¹ | 2.0×10⁻¹ |
| Dichotomous TG level | ||||||
| ALL | 1.1×10⁻⁴ (ρ=0.1) | 2.8×10⁻⁴ (ρ=0.1) | 1.4×10⁻⁴ | 2.4×10⁻⁴ | 2.2×10⁻³ | 2.7×10⁻³ |
| ANGPTL3 | 4.7×10⁻² (ρ=0.4) | 3.2×10⁻² (ρ=0.8) | 4.7×10⁻² | 4.1×10⁻² | 2.3×10⁻² | 3.6×10⁻² |
| ANGPTL4 | 1.6×10⁻⁴ (ρ=0) | 3.6×10⁻⁴ (ρ=0.1) | 9.4×10⁻⁵ | 3.3×10⁻⁴ | 3.1×10⁻³ | 2.2×10⁻² |
| ANGPTL5 | 4.6×10⁻¹ (ρ=0) | 3.1×10⁻¹ (ρ=0) | 3.0×10⁻¹ | 1.9×10⁻¹ | 8.7×10⁻¹ | 4.0×10⁻¹ |
Although log TG is a continuous variable, purely for illustration we also dichotomized the log TG level by taking the the highest and lowest quartiles of each of the six sex-ethnicity groups and using high/low log TG as a dichotomous outcome. The results were qualitatively similar to the results keeping log TG continuous (Table 3).
5. Discussion and conclusion
In this paper, we propose a new family of kernels that incorporates correlation among the effects of causal variants. Based on this new family of kernels, we develop the optimal testing procedure that uses the minimum p-values from different kernels as a test statistic. In simulation and real data analysis, we show that the proposed optimal test often outperformed the existing burden test and weighted linear kernel SKAT. In addition, we derived sample size/power formula for SKAT for designing new sequence association studies.
In whole exome or whole-genome sequencing studies, we scan the genome by testing a large number of genes. We cannot expect all the genes/regions to follow the same genetic model of association: some are likely to have many causal variants with the effects in the same direction while others may have few causal variants or the causal variants may have the effects in different directions. A good example is the Dallas Heart Study data in which ANGPTL3 and 4 seem to follow different genetic association models. Thus, the proposed SKAT-O can be an attractive choice for many situations, because it adapts to the underlying biological model by selecting ρ based on the data.
We note that the proposed kernels consider only the compound symmetry covariance structure for the effect of rare variants. The simple structure of compound symmetry allows us to efficiently compute p-values of the optimal test. For example, it would take only 3–4 h to analyze a whole exome sequencing study with 20 000 genes and 2000 samples on a laptop. Extension of the method to accommodate other correlation structures is a problem of future interest.
The power/sample size calculation formula presented in this paper is derived with fixed ρ, and thus we acknowledge that this formula may not be applicable for the proposed SKAT-O. To derive power/sample size formula for the optimal test is challenging due to the ζ term, and we suggest a practical approach to pre-select ρ based on assumptions on underlying genetic structure of association. In particular, researchers can use the simple formula we developed in this paper to select a proper ρ parameter based on the expected effects of the variants in power calculations. We note that for simplicity, this formula was derived under the assumption that the magnitudes of the non-zero β coefficients are equal to the weights used in the test. However, our simulation studies show that the power is robust to this assumption and is not very sensitive to modest changes in ρ, and the proposed approach can closely approximate the empirical power of SKAT-O.
As shown in simulation and real data analysis, proper weighting can improve power to detect rare variants association. In this paper, we use the beta(1,25) density function as a weight function that has been proposed by Wu and others (2011). Since the weight is fixed prior to conducting the association test, the type I error rate is not inflated. It is possible, however, the power can be lost if the weight is misspecified. Although an attractive solution is to choose the weight adaptively using data and obtain p-values through permutation or resampling, the computationally expense is not desirable, particularly for for genome-wide studies, and it remains of interest to select the weight that maximizes power.
6. Software
The software can be found at (http://www.hsph.harvard.edu/research/skat/).
Supplementary material
Supplementary material is available at http://biostatistics.oxfordjournals.org.
Funding
This work was supported by the National Institutes of Health [R37 CA076404 and P01 CA134294 to S.L. and X.L., and R01 HG006292 to M.C.W.].
Supplementary Material
Acknowledgments
We thank the Associate Editor and the referees for constructive comments which have improved the paper. Conflict of Interest: None declared.
The order of authors in the original proof was incorrect. The order has now been corrected. The authors apologise for this error.
References
- Basu S., Pan W. Comparison of statistical tests for disease association with rare variants. Genetic Epidemiology. 2011;35:606–619. doi: 10.1002/gepi.20609. [DOI] [PMC free article] [PubMed] [Google Scholar]
- Cohen J. C., Kiss R. S., Pertsemlidis A., Marcel Y. L., McPherson R., Hobbs H. H. Multiple rare alleles contribute to low plasma levels of HDL cholesterol. Science. 2004;305:869. doi: 10.1126/science.1099870. [DOI] [PubMed] [Google Scholar]
- Davies R. B. Algorithm AS 155: the distribution of a linear combination of χ2 random variables. Applied Statistics. 1980;29:323–333. [Google Scholar]
- Davies R. B. Hypothesis testing when a nuisance parameter is present only under the alternative. Biometrika. 1987;74:33. [Google Scholar]
- Kryukov G. V., Pennacchio L. A., Sunyaev S. R. Most rare missense alleles are deleterious in humans: implications for complex disease and association studies. The American Journal of Human Genetics. 2007;80:727–739. doi: 10.1086/513473. [DOI] [PMC free article] [PubMed] [Google Scholar]
- Li B., Leal S. M. Methods for detecting associations with rare variants for common diseases: application to analysis of sequence data. The American Journal of Human Genetics. 2008;83:311–321. doi: 10.1016/j.ajhg.2008.06.024. [DOI] [PMC free article] [PubMed] [Google Scholar]
- Liu D., Ghosh D., Lin X. Estimation and testing for the effect of a genetic pathway on a disease outcome using logistic kernel machine regression via logistic mixed models. BMC Bioinformatics. 2008;9 doi: 10.1186/1471-2105-9-292. [DOI] [PMC free article] [PubMed] [Google Scholar]
- Liu D., Lin X., Ghosh D. Semiparametric regression of multidimensional genetic pathway data: least-squares kernel machines and linear mixed models. Biometrics. 2007;63:1079–1088. doi: 10.1111/j.1541-0420.2007.00799.x. [DOI] [PMC free article] [PubMed] [Google Scholar]
- Liu H., Tang Y., Zhang H. H. A new chi-square approximation to the distribution of non-negative definite quadratic forms in non-central normal variables. Computational Statistics & Data Analysis. 2009;53:853–856. [Google Scholar]
- Madsen B. E., Browning S. R. A groupwise association test for rare mutations using a weighted sum statistic. PLoS Genet. 2009;5:1000384. doi: 10.1371/journal.pgen.1000384. [DOI] [PMC free article] [PubMed] [Google Scholar]
- Morris A. P., Zeggini E. An evaluation of statistical approaches to rare variant analysis in genetic association studies. Genetic Epidemiology. 2010;34:188. doi: 10.1002/gepi.20450. [DOI] [PMC free article] [PubMed] [Google Scholar]
- Neale B. M., Rivas M. A., Voight B. F., Altshuler D., Devlin B., Orho-Melander M., Kathiresan S., Purcell S. M., Roeder K., Daly M. J. Testing for an unusual distribution of rare variants. PLoS Genetics. 2011;7:161–165. doi: 10.1371/journal.pgen.1001322. [DOI] [PMC free article] [PubMed] [Google Scholar]
- Neyman J., Scott E. On the use of c(α) optimal tests of composite hypotheses. Bulletin of the International Statistical Institute. 1966;41 [Google Scholar]
- Price A. L., Kryukov G. V., de Bakker P. I. W., Purcell S. M., Staples J., Wei L. J., Sunyaev S. R. Pooled association tests for rare variants in exon-resequencing studies. The American Journal of Human Genetics. 2010;86:832–838. doi: 10.1016/j.ajhg.2010.04.005. [DOI] [PMC free article] [PubMed] [Google Scholar]
- Romeo S., Pennacchio L. A., Fu Y., Boerwinkle E., Tybjaerg-Hansen A., Hobbs H. H., Cohen J. C. Population-based resequencing of angptl4 uncovers variations that reduce triglycerides and increase hdl. Nature Genetics. 2007;39:513–516. doi: 10.1038/ng1984. [DOI] [PMC free article] [PubMed] [Google Scholar]
- Schaffner S. F., Foo C., Gabriel S., Reich D., Daly M. J., Altshuler D. Calibrating a coalescent simulation of human genome sequence variation. Genome Research. 2005;15:1576. doi: 10.1101/gr.3709305. [DOI] [PMC free article] [PubMed] [Google Scholar]
- Tzeng J. Y., Zhang D. Haplotype-based association analysis via variance-components score test. The American Journal of Human Genetics. 2007;81:927–938. doi: 10.1086/521558. [DOI] [PMC free article] [PubMed] [Google Scholar]
- Victor R. G., Haley R. W., Willett D. L., Peshock R. M., Vaeth P. C., Leonard D., Basit M., Cooper R. S., Iannacchione V. G., Visscher W. A., Staab J. M., Hobbs H. H. Dallas Heart Study Investigators. The Dallas Heart Study: a population-based probability sample for the multidisciplinary study of ethnic differences in cardiovascular health* 1. The American Journal of Cardiology. 2004;93:1473–1480. doi: 10.1016/j.amjcard.2004.02.058. [DOI] [PubMed] [Google Scholar]
- Wu M. C., Lee S., Cai T., Li Y., Boehnke M., Lin X. Rare-variant association testing for sequencing data with the sequence kernel association test. The American Journal of Human Genetics. 2011;89:82–93. doi: 10.1016/j.ajhg.2011.05.029. [DOI] [PMC free article] [PubMed] [Google Scholar]
- Zhang D., Lin X. Hypothesis testing in semiparametric additive mixed models. Biostatistics. 2003;4:57. doi: 10.1093/biostatistics/4.1.57. [DOI] [PubMed] [Google Scholar]
Associated Data
This section collects any data citations, data availability statements, or supplementary materials included in this article.