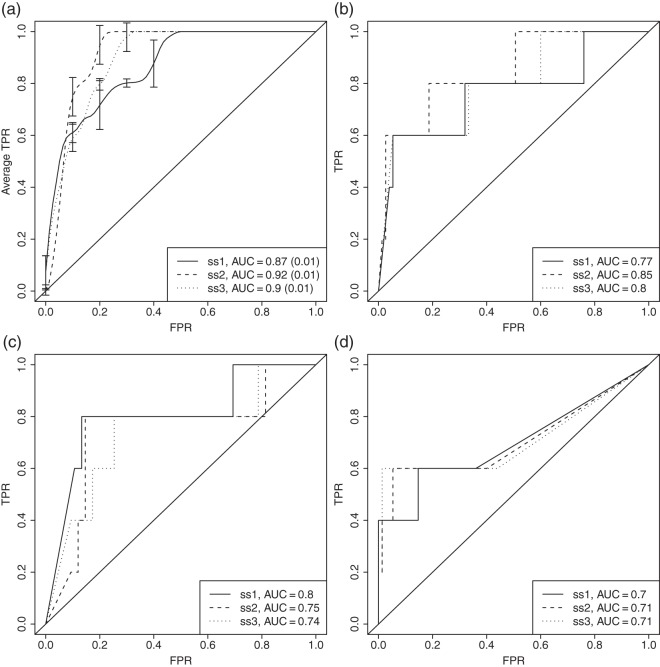
Fig. 2.
Results in the form of ROC curves on the NCI-60 data for our method (a), together with the scoring from GSEA (b), GSA (c), and correlation analysis (d). The ROC curves for our method were generated from 100 replicated runs on each dataset in order to assess the variability from the cross-validation step. The average true positive rate (TPR) is assessed for each fixed false positive rate (FPR) and an average AUC (and its standard deviation) is calculated for each dataset. The error bars show the standard deviation. For GSEA, GSA, and correlation analysis the ROC curves are based on a ranking from a combined p-value using Stouffer’s method (Stouffer and others, 1949).

