Abstract
A new and emerging paradigm in molecular biology is revealing that RNA is implicated in nearly every aspect of the metabolism in the cell. To enhance our understanding of the function of these RNA molecules in the cell, it is essential that we have a complete understanding of their higher-order structures. While many computational tools have been developed to predict and analyse these higher-order RNA structures, few are able to visualize them for analytical purposes. In this paper, we present an interactive visualization tool of the secondary structure of RNA, named RNA2DMap. This program enables multiple-dimensions of information about RNA structure to be selected, customized and displayed to visually identify patterns and relationships. RNA2DMap facilitates the comparative analysis and understanding of RNAs that cannot be readily obtained with other graphical or text output from computer programs. Three use cases are presented to illustrate how RNA2DMap aids structural analysis.
Keywords: Biological Data Visulation, RNA Struaral Analysis, Interative Application
I. INTRODUCTION
RNA structure, function, and evolution are studied with experimental and computational methods. Comparative analysis, one of the computational methods, has been used to determine an RNA’s higher-order structure with high accuracy and detail, principles of RNA structure, and the evolution of RNA and phylogenetic relationships. This analysis is dependent on the number and diversity of the RNA sequences and high-resolution crystal structures within any given RNA family, and the sophistication of the computational system to analyse the data. Information related to RNA sequences is usually stored within a database or in text files with specific formats. We have developed rCAD – RNA Comparative Analysis Database that utilizes the Microsoft SQL-server to organize, manipulate, and analyse these multiple dimensions of information [1] [2]. rCAD is the foundation used to effectively create inter-relationships between multiple types of information. However, from these patterns, biases and relationships in rCAD’s data, we are unable to synthesize all of this knowledge into a complete understanding of RNA’s structure, function, and evolution..
While most computational approaches are developed based on data mining and algorithmic approaches to understand the structure and functions of RNA molecules, visual analytic approaches can provide insights from the data. The secondary structure diagram of RNA is routinely used to visualize the base pairs, helices, and structural motifs of the RNA’s higher-order structure. It is the reference point for discussion and analysis of sequence alignments, high-resolution crystal structures, and evolutionary relationships. Many RNA scientists map their experimental data and other relevant information onto these diagrams. However this is usually done on a figure in a published paper, not as an interactive graphics display.
Our goal is to create a new and novel application to allow researchers to dynamically navigate through this myriad of multiple dimensions of information. RNA2DMap, the focus of this paper, is a new foundation for the dynamic visual presentation of the growing number of data types that will enhance our knowledge of RNA structure, folding, and its evolution. RNA2DMap is akin to the Macroscope, an abstract computational system to facilitate an understanding of a complex system from all of its components, both physical and temporal. RNA2DMap is available at http://www.rna.ccbb.utexas.edu/SAE/2A/RNA2DMap/index.php, part of Comparative RNA Web (CRW) Site [3].
II. BACKGROUND AND RELATED WORK
The initial attempts to visualize RNA secondary structure focused on the automatic drawing algorithms to generate aesthetically pleasing secondary structure diagrams with very limited overlap of strands and interactions [4] [5] [6]. A radial drawing algorithm was implemented in RNAViz which draws each helix and base in a multi-loop at regular angular distances [7]. JViz, includes multiple drawing algorithms such as linear linked graph [8], circular representation and RNA dot plot [9]. RNA View is one of the first applications that displays the tertiary interactions with RNA secondary structure [10]. Pseudo Viewer is a tool for visualizing RNA secondary structure with Pseudoknots, a special type of structure motifs. Pseudo Viewer can efficiently visualize a large RNA sequence with any type of pseudoknot as a compact planar drawing. Pseudo Viewer claims to be 10 times faster than the previous algorithm and produces a more aesthetic structure [11].
Recent developments add features such as interactive editing, annotation, and comparison among a set of RNA secondary structures. RNAMovies is a system for visualizing multiple sets of secondary structure data and creates an interpolated animation of the data [12]. RNAMovies is primarily used to show RNA secondary structure spaces for evaluating different secondary structure predictions. One of the commonly used tools is XRNA, an open source tool to create, annotate and display secondary diagrams of RNA sequences [13]. This software tool is designed as a user interface to create new or edit existing secondary structures in a special format and is limited in its capabilities to create visual representations of the data and to adapt to applications in analysis. A more recent visualization tool for RNA secondary structure is VARNA. This tool draws a RNA secondary structure automatically from a few different RNA structure file formats. VARNA implements four different drawing algorithms in Java [14]. The primary feature for VARNA is for the biologists to interactively edit and annotated secondary structures and can output visualization as static images.
III. VISUALIZATION IMPLEMENTATIONS AND FEATURES
A. Main interface and basic interactions
The main application interface of RNA2DMap (Fig. 1) consists of two groups: control panels on the left side and the main visualization on the right.
Figure 1.
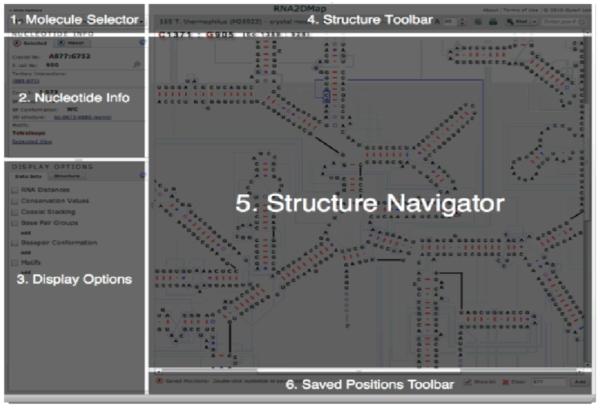
Overview of the RNA2DMap interface.
The control panel is further divided into three parts, (1) a molecule selector, (2) nucleotide information, and (3) display options. Different RNA molecule can be selected with the molecule selector. Panel 2 reveals available sequence and structure information for the nucleotides selected by left-click and/or hovered by the mouse cursor. Panel 3 provides options for different views which will be discussed in details in subsequent sections.
The main visualization panel at the right is composed of three parts, (4) the structure toolbar, (5) the main visualization window – Structure Navigator, and (6) the saved position toolbar. The structure toolbar at the top contains options, to change the size of the secondary structure (zoom controls), to print current view or the entire secondary structure, to locate nucleotides by position number, to present all positions and their base pair partner if they form a secondary or tertiary interaction and the conservation values for each position in a table. The saved position toolbar at the bottom lists those positions that have been selected, by double-clicking on the nucleotide or entering the position number on the bottom right, to be saved in their current state (e.g. RNA distance coloring).
B. Secondary Structure view
Currently the 5S, 16S, and 23S rRNA secondary structure diagrams for the high resolution three-dimensional crystal structures (Thermus thermophiles (16S) and Haloarcula marismortui (5S and 23S)) and the comparative structure models (Escherichia coli) are available. In the future, many more RNA families will be included. The RNA2DMap utilizes the coordinates for an RNA’s secondary structure diagram and maps them within the main visualization window. The visualization can be zoomed in to show details or zoomed out to show an overview of the entire structure with a sliding bar located at the top of the screen to increase or decrease the zoom values. Users can also drag the white space of the visualization to move the current view.
The Display Options panel has two tabs – “Data Sets” and “Structure” (Fig. 2). The graphical format of the nucleotides and base pairs are modified in the “Structure” section. The base pairs symbol by default reveals the conformation, as defined by the Lee & Gutell nomenclature [15]. The symbol and color for each conformation is shown with different glyphs. The legend is in the Display Options panel (Figure 2). The tertiary interactions can be displayed or hidden. The position numbers for the crystal structure and the equivalent Escherichia coli (the typical reference species) positions can also be shown (or hidden) with tic marks every ten positions and numbers displayed every 50.
Figure 2.
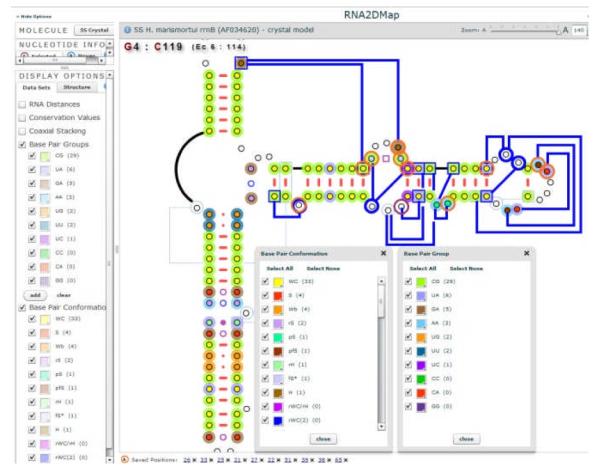
Highlighting the selected base pair groups and their conformations.
C. Visualization of additional information
The “data set” tab in the display options panel includes six types of information: 1) the physical three dimensional distances between the selected nucleotide and all other nucleotides in the RNA molecule, 2) the conservation values for every nucleotide, 3) coaxial stacking of helices, 4) the base pair types, 5) the conformation of the base pairs, and 6) secondary structure motifs.
Highlighting base pairing, conformation and motif
To simultaneously render both types of base pair group and types of conformation, RNA2DMap uses a glyph based visualization technique, a two-colored nested circle representation;the color of the outer circle reveals the base pair type while the color of inner circle is for the base pair’s conformation (Fig. 3). Structural motifs are categorized based on their unique arrangement of base pair types and conformations with unpaired nucleotides. Five different structural motifs, displayed with large colored nucleotide circles are shown in Fig. 3. The sizes of colored circles for motifs are larger than those used for base pair groups. Therefore, users can select multiple base pair groups, different types of conformations and motifs at the same time. The color used for any of the circle rendering can be customized to emphasize the desired pattern.
Figure 3.
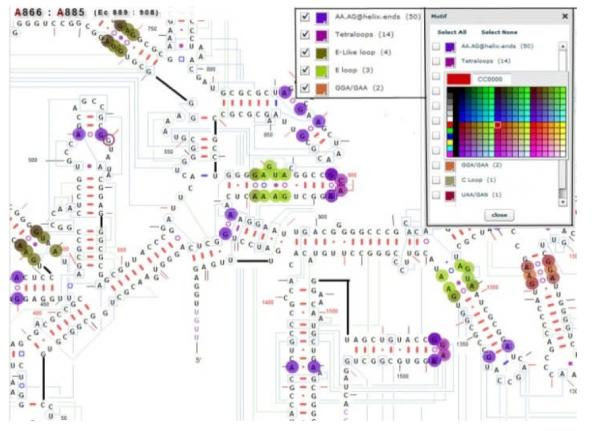
Five motif types are highlighted in different colors.
Showing distance values in three dimensional space
RNA2DMap can also show the distance values between nucleotides based on their position in crystal structure (Fig. 4 - left). The distance values between zero and the user specified upper limit value are mapped to a continuous color map ranging from black to green where black color indicates the smallest distance values and the green color indicates the largest distance values.
Figure 4.
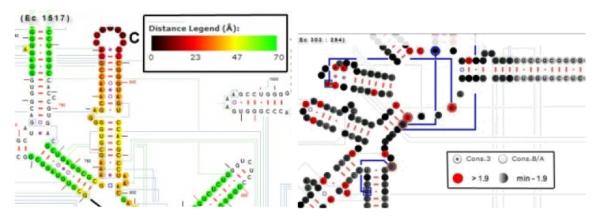
(left) 3D distances are highlighted with a color map; (right) The conservation view of the 16S rRNA secondary structure.
Highlighting conservation values
The extent of nucleotide conservation and variation is determined with a modified Shannon equation [16]. These conservation values are associated with the colors red and different shades of black and gray. Positions that are invariant have a conservation value of 2. Lower values indicate greater variation. Positions with values of 1.9 or greater are shown in red. Positions with values immediately below 1.9 are black. The density of the black decreases with lower conservation values (ie. greater variation). Fig. 4 - right reveals the extent and locations of highly conserved to highly variable regions of the RNA.
IV. EXEMPLAR USER SCENARIOS
A. Explore base pair types and conformation types
A total of 16 base pair types are possible. And each base pair type can form approximately 15 different conformations. The frequency of each base pair type, the conformations associated with each base pair type, and their proximity with one another are diagnostic of the type of structural motif they might be associated with and is fundamental to an RNAs higher-order structure. Visualizing the frequency and organization of the base pair types and their conformations is a very effective means to identify patterns that have been characterized and to discover new patterns that could be a new motif or a variation of an existing motif.
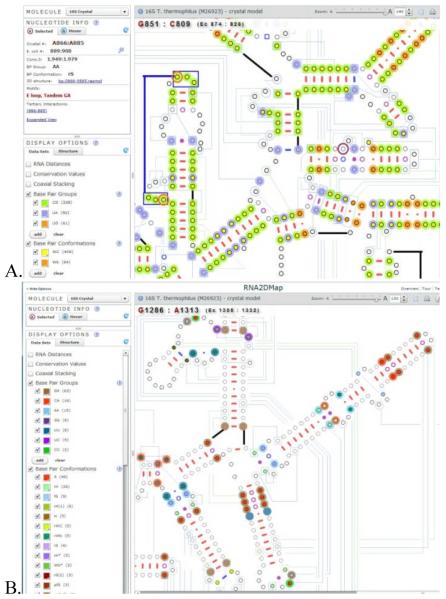
The most frequent base pair groups (G:C, A:U, and G:U) and conformations (Watson-Crick (WC) and Wobble (Wb)), and the least frequent base pair types (G:G, G:A, A:A, A:C, C:C, C:U, and U:U) and conformations (nearly 40 in total) are shown in Figures 5A and 5B respectively. As expected, the vast majority of the most frequent base pair types and conformations occur within the regular secondary structure helices although a few of these base pairs occur outside of the regular helix (Fig 5A). In contrast the vast majority of the least frequent base pair groups and conformations occur outside of the secondary structure helix (Fig 5B). Within this latter group, the most common of the least frequent base pair types is A:G, and the most common of the least frequent conformations is sheared (S). The majority of the A:G base pairs have the sheared conformation. These usually occur immediately adjacent to the end of a secondary structure helix. A previous study revealed that the A:G base pairs at the end of a helix frequently change to A:A base pairs. These A:A base pairs usually form the same sheared conformation [17]. However, there are some exceptions where two consecutive A:G base pairs occur in the middle of the helix. This observation of tandem A:G pairs within a secondary structure helix is consistent with previous analysis [18].
Figure 5.
A (Top). Most frequent base pair groups and conformations. B (Bottom). Least frequent base pair groups and conformations (see text).
B. Nucleotides within structure motifs form tertiary interactions
While comparative analysis accurately predicted the secondary structure for numerous RNAs, including the 5S, 16S, and 23S rRNAs [19], the high-resolution three-dimensional structures for the 30S and 50S ribosomal subunits determined with X-ray crystallography substantiated the comparative structure model for the rRNAs and identified the tertiary interactions that are drawn on our Thermus thermophiles 16S rRNA and Haloarcula marismortui 23S and 5S rRNA secondary structure diagrams [20] [21].
One of the grand challenges in biology is to accurately predict an RNAs secondary and three-dimensional structure. To achieve this very ambitious goal, an understanding of the fundamental rules that influence the correct folding of RNA is essential. The identification and characterization of a few structural motifs, including the tetraloop [22], lone-pair triloop [23], and UAA/GAN [24] all contain specific bases that have a preponderance to hydrogen bond to another base or the sugar-phosphate backbone of the RNA molecule.
Fig. 6 reveals a region of the 23S rRNA that has four examples of these three motifs - two UAA/GAN (reddish orange), one tetraloop (purple), and one lone-pair tri-loop (pink). The tertiary interactions that form base pairs or base-backbone bonding with nucleotides within these motifs are emphasized with a thicker line to distinguish them from the other tertiary structure interactions.
Figure 6.
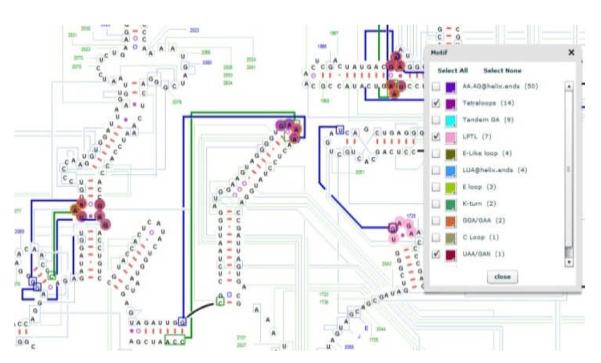
Tertiary interactions between nucleotides in the tetraloop, lone-pair tri-loop, and the UAA/GAN motifs and its partner are drawn with a thicker line in RNA2DMap. Blue lines for base-base interactions and green lines for base-backbone interactions.
C. Investigation of non-base pairing constraints
While the strongest covariation scores for two nucleotide positions indicate a base pair, weaker but still statistically significant covariation scores have been observed for clusters of nucleotides. Our previous analysis of tRNA reveals that the positions involved in these associations are in proximity in the three-dimensional structure of tRNA or between two regions of the tRNA that are involved in a specific function during protein synthesis [25] [26]. Our more recent analysis of 16S rRNA reveals several regions of the rRNA secondary structure that have these clusterings of weaker covariation scores (also called neighbour effects). Fig. 7 reveals the nucleotides that are part of a network of weak covariations. Three sets of covariations are not immediately adjacent with one another on the secondary structure diagram. These shaded regions in Fig. 7 were evaluated with the RNA distance option in RNA2DMap to determine their absolute physical distance based on the coordinates in the high-resolution crystal structure of the T. thermophiles 16S rRNA. All three sets of nucleotides are within hydrogen bonding distance, suggesting that these nucleotides might form a base pair or are sufficiently close in three-dimensional space to have structural constraints with the other nucleotides in these clusters of neighbour effects. This observation with RNA2DMap increases our confidence that these neighbour effects are true structural constraints and demonstrates nucleotides that do not form a base pair can influence the evolution of other nucleotides that are physically close with one another.
Figure 7.
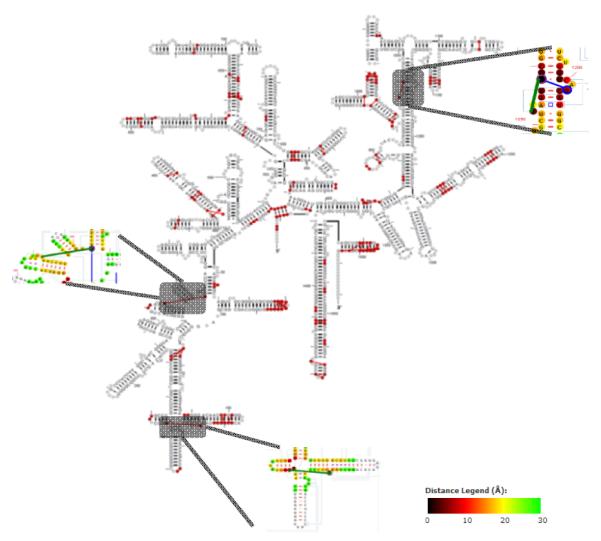
The secondary structural map of T. thermophilus 16S rRNA highlights all neighbor effects (red lines connecting nucleotides).
V. CONCLUSIONS
In this paper, we present RNA2DMap, an interactive tool for visualizing multiple types of information on an RNA secondary structure. The primary visualization is based on the standard RNA secondary structure diagram. Nested circles with different colors were used to reveal multiple dimensions of information, including base pair types, base pair conformations, conservation values of RNA sequences, and the physical three-dimensional distances between the selected nucleotide and all other nucleotides. RNA2DMap has the flexibility to show different combinations of information on the RNA secondary structure. We demonstrate three use cases. The first reveals the frequency and organization of the different base pair types and their conformations. The second reveals tertiary interactions associated with a few of the structural motifs. The third utilizes the RNA distance function to determine if different sets of positions with a weak covariation are sufficiently close in three-dimensional space to either form a base pair or affect the spatial constraints of the nucleotides on other nucleotides in this local region of the RNA structure. RNA2DMap can be adapted to work with any secondary structure diagram generated with other programs.
ACKNOWLEDGEMENT
This work was supported by NIH grants GM085337 (awarded to RG and WX) and GM067317 (awarded to RG), and the Welch Foundation F-1427 (awarded to RG).
REFERENCES
- [1].Xu W, Ozer S, Gutell RR. Covariant Evolutionary Event Analysis for Base Interaction Prediction Using a Relational Database Management System for RNA. In: Winslett, editor. proceedings of Scientific and Statistical Datatbase Management (SSDBM’09), LNCS; Springer; 2009. pp. 200–216. [DOI] [PMC free article] [PubMed] [Google Scholar]
- [2].Ozer S, Doshi KJ, Xu W, Gutell RR. rCAD: A Novel Database Schema for the Comparative Analysis of RNA. IEEE e-science Conference; Dec. 2011; to appear. [DOI] [PMC free article] [PubMed] [Google Scholar]
- [3].Yamamoto K, Sakurai N, Yoshikura H. Graphics of RNA secondary structure; towards an object-oriented algorithm. Comput Appl Biosci. 1987 Jun;vol. 3(no. 2):99–103. doi: 10.1093/bioinformatics/3.2.99. [DOI] [PubMed] [Google Scholar]
- [4].Matzura O, Wennborg A. RNAdraw: an integrated program for RNA secondary structure calculation and analysis under 32-bit Microsoft Windows. Computer Applications in the Biosciences. 1996;vol. 12(no. 3):247–9. doi: 10.1093/bioinformatics/12.3.247. [DOI] [PubMed] [Google Scholar]
- [5].Felciano RM, Chen RO, Altman RB. RNA Secondary Structure as a Reusable Interface to Biological Information Resources. SMI. 1997. SMI-96-0641. [DOI] [PubMed]
- [6].Rijk PD, Wuyts J, Wachter RD. RnaViz 2: an improved representation of RNA secondary structure. Bioinformatics. 2003;vol. 19(no. 2):299–300. doi: 10.1093/bioinformatics/19.2.299. [DOI] [PubMed] [Google Scholar]
- [7]. RNAfamily.. http://bioinfo.lifl.fr/RNA/RNAfamily/rnafamily.php.
- [8].Wiese KC, Glen E, Vasudevan A. JViz.Rna--a Java tool for RNA secondary structure visualization. IEEE Trans Nanobioscience. 2005 Sep.vol. 4(no. 3):212–8. doi: 10.1109/tnb.2005.853646. [DOI] [PubMed] [Google Scholar]
- [9].Yang H, et al. Tools for the automatic identification and classification of RNA base pairs. Nucleic Acids Research. 2003;vol. 31(no. 13):3450–60. doi: 10.1093/nar/gkg529. [DOI] [PMC free article] [PubMed] [Google Scholar]
- [10].Byun Y, Han K. PseudoViewer3: generating planar drawings of large-scale RNA structures with pseudoknots. Bioinformatics. 2009;vol. 25:1435–7. doi: 10.1093/bioinformatics/btp252. [DOI] [PubMed] [Google Scholar]
- [11].Giegerich R, Evers DJ. RNA Movies: visualizing RNA secondary structure spaces. Bioinformatics. 1999;15(1):32–7. doi: 10.1093/bioinformatics/15.1.32. [DOI] [PubMed] [Google Scholar]
- [12].UCSC XRNA. http://rna.ucsc.edu/rnacenter/xrna/xrna.html.
- [13].Darty K, Denise A, Ponty Y. VARNA: Interactive drawing and editing of the RNA secondary structure. Bioinformatics. 2009 Apr;vol. 25(no. 15):1974–5. doi: 10.1093/bioinformatics/btp250. [DOI] [PMC free article] [PubMed] [Google Scholar]
- [14].Lee JC, Gutell RR. Diversity of Base-pair Conformations and their Occurrence in rRNA Structure and RNA Structural Motifs. Journal of Molecular Biology. 2004;vol. 344:1225–1249. doi: 10.1016/j.jmb.2004.09.072. [DOI] [PubMed] [Google Scholar]
- [15].Gutell RR, Weiser B, Woese CR, Noller HF. Comparative anatomy of 16S-like ribosomal RNA. Progress in Nucleic AcidResearch and Molecular Biology. 1985;no. 32:155–216. doi: 10.1016/s0079-6603(08)60348-7. [DOI] [PubMed] [Google Scholar]
- [16].Elgavish T, Cannone JJ, Lee JC, Harvey SC, Gutell RR. AA.AG@Helix.Ends: A:A and A:G Base-pairs at the Ends of 16 S and 23 S rRNA Helices. Journal of Molecular Biology. 2001;vol. 310(no. 4):735–753. doi: 10.1006/jmbi.2001.4807. [DOI] [PubMed] [Google Scholar]
- [17].Gautheret D, Konings D, Gutell RR. A major family of motifs involving G.A mismatches in ribosomal RNA. J. Mol. Biol. 1994;vol. 242(no. 1):1–8. doi: 10.1006/jmbi.1994.1552. [DOI] [PubMed] [Google Scholar]
- [18].Gutell RR, Lee JC, Cannone JJ. The Accuracy of Ribosomal RNA Comparative Structure Models. CurrentOpinion inStructural Biology. 2002;vol. 12(no. 3):301–310. doi: 10.1016/s0959-440x(02)00339-1. 2002. [DOI] [PubMed] [Google Scholar]
- [19].Wimberly BT, et al. Structure of the 30S ribosomal subunit. Nature. 2000;(no. 407):327–339. doi: 10.1038/35030006. [DOI] [PubMed] [Google Scholar]
- [20].Ban N, Nissen P, Hansen J, Moore PB, Steitz TA. The complete a tomic structure of the large ribosomal subunit at 2.4 A resolution. Science. 2000;no. 289:905–920. doi: 10.1126/science.289.5481.905. [DOI] [PubMed] [Google Scholar]
- [21].Woese CR, Winker S, Gutell RR. Architecture of Ribosomal RNA: Constraints on the sequence of Tetra-loops. Proceedings of the National Academy of Sciences. 1990;vol. 87(no. 21):8467–8471. doi: 10.1073/pnas.87.21.8467. [DOI] [PMC free article] [PubMed] [Google Scholar]
- [22].Lee JC, Cannone JJ, Gutell RR. The Lonepair Triloop: A New Motif in RNA Structure. Journal of Molecular Biology. 2003;vol. 325(no. 1):65–83. doi: 10.1016/s0022-2836(02)01106-3. [DOI] [PubMed] [Google Scholar]
- [23].Lee JC, Gutell RR, Russell R. The UAA/GAN internal loop motif: a new RNA structural element that forms a crossstrand AAA stack and long-range tertiary interactions. Journal of Molecular Biology. 2006;vol. 360(no. 5):978–988. doi: 10.1016/j.jmb.2006.05.066. [DOI] [PubMed] [Google Scholar]
- [24].Gutell RR, Power A, Hertz G, Putz E, Stormo G. Identifying Constraints on the Higher-Order Structure of RNA: Continued Development and Application of Comparative Sequence Analysis Methods. Nucleic Acids Research. 1992;(no. 20):5875–95. doi: 10.1093/nar/20.21.5785. [DOI] [PMC free article] [PubMed] [Google Scholar]
- [25].Gautheret D, Damberger SH, Gutell RR. Identification of Base Triples in RNA Using Comparative Sequence Analysis. Journal of Molecular Biology. 1995;vol. 248(no. 1):27–43. doi: 10.1006/jmbi.1995.0200. [DOI] [PubMed] [Google Scholar]
- [26].Cannone JJ, Subramanian S, Schnare MN, Collett JR, D’Souza LM, Du Y, Feng B, Lin N, Madabusi LV, Müller KM, Pande N, Shang Z, Yu N, Gutell RR. The Comparative RNA Web (CRW) Site: An Online Database of Comparative Sequence and Structure Information for Ribosomal, Intron, and Other RNAs. BioMed Central Bioinformatics. 2002;3:2. doi: 10.1186/1471-2105-3-2. [DOI] [PMC free article] [PubMed] [Google Scholar]


