

Abstract
Nanopores have been used in label-free single-molecule studies, including investigations of chemical reactions, nucleic acid analysis and applications in sensing. Biological nanopores generally perform better than artificial nanopores as sensors, but they have disadvantages including a fixed diameter. Here we introduce a biological nanopore ClyA that is wide enough to sample and distinguish large analytes proteins, which enter the pore lumen. Remarkably, human and bovine thrombins, despite 86% sequence identity, elicit characteristic ionic current blockades, which at −50 mV differ in their main current levels by 26 ± 1 pA. The use of DNA aptamers or hirudin as ligands further distinguished the protein analytes. Finally, we constructed ClyA nanopores decorated with covalently attached aptamers. These nanopores selectively captured and internalized cognate protein analytes, but excluded non-cognate analytes, in a process that resembles transport by nuclear pores.
Keywords: Protein sensor, Single-molecule, Translocation, Nuclear pore complex, Nanopore, SheA HlyA
Introduction
The fast and inexpensive detection of proteins is important for the diagnosis and monitoring of many diseases, including cancers,1 diabetes2 and heart disease,3,4 and for anti-doping tests (e.g. to detect erythropoietin5). Biological and synthetic nanopores, with electrical read-outs amenable for integration into low-cost, portable electronic devices, have been used to detect individual analyte molecules by engineering a binding element within the nanopore.6–8 The nature of the current blockades (e.g. the amplitude) provoked by the analyte’s binding to the nanopore is used to recognize the molecule, while the frequency of occurrence of the blockades is used to quantify the analyte. The alpha-hemolysin (αHL) protein nanopore (Fig. 1A) has been particularly effective for the detection of small molecules and ions,9,10 organic molecules, including reactive toxic agents11 and oligonucleotides by sequence-specific duplex formation.12 However, only compact molecules with a mass of <2,000 Da or unfolded polymers, such as PEG or single-stranded nucleic acids, can enter or pass through the αHL nanopore, which has a diameter of ~2.7 nm at the wider entrance. Analytes too large to enter the αHL pore, such as proteins, can only be detected by engineering recognition sites outside the pore.13–18 Synthetic19 and DNA origami 20,21 nanopores, with variable dimensions, have been used to detect proteins by translocation either in isolation20,22,23 or in association with DNA molecules.24 Protein analytes have also been detected by the incorporation of binding sites on lipid bilayers lining synthetic pores, e.g. bound proteins were detected electrically as they diffused from one side of the nanopore to the other.7,8 Here we develop a protein pore, amenable to precise engineering, that can detect protein analytes after entry into the pore lumen by their characteristic current blocks. Further, the passage of protein analytes into the interior of the pore can be mediated selectively by the attachment of aptamers at the pore mouth.
Fig 1. ClyA nanopore.

A: Sections through the staphylococcal αHL (left, PDB: 7AHL, pI = 7.9) and S. typhi ClyA nanopores (center, pI = 5.1) The latter was constructed by homology modeling from the E. coli ClyA structure (PDB: 2WCD, 90% sequence identity) by using the Brugel software.39 Right, from top to bottom: FP (30 kDa, pI = 6.3), lysozyme (15 kDa, pI = 11.4) and HT.(37 kDa, pI 6.4–7.6, due to the presence of different isozymes, http://www.sigmaaldrich.com/life-science/metabolomics/enzyme-explorer/analytical-enzymes/thrombins.html). The proteins are shown as surface representations and colored according to their “in vacuum” electrostatics (red for negative regions, and blue for positive regions, Pymol). B: Oligomerization of the ClyA ortholog from S. typhi examined by native blue gel electrophoresis by using a 4–15% polyacrylamide gradient. Lane 1: markers. Lane 2: ClyA oligomers in 0.5% DDM. Lane 3: ClyA oligomers after the addition of 0.5% SDS. The ClyA oligomers appeared as four to five bands in native gels, but only the major band, marked with an arrow, was extracted from the gel and used for subsequent experiments. C: Histogram showing the distribution of the unitary conductance values of ClyA pores in planar lipid bilayers under an applied potential of −35 mV (n = 64). Pores with unitary conductance values higher or lower than one SD of the mean value (−64 ± 3 pA) were not used in the experiments described in the rest of this paper. D: Current-voltage curve for a typical ClyA pore. All electrical recordings were carried out in 150 mM NaCl, 15 mM Tris.HCl pH 7.5 at 28°C.
ClyA nanopores
Inspired by the recently disclosed crystal structure of E. coli cytolysin A (ClyA, PDB: 2WCD),25 we have investigated the ability of ClyA pores to detect small to medium-sized proteins, which we predicted would fit within the lumen of the dodecameric structure (Fig. 1A). The ClyA orthologue from S. typhi was preferred to E. coli ClyA (90% sequence identity), because of its lower intrinsic noise in planar lipid bilayer recordings;26 and the two native cysteine residues (at position 87 and 285) were replaced by serine to create a cysteine-free ClyA variant.
ClyA monomers containing a C-terminal oligo-histidine tag (35 kDa) were expressed in E. coli cells and purified by Ni-NTA affinity chromatography (SI). ClyA dodecamers, formed by the addition of 0.2% β-dodecyl maltoside (DDM)27, did not retain their folded structure in SDS (Figure 1B, lane 3), and therefore they were separated from monomers by blue native poly-acrylamide gel electrophoresis (Fig. 1B, lane 2). ClyA pores were incorporated into planar lipid bilayers by adding 0.01–0.1 ng of oligomeric ClyA to the cis compartment of a planar lipid bilayer recording chamber. ClyA pores showed a unitary conductance of 1.8 ± 0.1 nS (−35 mV, 150 mM NaCl, 15 mM Tris.HCl, pH 7.5, Fig. 1C). Under these conditions, between +60 and −90 mV, ClyA pores did not gate significantly and exhibited ionic currents (Fig. S1) with a signal-to-noise ratio ~10-fold greater than that of biological nanopores of smaller dimensions (e.g. αHL28 or MspA29). Outside this range of potentials, ClyA pores showed long lasting current blockades, which could be relieved by rapid reversal of the applied potential. The current-voltage relationship (Fig. 1D) was slightly asymmetrical, which allowed the orientation of the pore in lipid bilayers to be assessed.
Interaction of proteins with the ClyA pore
At −35 mV (trans), in 150 mM NaCl, 15 mM Tris.HCl, pH 7.5, the addition of nanomolar concentrations of several proteins to the cis compartment provoked frequent and characteristic current blockades (Fig. 2A), quoted here as the residual current as a percentage of the open pore current (IRES%). The lysozyme (15 kDa) blockades were short current spikes of variable amplitude (Fig. 2A). The median duration of the current spikes (85 ± 15 μs, n = 6 experiments) approached the signal filtering rate (10 kHz). Therefore the duration of lysozyme events is probably an overestimate, and IRES% cannot be accurately determined. Dendra2_M159A (FP, a GFP like protein, 30 kDa) mostly showed well-defined current blockades, IRES% = 71.6 ± 1.3% with a median duration of 6.6 ± 0.8 ms (n = 3, Fig. 2A). Occasionally, within such an event, deeper current blockades were observed (IRES% = 15.1 ± 2.3%, n = 3). Under the same conditions, bovine thrombin (BT, 37 kDa) and human thrombin (HT, 37 kDa) provoked current blockades that lasted for minutes. As occasionally observed within the FP events, the signal rapidly switched between a shallow (level 1) and a deep (level 2) blockade. BT and HT current levels 1 showed IRES% = 52.4 ± 0.8% and 56.0 ± 0.7%, respectively (n = 4), while BT and HT levels 2 had IRES% = 23.3 ± 0.7% and 23.2 ± 0.7%, respectively (n = 4). Therefore, despite HT and BT having 86% identity in the heavy B chains and 55% identity in the light A chains (Fig. 2B), the HT and BT blockades were readily differentiated (Fig. 2A). The distributions between the two levels depended on the applied potential and differed for HT and BT (Fig. 2C), most markedly at −50 mV (Fig. S2), providing an additional means to distinguish between the two proteins. Current blockades provoked by HT and BT could be easily distinguished in samples containing a mixture of the two analytes (Fig. S2).
Fig 2. Protein-induced ionic current blocks.

A: from left to right: typical current blockades provoked by lysozyme, FP, HT and BT, respectively, at −35 mV in 150 mM NaCl, 15 mM Tris.HCl, pH 7.5. The HT and BT blocks lasted for several minutes and only the first few seconds of each current trace are shown. Blue and red boxes highlight level 1 and level 2 of the thrombin current blockades. Lysozyme blockades were recorded by applying a 10 kHz low-pass Bessel filter and using a 20 μs (50 kHz) sampling rate. The other recordings used a 2 kHz filter and 10 kHz sampling. B: Ribbon representation of a structural alignment of HT (green) and BT (red) generated with PDBeFold (http://www.ebi.ac.uk/msd-srv/ssm/ssmstart.html; PDB: 1AD8 and 3PMA, for HT and BT, respectively). C: Voltage-dependence of the occupancy of level 1 for HT (green) and BT (red) as a percentage of the total blockade duration (n=3). All recordings were carried out at −35 mV in 150 mM NaCl, 15 mM Tris.HCl, pH 7.5 at 28°C.
Using ligands to facilitate the distinction between proteins
Ligands with selective binding properties are often used to identify analytes in complex biological samples. Ligands or inhibitors can also be used to target subpopulations of macromolecular analytes based on conformation or functional properties. We tested the effects of DNA aptamers evolved to bind to thrombin (TBA) or lysozyme (LBA); and hirudin, a 65 amino acid protein from Hirudo medicinalis, which is the most potent natural inhibitor of thrombin. At −35 mV, the addition of either TBA (Fig. 3A) or hirudin (not shown) almost completely suppressed the binding of HT to ClyA. Similarly, the addition of LBA reduced the frequency of the current blockades induced by lysozyme (Fig. S3). Therefore, in a mixture where several analytes are present, the identity and concentration of an analyte can be more precisely determined by the addition of a macromolecular ligand.
Fig 3. Interactions of proteins with the ClyA pore in the presence of various ligands.

A: Effect of the TBA aptamer on thrombin-induced current blockades. The addition of 8 μM TBA almost entirely suppresses the blockades induced by 12 nM HT. After each thrombin capture, the open pore was regenerated by manual reversal of the potential to +35 mV. Spikes below the open pore current level represent capacitive transients. B: Voltage step protocol used to collect the traces in C–E. C–E: left, ionic current recordings corresponding to the voltage protocol in B. Right, models for the interaction of HT (green), hirudin (red) and TBA (orange) with the ClyA pore (grey). C, at −90 mV [open pore current, O(−90) = 150 ± 6 pA], HT current blockades have IRES% = 22.4 ± 1.1% [L2 HT(−90) = 33.6 ± 2.1 pA] suggesting that HT binds close to the narrower trans exit of the pore. Upon stepping to −35 mV, the current fluctuates between two levels with IRES% = 23.2 ± 0.7% [L2 HT(−35) = 14.6 ± 0.8 pA] and IRES% = 56.0 ± 0.7% [L1 HT(−35) = 35.3 ± 1.7 pA]. We suggest that HT moves back and forth between two sites within the nanopore, as shown on the model on the right. D, upon the subsequent addition of an equimolar concentration of hirudin, at −90 mV, the vast majority of blocks displayed IRES% = 55.6 ± 0.5% [L1 HT:h(−90) = 83.4 ± 3.4 pA], suggesting that the HT:hirudin complex binds close to the cis entrance of the pore than HT. Reducing the applied potential to −35 mV quickly restored the open pore current [O(−35) = 63 ± 3 pA] from IRES% = 55.2 ± 0.8% [L1 HT:h(−35) = 34.7 ± 1.7 pA], suggesting that the HT:hirudin complex is expelled from the pore. E, At −90 mV, the current block provoked by the TBA:thrombin complex switches from IRES% = 50.6% ± 2.0 [L1 HT:TBA(−90) = 75.9 ± 4.2 pA] to IRES% = 21.9 ± 1.0% [L2 HT(−90) = 32.9 ± 2.0 pA]. Subsequent reduction of the applied potential to −35 mV gives a current block that is typical for HT alone. A likely interpretation is that upon dissociation from the aptamer, HT is pulled deep into the lumen of the pore. Recordings were carried out in 150 mM NaCl, 15 mM Tris.HCl, pH 7.5 at 28°C. The concentrations of HT and hirudin were 24 nM. The TBA concentration was 8 μM.
Physical model for the interaction of the protein analytes with ClyA nanopores
Although excluded from ClyA at −35 mV, the protein:ligand complexes were captured at −90 mV. An automated cyclic voltage protocol, where the bias was repeatedly switched from −90 mV to −35 mV (Fig. 3B), was used to investigate the interaction between HT and ClyA pores. At −90 mV, HT current blockades had IRES% = 22.4 ± 1.1% (n = 3); upon stepping to −35 mV, the current fluctuated between two levels with IRES = 23.2 ± 0.7% and IRES% = 56.0 ± 0.7% (Fig. 3C). By contrast, after the addition of hirudin, at −90 mV, the vast majority of blockades displayed IRES% = 55.6 ± 0.5 %, and reduction of the applied potential to −35 mV restored the open pore current (Fig. 3D). At −90 mV, the current blockades provoked by the HT:TBA complex switched from IRES% = 50.6 ± 2% to IRES% = 21.9 ± 1.0% with a mean lifetime of 0.9 ± 0.3 s (n = 3). The subsequent reduction of the applied potential to −35 mV produced current blockades that fluctuated between two current levels as observed for HT alone (Fig. 3E).
These data suggest that the two current levels, level 1 and level 2, observed for HT (IRES% = 50 to 56% and IRES% = 22 to 23%, respectively, depending on the applied potential and whether the protein is complexed with a ligand) and FP (IRES% = 72% and IRES% = 15%, respectively, −35 mV), reflect two residence sites for proteins within the lumen of the ClyA pore; level 2 is associated with residence of the protein analyte at a deep, more sterically constrained site, with the ClyA pore, while level 1 is associated with residence of the protein analyte at a position closer to the wider cis entrance of the pore (Fig. 3C–E). The rapid movement of the protein analyte between the two sites elicits the two current levels seen within the same blockade.
Two lines of evidence support this interpretation. First, the contribution of level 2, for both HT and FP, is more pronounced at high-applied potentials (Fig. 2C and not shown, respectively), while level 1 dominates at low potentials, suggesting that the driving force of electrophoresis and/or electroosmosis pulls the protein analyte deeper into the pore.30 At pH 7.5, FP and HT have a net negative charge (pI = 6.1 and 6.4–7.6, respectively, Fig. 1A). Therefore, at −35 mV, the electrophoretic force on HT and FP opposes net movement of the proteins into the ClyA barrel. Electroosmosis is therefore most likely the dominant force causing movement deep into the pore.30 ClyA pores are cation selective (permeability ratio, Pcation/Panion, = 3.027) and at negative potentials (trans) there is a net flow of water from cis to trans. Such electroosmotic flow, which increases with the ionic current, has a strong effect on the movement of analytes including proteins,30,31 which is demonstrated here by the fact that proteins added to the cis compartment enter the pore only at negative applied potentials.
Second, when bound to large ligands such as hirudin or DNA aptamers, thrombin shows only level 1 blockades with IRES% values of 55% and 50% respectively, at a high applied potential (−90 mV), while free HT dwells only at level 2 with IRES% = 22% (Fig. 3C–E). Since both DNA and hirudin (pI ~3.5) are negatively charged, it is reasonable to think that these ligands prevent thrombin from reaching the deep site within ClyA, because they are more strongly opposed by the applied potential or repelled by electrostatic interactions with residues in the lumen on the pore. The large ligands may also provide a steric impediment to movement to level 2.
Aptamer sieves
The grafting of a specific binding function onto a nanopore can be used to improve sensitivity or to introduce selectivity towards a specific analyte or class of analytes.6 We conjugated TBA or LBA aptamers to ClyA monomers (at position 110) and the complex was purified by blue native poly-acrylamide gel electrophoresis (SI). Assembled homododecameric ClyA nanopores therefore contained 12 aptamers ~2 nm apart (Fig. 4A–B and Fig. S4A). By this means, we aimed to create a selectivity filter at the entrance to the ClyA vestibule that would promote the capture of cognate substrates and exclude non-cognate substrates.
Fig 4. Protein interactions with ClyA-aptamer conjugates.

A: TBA-ClyA and LBA-ClyA pores were prepared by coupling aptamer oligonucleotides containing an activated thiol group (attached to an hydroxyl end of the DNA by a trimethylene or hexamethylene linker, SI) to ClyA monomers containing a single cysteine at position 110. Dodecameric pores, formed by the addition of 0.2% DDM to gel-purified modified monomers, were separated by native blue gel electrophoresis in 4–15% polyacrylamide gels. Aptamer-ClyA pores were extracted from the gels and used directly in planar bilayer experiments. Lane 1, TBA-ClyA oligomers. Lane 2, LBA-ClyA oligomers. Lane 3, ClyA oligomers. Lane 4, markers. B: Cartoon representation (to scale) of an aptamer-ClyA pore. Aptamers are in orange, the pore in grey and the lipid bilayer in blue. The arrow indicates the position of residue 110. C: HT detection with TBA-ClyA nanopores. The addition of 12 nM HT to a TBA-ClyA pore (left) elicits frequent ionic current blockades, indicating that thrombin molecules pass through the aptamers atop the pore and lodge inside the pore vestibule. After each thrombin capture, the open pore current was regenerated by reversal of the potential to +35 mV. The addition of 20 mM DTT (right), reduced the disulfide bonds between the aptamers and the pore in about 10–20 min. During this period, the frequency of HT capture was reduced by 2.9-fold ± 0.8. D: HT detection with TBA-ClyA pores in the presence of FP. The addition of 2 nM HT and 268 nM FP to TBA-ClyA pores provokes ionic current blockades that are due to thrombin (black) and FP (blue) entering the lumen of the nanopore. Despite a 100-fold excess of FP, twice as many blockades for HT than for FP were detected (0.20 ± 0.07 and 0.11 ± 0.04 blockades per second for HT and FP, respectively, n = 3). The addition of 8 μM free TBA aptamer selectively decreased the frequency of HT blocks (middle). 20 min after the addition of 20 mM DTT, the aptamers atop the ClyA pore had been cleaved off and FP could enter the pore more readily (5.4 ± 1.1 s−1, right). Currents were recorded at −35 mV applied in 150 mM NaCl, 15 mM Tris.HCl, pH 7.5 at 28°C.
The aptamer-conjugated pores (TBA-ClyA and LBA-ClyA) showed slightly higher unitary conductance values than “naked” ClyA pores (Fig. 4C–D and S4C), and an increase in the frequency of analyte capture. TBA-ClyA pores showed an increased frequency of HT capture of 2.9-fold ± 0.8 (−35 mV, 12 nM HT, 150 mM NaCl, 15 mM Tris.HCl, pH 7.5, n = 3), and LBA-ClyA pores an increased frequency of lysozyme capture of 15-fold ± 7 (−10 mV, 80 nM lysozyme, 75 mM NaCl, 15 mM Tris.HCl, pH 7.5, n = 3). These effects were eliminated when the aptamer linkers were cleaved with 20 mM DTT (Fig. 4C). The frequency of current blockades increased linearly with the cognate analyte concentration (Fig. S5A and B), allowing the quantification of the protein analytes. At the lowest concentration of thrombin (1 nM) and lysozyme (7 nM) the current blockades occurred at about 0.1 s−1 and 1 s−1, respectively.
Although TBA-ClyA and LBA-ClyA showed increased rates of capture for HT and lysozyme, the capture of non-cognate proteins was dramatically reduced. For example, when 2.2 nM HT and 268 nM FP were added to the cis side of a TBA-ClyA pore, there were twice as many HT blockades as FP blockades (Fig. 4D, left) despite the ~100-fold excess of FP. The addition of 8 μM TBA selectively suppressed the thrombin blocks (Fig. 4D, middle). Finally, during aptamer cleavage from the ClyA pores by the addition of 20 mM DTT, the FP blocks gradually increased from 0.33 ± 0.13 s−1 μM−1 to 18 ± 4 s−1 μM−1 (n = 3), which is close to the FP capture frequency observed with the unmodified ClyA pore (19 ± 4 s−1 μM−1, n = 3, Fig. 4D, right). The cleavage of the aptamers could be observed by a step-wise decrease in the ionic current (Fig. S6). A similar effect was observed when dimeric malate dehydrogenase from pig heart (35 kDa monomer) was used instead of FP (Fig. S7). Together, these results suggest that aptamers conjugated at the mouth of ClyA nanopores behave as selective sieves; protein analytes that bind to the aptamers are conveyed into the lumen of the pore, while other proteins are excluded (Fig. 5A).
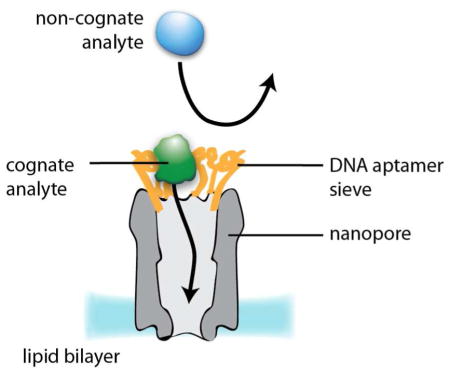
Fig 5. ClyA-aptamer nanopores mimic the NPC functionality.

A: Cognate protein analytes (green) binding to the aptamers (orange) are conveyed into the lumen of ClyA nanopores (gray), while non-cognate analytes (light blue) are excluded. B: Transport factors in complex with their cargo (dark blue and orange, respectively), recognized by the cytoplasmic FG-nucleoporins filaments (green), are translocated through a NPC (gray) lined with FG-repeats (light blue); while passive diffusion of proteins larger than ~40 kDa is prevented.36
Conclusion
We present a new protein nanopore, ClyA, for the single-molecule detection of macromolecules. By contrast with the interior of the αHL pore, we have shown that the lumen of the ClyA nanopore is large enough to accommodate folded proteins of at least 40 kDa (Fig. 1A). In one aspect of our approach, there is no need to design a binding site to allow detection, as protein analytes bind non-specifically within the nanopore and produce characteristic current blockades at nanomolar concentrations. Two of the proteins examined, HT and BT, share 86% sequence identity. This approach can be enhanced by observing the change in the character of the current blockades after the addition of analyte-specific ligands.
In stochastic sensing, analyte specificity has been obtained by building individual binding sites into the nanopore.6 Previously, aptamers13 and antibodies7 have been incorporated within nanopores and the cognate protein analyte recognized by small disruptions of the ionic current provoked by the ligand:analyte complex. In the approach described in the present work, protein analytes are recognized by large characteristic current blockades while they are lodged within the pore. In an effort to augment molecular recognition, we decorated the entrance of the ClyA nanopore with rings of 12 protein-specific aptamers spaced ~2 nm apart. To our delight, the modified nanopores showed enhanced blockade frequencies for protein analytes that bind to the aptamers, while the frequency of blockades by non-cognate proteins was dramatically reduced (Fig. 5A). We suggest that a cognate analyte binds to the forest of aptamers at the pore entrance and is then released into the pore lumen where it produces its characteristic signal. Therefore, we have demonstrated a new sensing principle that operates by a mechanism similar to that of the nuclear pore complex (NPC), a ~40 nm-diameter structure lined by natively disordered proteins (FG-nucleoporins).32,33 Passive diffusion of proteins through NPCs is hindered, while transport factors overcome this restriction by transient binding to the nucleoporins34–36 (Fig. 5B).
METHODS
Preparation of ClyA pores
A S. typhi ClyA gene where the two cysteine residues (C87 and C285) of the wild type sequence were replaced with serine, and containing a C-terminal hexahistidine tag, was synthesized by GenScript and verified by DNA sequencing. ClyA was expressed in E. coli (DE3) pLysS cells by using a pT7 plasmid. As documented in the Supplementary Information, monomers were purified by using Ni-NTA affinity chromatography and oligomerized in the presence of 0.2% β-dodecyl maltoside (GLYCON Biochemicals GmbH).37 Oligomeric pores were separated from monomers by native gel electrophoresis.
Electrical recordings
Ionic currents were measured by recording from planar bilayers formed from diphytanoyl-sn-glycero-3-phosphocholine (Avanti Polar Lipids, Alabaster, AL). Currents were measured with Ag/AgCl electrodes by using a patch-clamp amplifier (Axopatch 200B, Axon Instruments, Foster City, CA).38
Supplementary Material
Acknowledgments
We thank the European Research Council (European Commission’s Seventh Framework Programme, project n° 260884) and the National Institutes of Health for funding. BM is funded by a Ph.D. grant from the Agency for Innovation by Science and Technology (IWT) Flanders. We thank Tom Venken for the homology model of S. typhi ClyA.
Hagan Bayley is the Founder, a Director and a share-holder of Oxford Nanopore Technologies, a company engaged in the development of stochastic sensing. Work in the Bayley laboratory at the University of Oxford is supported in part by Oxford Nanopore Technologies. The present work was not supported by Oxford Nanopore Technologies.
Footnotes
Author contributions
GM, SC and HB initiated nanopore experiments on ClyA, GM, MS and SC designed the research. MS, SC, AB, GM and BM performed the research, GM, MS and HB wrote the paper.
Supporting Information Available: Full documentation of material methods; additional discussion and additional results including: noise characteristics of ClyA nanopores, thrombin blockades at −50 mV, LBA binding to lysozyme, further characterization of ClyA nanopores, dose response for LBA-ClyA and TBA-ClyA, cleavage of aptamers from TBA-ClyA pores, and selective detection by TBA-ClyA pores in the presence of malate dehydrogenase. This material is available free of charge via the Internet at http://pubs.acs.org.
References
- 1.Tainsky MA. Biochim Biophys Acta. 2009;1796:176. doi: 10.1016/j.bbcan.2009.04.004. [DOI] [PMC free article] [PubMed] [Google Scholar]
- 2.Riaz S, Alam SS, Akhtar MW. J Pharm Biomed Anal. 2010;51:1103. doi: 10.1016/j.jpba.2009.11.016. [DOI] [PubMed] [Google Scholar]
- 3.Kaptoge S, Di Angelantonio E, Lowe G, Pepys MB, Thompson SG, Collins R, Danesh J. Lancet. 2010;375:132. [Google Scholar]
- 4.Nozaki T, Sugiyama S, Koga H, Sugamura K, Ohba K, Matsuzawa Y, Sumida H, Matsui K, Jinnouchi H, Ogawa H. J Am Coll Cardiol. 2009;54:601. doi: 10.1016/j.jacc.2009.05.022. [DOI] [PubMed] [Google Scholar]
- 5.Pascual JA, Belalcazar V, de Bolos C, Gutierrez R, Llop E, Segura J. Ther Drug Monit. 2004;26:175. doi: 10.1097/00007691-200404000-00016. [DOI] [PubMed] [Google Scholar]
- 6.Bayley H, Cremer PS. Nature. 2001;413:226. doi: 10.1038/35093038. [DOI] [PubMed] [Google Scholar]
- 7.Wei R, Gatterdam V, Wieneke R, Tampe R, Rant U. Nat Nanotechnol. 2012 doi: 10.1038/nnano.2012.24. [DOI] [PubMed] [Google Scholar]
- 8.Yusko EC, Johnson JM, Majd S, Prangkio P, Rollings RC, Li J, Yang J, Mayer M. Nat Nanotechnol. 2011;6:253. doi: 10.1038/nnano.2011.12. [DOI] [PMC free article] [PubMed] [Google Scholar]
- 9.Braha O, Gu LQ, Zhou L, Lu X, Cheley S, Bayley H. Nature biotechnology. 2000;18:1005. doi: 10.1038/79275. [DOI] [PubMed] [Google Scholar]
- 10.Hammerstein AF, Shin SH, Bayley H. Angew Chem Int Ed Engl. 2010;49:5085. doi: 10.1002/anie.200906601. [DOI] [PubMed] [Google Scholar]
- 11.Wu HC, Bayley H. J Am Chem Soc. 2008;130:6813. doi: 10.1021/ja8004607. [DOI] [PubMed] [Google Scholar]
- 12.Howorka S, Cheley S, Bayley H. Nature biotechnology. 2001;19:636. doi: 10.1038/90236. [DOI] [PubMed] [Google Scholar]
- 13.Rotem D, Jayasinghe L, Salichou M, Bayley H. J Am Chem Soc. 2012;134:2781. doi: 10.1021/ja2105653. [DOI] [PMC free article] [PubMed] [Google Scholar]
- 14.Astier Y, Kainov DE, Bayley H, Tuma R, Howorka S. ChemPhysChem. 2007;8:2189. doi: 10.1002/cphc.200700179. [DOI] [PubMed] [Google Scholar]
- 15.Cheley S, Xie H, Bayley H. Chembiochem. 2006;7:1923. doi: 10.1002/cbic.200600274. [DOI] [PubMed] [Google Scholar]
- 16.Xie H, Braha O, Gu LQ, Cheley S, Bayley H. Chem Biol. 2005;12:109. doi: 10.1016/j.chembiol.2004.11.013. [DOI] [PubMed] [Google Scholar]
- 17.Howorka S, Nam J, Bayley H, Kahne D. Angew Chem Int Ed Engl. 2004;43:842. doi: 10.1002/anie.200352614. [DOI] [PubMed] [Google Scholar]
- 18.Movileanu L, Howorka S, Braha O, Bayley H. Nature biotechnology. 2000;18:1091. doi: 10.1038/80295. [DOI] [PubMed] [Google Scholar]
- 19.Dekker C. Nat Nanotechnol. 2007;2:209. doi: 10.1038/nnano.2007.27. [DOI] [PubMed] [Google Scholar]
- 20.Wei R, Martin TG, Rant U, Dietz H. Angew Chem Int Ed Engl. 2012;51:4864. doi: 10.1002/anie.201200688. [DOI] [PubMed] [Google Scholar]
- 21.Bell NA, Engst CR, Ablay M, Divitini G, Ducati C, Liedl T, Keyser UF. Nano Lett. 2012;12:512. doi: 10.1021/nl204098n. [DOI] [PubMed] [Google Scholar]
- 22.Han A, Creus M, Schurmann G, Linder V, Ward TR, de Rooij NF, Staufer U. Anal Chem. 2008;80:4651. doi: 10.1021/ac7025207. [DOI] [PubMed] [Google Scholar]
- 23.Fologea D, Ledden B, McNabb DS, Li JL. Appl Phys Lett. 2007;91 doi: 10.1063/1.2767206. [DOI] [PMC free article] [PubMed] [Google Scholar]
- 24.Smeets RMM, Kowalczyk SW, Hall AR, Dekker NH, Dekker C. Nano Lett. 2009;9:3089. doi: 10.1021/nl803189k. [DOI] [PubMed] [Google Scholar]
- 25.Mueller M, Grauschopf U, Maier T, Glockshuber R, Ban N. Nature. 2009;459:726. doi: 10.1038/nature08026. [DOI] [PubMed] [Google Scholar]
- 26.von Rhein C, Bauer S, Lopez Sanjurjo EJ, Benz R, Goebel W, Ludwig A. International Journal of Medical Microbiology. 2009;299:21. doi: 10.1016/j.ijmm.2008.06.004. [DOI] [PubMed] [Google Scholar]
- 27.Ludwig A, Bauer S, Benz R, Bergmann B, Goebel W. Molecular Microbiology. 1999;31:557. doi: 10.1046/j.1365-2958.1999.01196.x. [DOI] [PubMed] [Google Scholar]
- 28.Mohammad MM, Iyer R, Howard KR, McPike MP, Borer PN, Movileanu L. J Am Chem Soc. 2012 doi: 10.1021/ja3043646. [DOI] [PMC free article] [PubMed] [Google Scholar]
- 29.Butler TZ, Pavlenok M, Derrington IM, Niederweis M, Gundlach JH. Proc Natl Acad Sci U S A. 2008;105:20647. doi: 10.1073/pnas.0807514106. [DOI] [PMC free article] [PubMed] [Google Scholar]
- 30.Firnkes M, Pedone D, Knezevic J, Doblinger M, Rant U. Nano Lett. 2010;10:2162. doi: 10.1021/nl100861c. [DOI] [PubMed] [Google Scholar]
- 31.Gu LQ, Cheley S, Bayley H. Proc Natl Acad Sci U S A. 2003;100:15498. doi: 10.1073/pnas.2531778100. [DOI] [PMC free article] [PubMed] [Google Scholar]
- 32.Jovanovic-Talisman T, Tetenbaum-Novatt J, McKenney AS, Zilman A, Peters R, Rout MP, Chait BT. Nature. 2009;457:1023. doi: 10.1038/nature07600. [DOI] [PMC free article] [PubMed] [Google Scholar]
- 33.Kowalczyk SW, Kapinos L, Blosser TR, Magalhaes T, van Nies P, Lim RY, Dekker C. Nat Nanotechnol. 2011;6:433. doi: 10.1038/nnano.2011.88. [DOI] [PubMed] [Google Scholar]
- 34.Bilokapic S, Schwartz TU. Curr Opin Cell Biol. 2012;24:86. doi: 10.1016/j.ceb.2011.12.011. [DOI] [PMC free article] [PubMed] [Google Scholar]
- 35.Beck M, Lucic V, Forster F, Baumeister W, Medalia O. Nature. 2007;449:611. doi: 10.1038/nature06170. [DOI] [PubMed] [Google Scholar]
- 36.Grossman E, Medalia O, Zwerger M. Annu Rev Biophys. 2012;41:557. doi: 10.1146/annurev-biophys-050511-102328. [DOI] [PubMed] [Google Scholar]
- 37.Eifler N, Vetsch M, Gregorini M, Ringler P, Chami M, Philippsen A, Fritz A, Muller SA, Glockshuber R, Engel A, Grauschopf U. EMBO J. 2006;25:2652. doi: 10.1038/sj.emboj.7601130. [DOI] [PMC free article] [PubMed] [Google Scholar]
- 38.Maglia G, Heron AJ, Stoddart D, Japrung D, Bayley H. Methods in Enzymology, Vol 475: Single Molecule Tools, Pt B. 2010;474:591. doi: 10.1016/S0076-6879(10)75022-9. [DOI] [PMC free article] [PubMed] [Google Scholar]
- 39.Desmet J, De Maeyer M, Hazes B, Lasters I. Nature. 1992;356:539. doi: 10.1038/356539a0. [DOI] [PubMed] [Google Scholar]
Associated Data
This section collects any data citations, data availability statements, or supplementary materials included in this article.