

Abstract
Purpose
To assess the shape of the dose response for various cancer endpoints, and modifiers by age and time.
Methods and Materials
Re-analysis of the US peptic ulcer data testing for heterogeneity of radiogenic risk by cancer endpoint (stomach, pancreas, lung, leukemia, all other).
Results
There are statistically significant (p<0.05) excess risks for all cancer, and lung cancer, and borderline statistically significant risks for stomach cancer (p=0.07), and leukemia (p=0.06), with excess relative risks Gy−1 of 0.024 (95% CI 0.011, 0.039), 0.559 (95% CI 0.221, 1.021), 0.042 (95% CI −0.002, 0.119), and 1.087 (95% CI −0.018, 4.925), respectively. There is statistically significant (p=0.007) excess risk of pancreatic cancer when adjusted for dose-response curvature. General downward curvature is apparent in the dose response, statistically significant (p<0.05) for all cancers, pancreatic cancer and all other cancers (than stomach, pancreas, lung, leukemia). There are indications of reduction in risk with increasing age at exposure (for all cancers, pancreatic cancer), but no evidence for quadratic variations in relative risk with age at exposure. If a linear-exponential dose response is used there is no significant heterogeneity in the dose response between the five endpoints considered, or in the speed of variation of relative risk with age at exposure. The risks are generally consistent with those observed in the Japanese atomic bomb survivors and in groups of nuclear workers.
Conclusions
There are excess risks for various malignancies in this dataset. Generally there is marked downward curvature in the dose response, and significant reduction in relative risk with increasing age at exposure. The consistency of risks with those observed in the Japanese atomic bomb survivors, and in groups of nuclear workers, implies that there may be little sparing effect of fractionation of dose or low dose rate exposure.
Keywords: stomach cancer, lung cancer, pancreatic cancer, leukemia
Introduction
Cancer is a well-documented effect of exposure to moderate and high doses of ionizing radiation1. For the purposes of assessing low dose cancer risk there is particular interest in assessing departures from linearity in the dose response in moderate and high dose exposed groups. Such curvature can be upward (i.e. risk per unit dose increasing with increasing dose) as for bone cancer, leukemia, and non-melanoma skin cancer1;2, although downward curvature (i.e., risk per unit dose decreasing with increasing dose), and which is thought largely to result from cell-sterilization effects3, has also been observed at higher dose levels for some endpoints4;5.
For most cancer sites there is generally reduction in relative risk with increasing age at exposure1. U-shaped variations of relative risk with age at exposure have been observed in the most recent analysis of the Japanese atomic bomb survivor Life Span Study (LSS) incidence and mortality data2;6, and increasing trends with increasing age at exposure in some other cohorts7;8. In general there are no very marked time trends in relative risk for solid cancer after exposure in adulthood1.
Pierce and Preston9 jointly analysed various categories of solid cancer mortality in the LSS and found no heterogeneity of radiogenic excess risk across cancer types in the adjustments for gender, time since exposure or age at exposure. However, analysis of the most recent LSS solid cancer incidence and mortality data found highly statistically significant (p<0.001) heterogeneity in speed of variation of relative risk with age at exposure by cancer subtype6.
Cancer outcomes in the cohort of persons treated for peptic ulcer has been previously analysed10. Carr et al. found strong evidence of radiation-related excess risk of stomach and lung cancer, but did not formally model the shape of the dose response10. Carr et al. also assessed the relative risk (exposed vs unexposed) in three age-at-treatment groups but did not model modifications in the dose response by age at exposure or by time since exposure10.
In this paper we re-analyse the shape of the dose response for various cancer endpoints in the US peptic ulcer dataset, and assess modifications of risk by age at exposure and time since exposure. Using the methods of Pierce and Preston9 we formally evaluate heterogeneity of the shape of the dose-response and modifications by time and age in this dataset. We specifically examine evidence for possible U-shaped variations in modification of relative risk by age at exposure. Patients chosen for irradiation may have been less fit for anesthetic/surgery than those treated in other ways; assessing this potential bias requires that we analyze the full cohort (exposed+unexposed) as well as the exposed group only. The data used are very similar to those used in previous analyses of this cohort10.
Data and Methods
Data
The cohort consisted of 3719 persons, comprising 1860 unexposed persons and 1859 exposed patients. 8 persons in the exposed group for whom the dosimetry was incomplete, and 111 who were treated with energies other than orthovoltage (megavoltage or60Co γ), and for whom detailed dosimetry measurements were not done, were removed from the cohort, leaving an analysis cohort of 3600 persons. For all cancers apart from leukemia follow-up started 5 years after radiation treatment in the exposed cohort, while for leukemia follow-up started 2 years after exposure to allow for the known shorter latency of this malignancy1. Follow-up ended with the earlier of the patient's death, loss to follow-up, or December 31st 1997, as previously10. There were a total of 86,779.2 person years of follow-up (Table 1). The distribution of persons and deaths from cancer for various demographic parameters are given in Table 2. We concentrate on those cancers for which there were suggestions of excess risk in the previous analysis10, namely: (a) all cancers; (b) stomach cancer; (c) pancreatic cancer; (d) lung cancer; (e) leukemia excluding chronic lymphocytic leukemia (CLL); and (f) all other cancers (Tables 3, 5). Other sites with 20 or more deaths with > 5 years follow-up comprised cancers of the (a) colon; (b) female breast; (c) prostate; and (d) malignant neoplasms without specification of primary site (ICD9 199). We include additional analyses of the first three of these (Table 4). We excluded three cases of CLL from the leukemia subtype (although they are included in all other cancers) since there is little evidence that this type of leukemia is radiogenic1.
Table 1.
Numbers of deaths, people and person years in US peptic ulcer cohort
| Endpoint | Known radiation dose and >2 year of follow-up (% of cancer deaths) | Known radiation dose and >5 year of follow-up (% of cancer deaths) |
|---|---|---|
| Stomach (ICD9 151) | 67 (9.4) | 60 (8.7) |
| Colon (ICD9 153) | 63 (8.8) | 62 (9.0) |
| Pancreas (ICD9 157) | 58 (8.1) | 56 (8.2) |
| Lung (ICD9 162) | 198 (27.7) | 193 (28.1) |
| Female breast (ICD9 174) | 27 (3.8) | 26 (3.8) |
| Prostate (ICD9 185) | 71 (9.9) | 69 (10.0) |
| Leukemia excluding CLL (ICD9 204–207 – 204.1) | 14 (2.0) | 12 (1.7) |
| All other cancers (than stomach, pancreas, lung, leukemia) | 377 (52.8) | 366 (58.3) |
| All other cancers (than stomach, colon, pancreas, lung, female breast, prostate, leukemia) | 216 (30.3) | 209 (30.4) |
| All cancer (ICD9 140–209) | 714 (100.0) | 687 (100.0) |
|
| ||
| Numbers of people | 3600 | 3600 |
| Person years | 86,779.2 | 76,567.1 |
Table 2.
Numbers of cancer deaths (>5 years after start of follow-up) by radiotherapy status and distribution of other risk factors in US peptic ulcer cohort
| Radiotherapy | No radiotherapy | |||
|---|---|---|---|---|
|
|
|
|||
| Category | Cancer deaths | Persons at risk | Cancer deaths | Persons at risk |
| Age at treatment | ||||
|
| ||||
| <35 | 68 | 252 | 87 | 437 |
| 35–44 | 109 | 462 | 110 | 549 |
| 45–54 | 100 | 515 | 71 | 497 |
| ≥55 | 83 | 511 | 59 | 377 |
|
| ||||
| Year of treatment/entry | ||||
|
| ||||
| <1940 | 48 | 207 | 78 | 534 |
| 1940–44 | 89 | 373 | 81 | 459 |
| 1945–49 | 62 | 277 | 96 | 504 |
| 1950–59 | 139 | 738 | 72 | 363 |
| ≥1960 | 22 | 145 | - | - |
|
| ||||
| Gender | ||||
|
| ||||
| Male | 297 | 1389 | 266 | 1423 |
| Female | 63 | 351 | 61 | 437 |
|
| ||||
| Marital status | ||||
|
| ||||
| Not stated/unknown | 4 | 47 | 2 | 9 |
| Never married | 33 | 163 | 32 | 234 |
| Married | 291 | 1356 | 275 | 1471 |
| Divorced separated | 17 | 63 | 9 | 60 |
| Widowed | 15 | 111 | 9 | 86 |
|
| ||||
| Cigarette smoking status | ||||
|
| ||||
| Unknown | 54 | 301 | 68 | 369 |
| Never smoked | 78 | 418 | 64 | 499 |
| Smoked | 228 | 1021 | 195 | 992 |
|
| ||||
| Cigarette smoking quantity | ||||
|
| ||||
| Unknown | 137 | 749 | 137 | 903 |
| ≤1 pack/day | 148 | 694 | 134 | 726 |
| > 1 pack/day | 75 | 297 | 56 | 231 |
|
| ||||
| Alcohol drinking status | ||||
|
| ||||
| Unknown | 66 | 342 | 74 | 424 |
| Never drank | 120 | 574 | 104 | 642 |
| Drank | 174 | 824 | 149 | 794 |
|
| ||||
| Alcohol drinking quantity | ||||
|
| ||||
| Unknown | 215 | 1025 | 201 | 1214 |
| ≤5 drinks/week | 77 | 404 | 69 | 379 |
| 6–15 drinks/week | 28 | 143 | 28 | 123 |
| >15 drinks/week | 40 | 168 | 29 | 144 |
Table 3.
Modifiers of dose response for various categories of cancer. Parameter estimates (all Gy−1) with 95% profile likelihood CI, unless otherwise indicated. Background model is cubic model in age, with adjustment for gender and smoking habit and quantity. Stomach dose is used for all cancer and stomach cancer, pancreatic dose is used for pancreatic cancer, (average of left and right lobe) lung dose is used for lung cancer, active bone marrow dose is used for leukemia, and stomach dose is used for all other cancers. Follow-up starts > 2 years after treatment for leukemia, and > 5 years after treatment for all other cancers. Unless otherwise stated, all p-values relate to the improvement in fit over the model immediately above.
| Model no. | Model/parameters | All cancer | Stomach | Pancreas | Lung | Leukemia excluding CLL | All other cancers | |
|---|---|---|---|---|---|---|---|---|
| 1 | Background[1+ α D] | α (Gy−1) | 0.024 (0.011, 0.039) | 0.042 (−0.002, 0.119) | 0.055 (−0.002, 0.157) | 0.559 (0.221, 1.021) | 1.087 (−0.018, 4.925) | 0.006 (−0.008, 0.024) |
| p-valuesa | <0.001 | 0.066 | 0.059 | <0.001 | 0.057 | 0.428 | ||
|
| ||||||||
| 2 | Background[1+αD+βD2] | α (Gy−1) | 0.045 (0.017, 0.075) | 0.064 (−0.048, 0.200) | 0.114c (−0.006b, 0.235b) | 0.353 (−0.466, 1.249) | −0.958 (−4.657b, 2.740b) | 0.031c (0.004b, 0.057b) |
| β (Gy−2) | −0.001 (−0.002, 0.000) | −0.001 (−0.007b, 0.006) | −0.004c (−0.007b, 0.002) | 0.142 (−0.336, 0.753) | 1.219 (−1.218b, 3.655b) | −0.001c (−0.002b, −0.000) | ||
| p-values | 0.099 | 0.680 | 0.113 | 0.590 | 0.547 | 0.020 | ||
|
| ||||||||
| 3 | Background[1+αDexp[γD]] | α (Gy−1) | 0.129 (0.027, 0.443) | 0.223 (−0.508b, 4.906) | 2.286 (0.143, 14.49) | 0.343(0.029, 1.723) | 0.831 (−2.136b, 13.49) | 0.243 (−3.900, 1.365) |
| γ (Gy−1) | −0.104 (−0.211, −0.011) | −0.110 (−0.539, 0.251) | −0.273 (−0.548, −0.062) | 0.324 (−0.893, 1.366) | 0.161 (−1.451b, 1.773b) | −0.193 (−0.418, −0.032) | ||
| p-valuesd | 0.026 | 0.491 | 0.012 | 0.527 | 0.827 | 0.024 | ||
| p-valuese | <0.001 | 0.146 | 0.007 | 0.001 | 0.160 | 0.058 | ||
|
| ||||||||
| 4 | Background[1+ α D exp[κ 1sex=female]] | α (Gy−1) | 0.021 (0.007, 0.037) | 0.033 (−0.023b, 0.115) | 0.036 (0.015, 0.134) | 0.547 (0.201, 1.026) | 2.047 (0.188, 11.37) | 0.001 (−0.014b, 0.020) |
| κ | 0.747 (−1.037, 2.000) | 0.960 (−107.6, 3.776b) | 1.688 (−10.89, 4.166b) | 0.276 (−55.86, 2.108) | −39.06 (NA, NA) | 3.169 (<−104, 14.54b) | ||
| p-valuesd | 0.280 | 0.528 | 0.245 | 0.828 | 0.132 | 0.188 | ||
|
| ||||||||
| 5 | Background[1+ α D exp[τ (age at exposure − 41.32)]] | α (Gy−1) | 0.030 (0.014, 0.048) | 0.046 (0.004, 0.135) | 0.043 (0.001, 0.170) | 0.598 (0.224, 1.110) | 1.067 (−0.987b, 5.091) | 0.009 (−0.011b, 0.030) |
| τ (y−1) | −0.052 (−0.105, −0.012) | −0.090 (−0.223, 0.014) | −0.136 (−0.356, −0.035) | −0.010 (−0.056, 0.036) | 0.003 (−0.092b, 0.098b) | −0.106 (−0.260b, 0.048b) | ||
| p-valuesd | 0.012 | 0.080 | 0.006 | 0.639 | 0.944 | 0.103 | ||
|
| ||||||||
| 6 | Background[1+ α D exp[γD+τ (age at exposure − 41.32)]] | α (Gy−1) | 0.080 (0.015, 0.315) | 0.079 (−0.180b, 2.500) | 0.510 (−0.777b, 9.335) | 0.342 (0.024, 1.678) | 0.838 (−2.155b, 13.64) | 0.229 (−0.346b, 1.504) |
| γ (Gy−1) | −0.061 (−0.172, 0.028) | −0.038 (−0.353, 0.159) | .0.144 (−0.446, 0.136) | 0.387 (−0.822, 1.580) | 0.155 (−1.512b, 1.822b) | −0.186 (−0.456, 0.062) | ||
| τ (y−1) | −0.036 (−0.090, 0.004) | −0.087 (−0.220, 0.021) | −0.072 (−0.314, 0.025) | −0.014 (−0.069, 0.034) | 0.001 (−0.097b, 0.098b) | −0.003 (−0.237, 0.097) | ||
| p-valuesf | 0.081 | 0.100 | 0.155 | 0.545 | 1.000 | 0.929 | ||
|
| ||||||||
| 7 | Background[1+ α D exp[δ (time since exposure − 20.78)]] | α (Gy−1) | 0.023 (0.010, 0.038) | 0.043 (0.002, 0.120) | 0.032 (0.002, 0.122) | 0.558 (0.216, 1.023) | 0.984 (−0.946b, 4.826) | 0.006 (−0.009, 0.024) |
| δ (y−1) | 0.024 (−0.009, 0.057) | 0.037 (−0.047, 0.132) | 0.094 (0.026, 0.192) | 0.001 (−0.052, 0.045) | −0.034 (−0.147b, 0.177) | 0.027 (−0.113b, 0.168b) | ||
| p-values | 0.142 | 0.269 | 0.008 | 0.964 | 0.597 | 0.583 | ||
|
| ||||||||
| 8 | Background[1+ α D exp[τ (age at exposure − 41.32) + δ (time since exposure − 20.78)]] | α (Gy−1) | 0.033 (0.015, 0.055) | 0.047 (0.001, 0.153) | 0.034 (−0.035b, 0.159) | 0.682 (0.215, 1.394) | 0.030c (−0.243b, 0.303b) | 0.009 (−0.013b, 0.036) |
| τ (y−1) | −0.072 (−0.146, −0.009) | −0.147 (−0.447, 0.157) | −0.091 (−0.330, 0.086) | −0.024 (−0.092, 0.049) | −0.296c (−0.804b, 0.213b) | −0.160 (−0.675, 0.004) | ||
| δ (y−1) | −0.019 (−0.065, 0.027) | −0.049 (−0.278, 0.115) | 0.044 (−0.087, 0.180) | −0.017 (−0.091, 0.054) | −0.519c (−1.223b, −0.037) | −0.046 (−0.245, 0.048) | ||
| p-valuesg | 0.389 | 0.397 | 0.470 | 0.604 | 0.036 | 0.235 | ||
| p-values | 0.027 | 0.109 | 0.289 | 0.485 | 0.042 | 0.052 | ||
|
| ||||||||
| 9 | Background[1+ αD exp[τ (age at exposure − 41.32) + ψ (age at exposure − 41.32)2]] | α (Gy−1) | 0.029 (0.013, 0.049) | 0.013 (−0.043b, 0.119) | 0.049 (−0.026b, 0.166) | 0.725 (0.269, 1.390) | 1.300 (−1.203b, 7.656) | 0.007 (−0.001, 0.037) |
| τ (y−1) | −0.050 (−0.087b, −0.012) | −0.537 (−1.486b, −0.044) | −0.100 (−1.027, −0.033) | 0.002 (−0.069b, 0.083) | 0.027 (−0.148b, 0.201b) | −0.609 (−1.942b, −0.027) | ||
| ψ (y−2) | 0.000 (−0.002b, 0.003) | −0.026 (−0.078b, 0.027b) | 0.002 (−0.004b, 0.006) | −0.002 (−0.007b, 0.001) | −0.002 (−0.012b, 0.005) | −0.046 (−0.149b, 0.058b) | ||
| p-valuesg | 0.772 | 0.065 | 0.611 | 0.294 | 0.597 | 0.136 | ||
p-value for improvement of fit over null model without linear term in dose.
Wald-based confidence limit.
indications of lack of convergence.
p-value for improvement of fit over model with (unadjusted) linear term in dose.
p-value for improvement of fit (2 df) over null model without linear term in dose.
p-value for improvement of fit over model with linear-exponential term in dose.
p-value for improvement of fit over model with adjustment for age at exposure.
Table 5.
Test of heterogeneity in dose response and its modification by age at exposure in various categories of cancer. The background model for each cancer subtype is cubic model in age, with adjustment for gender and smoking habit and quantity. Stomach dose is used for all cancer and stomach cancer, pancreatic dose is used for pancreatic cancer, (average of left and right lobe) lung dose is used for lung cancer, active bone marrow dose is used for leukemia, and stomach dose is used for all other cancers. All p-values relate to the improvement in fit over the model immediately above.
| Panel | Model | p-value |
|---|---|---|
| A | Test of heterogeneity across five cancer endpoints (stomach, pancreas, lung, leukemia, all other cancers), linear dose response | |
|
| ||
| Background[1+ a D exp[τ (age at exposure − 41.32)]]a | 0.001b | |
| Background[1+ ai D exp[τ (age at exposure − 41.32)]]a | 0.004c | |
| Background[1+ ai D exp[τi (age at exposure − 41.32)]]a | 0.083d | |
|
| ||
| B | Test of heterogeneity across four cancer endpoints (stomach, pancreas, lung, leukemia), linear dose response | |
|
| ||
| Background[1+ a D exp[τ (age at exposure − 41.32)]]a | <0.001b | |
| Background[1+ ai D exp[τ (age at exposure − 41.32)]]a | 0.037c | |
| Background[1+ ai D exp[τi (age at exposure − 41.32)]]a | 0.071d | |
|
| ||
| C | Test of heterogeneity across five cancer endpoints (stomach, pancreas, lung, leukemia, all other cancers), linear-exponential dose response | |
|
| ||
| Background[1+ a D exp[γ D + τ (age at exposure − 41.32)]]a | <0.001b | |
| Background[1+ ai D exp[γ D + τ (age at exposure − 41.32)]]a | 0.123c | |
| Background[1+ ai D exp[γi D + τ (age at exposure − 41.32)]]a | 0.682e | |
| Background[1+ ai D exp[γi D + τi (age at exposure − 41.32)]]a | 0.590d | |
|
| ||
| D | Test of heterogeneity across four cancer endpoints (stomach, pancreas, lung, leukemia), linear-exponential dose response | |
|
| ||
| Background[1+ a D exp[γ D + τ (age at exposure − 41.32)]]a | <0.001b | |
| Background[1+ ai D exp[γ D + τ (age at exposure − 41.32)]]a | 0.774c | |
| Background[1+ ai D exp[γi D + τ (age at exposure − 41.32)]]a | 0.503e | |
| Background[1+ ai D exp[γi D + τi (age at exposure − 41.32)]]a | 0.463d | |
age at exposure is approximately centered by subtracting off its person-year weighted mean (41.32 years) in the full cohort (exposed+unexposed), to stabilize parameter estimates.
p-value for improvement of fit over model without radiation dose response term.
p-value for improvement of fit over model with the same excess relative risk coefficient (α) for each endpoint.
p-value for improvement of fit over model with the same age at exposure trend in excess relative risk (τ) for each endpoint.
p-value for improvement of fit over model with the same exponential dose coefficient (γ) for each endpoint.
Table 4.
Modifiers of dose response for various auxiliary cancer categories (colon cancer, female breast cancer, prostate cancer). Parameter estimates (all Gy−1) with 95% profile likelihood CI, unless otherwise indicated. Background model is cubic model in age, with adjustment for gender (for colon) and smoking habit and quantity. Average of minimum and maximum colon dose is used for colon cancer, average of left and right breast dose is used for breast cancer, and prostate dose is used for prostate cancer. Follow-up starts > 5 years after treatment. Unless otherwise stated, all p-values relate to the improvement in fit over the model immediately above.
| Model no. | Model/parameters | Colon | Female breast | Prostate | |
|---|---|---|---|---|---|
| 1 | Background[1+ α D] | α (Gy−1) | 0.025 (−0.044, 0.140) | 8.024 (−1.414, 30.38) | −3.697 (−7.167b, 1.670) |
| p-valuesa | 0.549 | 0.124 | 0.145 | ||
|
| |||||
| 2 | Background [1+αD+βD2] | α (Gy−1) | 0.082 (−0.172, 0.231b) | 11.70 (−29.58, 43.49b) | −2.286 (NA, NA) |
| β (Gy−2) | −0.007 (−0.015b, 0.028) | −29.34 (−236.3b, 370.5) | −8.964 (−8.965b, −8.964b) | ||
| p-values | 0.530 | 0.830 | 0.617 | ||
|
| |||||
| 3 | Background[1+αDexp[γD]] | α (Gy−1) | 0.049 (−1.702, 50.54) | 10.64 (−3571, >104) | −2.601 (<−104, >104) |
| γ (Gy−1) | −0.082 (−1.234b, 1.069b) | −2.276 (<−104, 30.17b) | 2.234 (−69.78, 12.02b) | ||
| p-valuesc | 0.791 | 0.872 | 0.648 | ||
| p-valuesd | 0.807 | 0.302 | 0.312 | ||
|
| |||||
| 4 | Background[1+ α D exp[κ 1sex=female]] | α (Gy−1) | 0.019 (−0.049, 0.144) | - | - |
| κ | 1.131 (−127.7, 7.754b) | - | - | ||
| p-valuesc | 0.763 | - | - | ||
|
| |||||
| 5 | Background[1+ α D exp[τ (age at exposure − 41.32)]] | α (Gy−1) | 0.049 (−0.072b, 0.187) | 7.107 (−1.802, 31.86) | −2.662e (−6.451b, 1.127b) |
| τ (y−1) | −0.082 (−0.265b, 0.100b) | 0.015 (−0.108b, 0.137b) | 0.023e (−0.027b, 0.073b) | ||
| p-valuesc | 0.221 | 0.818 | 0.284 | ||
|
| |||||
| 6 | Background[1+ α D exp[γD+τ (age at exposure − 41.32)]] | α (Gy−1) | 0.034 (−0.162b, 0.231b) | 10.71 (−38.69b, >104) | −2.368e (−8.214b, 3.478b) |
| γ (Gy−1) | 0.047 (−4.943, 0.671b) | −3.623 (<−104, 32.16b) | 0.555e (−7.535b, 8.645b) | ||
| τ (Gy−1) | −0.089 (−0.289b, 0.112b) | 0.019 (−0.104b, 0.141b) | 0.023e (−0.024b, 0.071b) | ||
| p- valuesf | 0.226 | 0.775 | 0.331 | ||
|
| |||||
| 7 | Background[1+ α D exp[δ (time since exposure − 20.78)] | α (Gy−1) | 0.027 (−0.068b, 0.136) | 8.106 (−6.683b, 30.83) | −3.209e (−7.035b, 0.616b) |
| δ (y−1) | 0.047 (−0.121b, 0.215b) | −0.035 (−0.173b, 0.104b) | −0.019e (−0.120b, 0.081b) | ||
| p-valuesc | 0.451 | 0.542 | 0.527 | ||
|
| |||||
| 8 | Background[1+ α D exp[τ(age at exposure − 41.32) + δ (time since exposure − 20.78)]] | α (Gy−1) | 0.057 (−0.090b, 0.242) | 9.692 (−10.46b, 49.80) | −2.649 (−6.769b, 1.471b) |
| τ (y−1) | −0.109 (−0.329b, 0.111b) | −0.020 (−0.183b, 0.142b) | 0.023 (−0.040b, 0.086b) | ||
| δ (y−1) | −0.030 (−0.189, 0.130) | −0.045 (−0.222b, 0.132b) | −0.000 (−0.079b, 0.078b) | ||
| p-valuesg | 0.685 | 0.539 | 0.899 | ||
| p-values | 0.295 | 0.806 | 0.383 | ||
|
| |||||
| 9 | Background[1+ α D exp[τ (age at exposure − 41.32) + ψ (age at exposure − 41.32)2]] | α (Gy−1) | 0.178 (−0.275b, 0.743) | 6.936 (−8.666b, 32.52) | −1.542e (−7.632b, 4.549b) |
| τ (y−1) | .1.409 (−4.792b, −0.589) | 0.023 (−0.203b, 0.249b) | 0.062e (−0.252b, 0.377b) | ||
| ψ (y−2) | −0.486 (−2.055, 0.607b) | −0.000 (−0.009b, 0.009b) | −0.001e (−0.007b, 0.006b) | ||
| p-valuesg | 0.028 | 0.944 | 0.652 | ||
p-value for improvement of fit over null model without linear term in dose.
Wald-based confidence limit.
p-value for improvement of fit over model with (unadjusted) linear term in dose.
p-value for improvement of fit (2 df) over null model without linear term in dose.
indications of lack of convergence.
p-value for improvement of fit over model with linear-exponential term in dose.
p-value for improvement of fit over model with adjustment for age at exposure.
Dosimetry
The dosimetry for this cohort has been described in detail elsewhere11. Briefly, the patients were treated with orthovoltage X-ray machines (250 kVp, 1.3–1.5 mm Cu half-value layers). One course of radiation consisted of anterior and posterior parallel-opposed fields (typically 13 cm x 13 cm), centred on the stomach under fluoroscopic control starting in 1949. Most courses were delivered in daily fractions of 1.5 Gy at a dose rate of 0.3 Gy/min. Patients were treated with one or two courses, each course lasting 6–14 days, and delivering an approximate stomach dose of 16–17 Gy.
Organ doses were estimated using radiation measurements in an adult male Alderson phantom. The machine used to irradiate the phantom was one of the machines (Maxitron 250; General Electric, Milwaukee, WI) used to treat the patients in the study. Thermoluminescent dosimeters were placed in the phantom throughout the organs of interest.For total active bone marrow, the dose to each partition of ABM was weighted according to Cristy12.
Statistical methods
A stratified person-year/event table was generated using the categories given in Appendix A (Table A1). A Poisson relative risk model was fitted by Poisson maximum likelihood13. The radiation dose used is generally the appropriate organ dose, and using stomach dose for all other cancers (than stomach, pancreas, lung, leukemia). Tests were based on the likelihood ratio test13. Confidence intervals are (unless otherwise indicated) based on the profile likelihood13. Tests of homogeneity of excess relative risk Gy−1 (α) and other parameters modifying the relative risk across cancer subtypes are based on the methods of Pierce and Preston9. All p-values are two-sided.
Results
Table B1 shows that for cancers the optimal model was a cubic polynomial of age, with additional adjustment for gender, and smoking habit/quantity. [Note: as can be seen from Table B1, only for “all cancer” are the remaining terms in the background model statistically significant.]
Table 3 (model 1) demonstrates that there are statistically significant (p >0.001) increasing dose responses for all cancer and lung cancer, and borderline statistically significant trends for stomach cancer (p=0.066), pancreatic cancer (p=0.059), and leukemia (excluding CLL) (p=0.057). Table 3 (model 3) also shows that there is significant (p<0.05) downward curvature in the dose response for all cancers, pancreatic cancer and all other cancers (see also Figure 1). For pancreatic cancer there is evidence of a significant dose response when using a linear-exponential model (p=0.007)(Table 3 model 3).
Figure 1. Relative risk vs dose (with 95% CI) for various malignant endpoints, with fit of optimal linear and linear-exponential models. All use relevant average organ dose (stomach for all cancer, all other cancers).
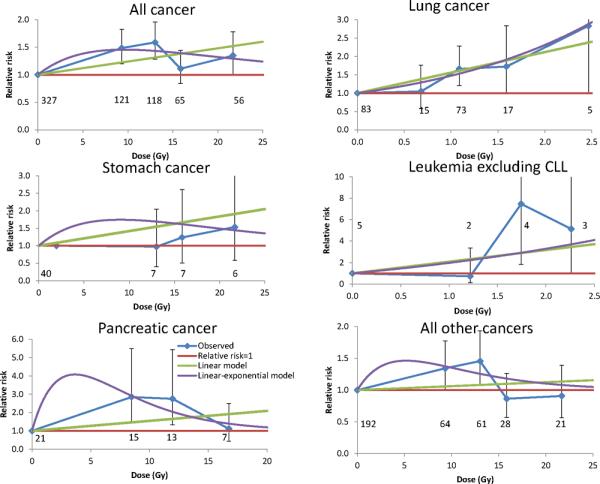
Background model is as for Tables 3, 5. Numbers of deaths in each dose group are shown.
Table 3 (model 5) indicates that for all cancers and pancreatic cancer there is a statistically significant (p<0.02) decreasing trend of excess relative risk with age at exposure; for stomach cancer this trend is borderline statistically significant (p=0.080). There are significant increasing trends in risk by time after exposure for pancreatic cancer (p=0.008) (Table 3, model 7). For all other endpoints there no indications of time trends after adjustment for age at exposure (Table 3, model 8), although there indications of age at exposure trends after adjustment for time for all cancers (p=0.027), and all other cancers (p=0.052). There are no statistically significant modifications to excess relative risk by gender (p>0.1) (Table 3, model 4). For colon, female breast, and prostate cancer there are only weak indications of radiation associations (Table 4); a complication with many of the models fitted for prostate cancer was numerical instability of the model fits.
Table 3 (model 9) demonstrates that there is generally no evidence for quadratic (U-shaped) adjustment of relative risk by age at exposure (p>0.05), although if adjustment is made for time since exposure there is significant quadratic curvature for stomach cancer (p=0.035)(results not shown).
If a linear dose-response model is used, there are significant differences (p=0.004) (Table 5 panel A) in the magnitude of excess relative risk (ERR) per unit dose between the five cancer subtypes that we consider. However, if a linear-exponential dose response is used there is no evidence for such heterogeneity (p>0.1) (Table 5, panels C, D), nor in the degree of downward curvature in the dose response (p>0.5) (Table 5 panels C, D). There are also no statistically significant variations between these endpoints in the degree of variation of relative risk with age at exposure (p>0.05) (Table 5 panels A–D). All this is generally true if we exclude the remainder cancer category (cancers excluding stomach, pancreas, lung, leukemia) (Table 5 panels B, D).
Inference is problematic in the subcohort of people receiving only radiation treatment for peptic ulcer, because most model fits failed to converge. The only specific cancer site which did not have this problem was lung cancer, risks for which were somewhat higher (ERR / Gy 1.724, 95% CI 0.053, 417.1) than, but consistent with, those in the full cohort (ERR / Gy 0.559, 95% CI 0.221, 1.021) (Table 3, Appendix Table B2).
Discussion
We found statistically significant excess risks related to radiation treatment for peptic ulcer for a variety of malignant endpoints in the present data, specifically lung cancer, and stomach cancer, and borderline significant excess risk for pancreatic cancer and leukemia excluding CLL. There were no marked radiation associations for three other sites (colon, female breast, prostate).
The findings of general downward curvature in the dose response for most endpoints, even if only statistically significant for all cancers, pancreatic cancer and the remainder category, is novel. This is not generally seen in many other datasets, in particular with the Japanese atomic bomb survivor Life Span Study (LSS) cohort2 and with many medically-irradiated groups1;14. Only for leukemia in the LSS and in some other datasets1;15 is there generally marked curvature in the dose response. The small number of leukemia deaths (14) in this cohort may limit power to detect curvature for this endpoint. The curvature is not suggestive of the effect of cell sterilization – the exponential coefficient, γ, takes the value (for all cancers) of about −0.1 Gy−1, rather larger than the range of experimental in vitro measured inactivation parameters, −1.72 – −0.30 Gy−1 16. This implies that, if cell inactivation is involved in the dose-response downturn at high dose, there must be a degree of offsetting cellular repopulation. Cellular repopulation would be expected in a regime of daily fractionated doses, as here. Repopulation of the stem-cell and transformed stem-cell compartments in each irradiated organ can offset the cell-sterilizing effects of radiation17. For the red bone marrow, an additional feature to be considered is that hemopoietic stem cells transfer to other bone marrow compartments via the blood, complicating the stem-cell recovery kinetics when there is partial body exposure, as here 18;19.
The findings are not inconsistent with those of Carr et al.10, who analysed a slightly larger cohort, including 111 persons for whom detailed dosimetry measurements were not performed. For example, Carr et al.10 ascertained an ERR for stomach and pancreatic cancer of 0.06 Gy−1 and 0.04 Gy−1, similar to our estimates of 0.042 Gy−1 and 0.055 Gy−1 (Table 3). Carr et al.10 ascertained an ERR for lung cancer of 0.24 Gy−1, somewhat lower than the present estimate of 0.559 Gy−1 (Table 3). However, their lung cancer risk was in terms of dose to the more highly irradiated left lung, whereas our risk was estimated using an average of left and right lung dose. We estimated risk using only left lung dose to be 0.365 Gy−1 (95% CI 0.144, 0.667) (results not shown), reasonably similar to the previous estimate. Carr et al.10 assessed dose-response curvature using an isotonic regression method that is manifestly inconsistent with the downward curvature in dose response that we observe (Figure 1, Table 3). The other analyses performed here, of modification of risk by age at exposure and time, and of homogeneity of risk across cancer endpoints, was not carried out in the previous report.10
The reductions in relative risk with increasing age at exposure agrees with findings in many other datasets, in particular the Japanese atomic bomb survivors 2and other groups1. We find no evidence for quadratic variations of relative risk with age at exposure, of the sort that have been observed in some other cohorts7;8 and (at borderline levels of statistical significance) in the most recent analysis of the LSS incidence data2;6. The relatively narrow range of age at exposure may limit power to detect modifications of risk with this variable. There are indications of increasing excess relative risk with time for pancreatic cancer; apart from pancreatic cancer (which few previous studies have found to be radiogenic1), these findings are generally consistent with what is observed for groups (as here) exposed in adulthood1.
We observed a striking homogeneity by endpoint in the excess relative risk per unit dose, and in the variation in speed of variation of risk with age at exposure. This agrees with analyses of solid cancer mortality data (for respiratory, digestive, solid tumors other than respiratory + digestive + female breast) in the LSS9, in which there was no evidence of heterogeneity by cancer types in the adjustments for time since exposure or age at exposure to the radiogenic ERR. However, analysis of the most recent Japanese atomic bomb survivor solid cancer incidence and mortality data found highly statistically significant heterogeneity in speed of variation of relative risk with age at exposure by solid cancer subtype6. The contrast with the analyses of cancer mortality developed here (and the previous mortality analyses of the LSS9) may possibly be explained by endpoint (incidence vs mortality) but may also be a function of the reduced statistical power in the present data (and the older LSS mortality data9) compared with the LSS incidence data.
A complication in this cohort is that patients were treated with surgery or radiotherapy, and it is possible that medically less fit persons may have been selected for radiation treatment. Unfortunately, there is little information on cancer risk in the radiation-only group, which is complicated by the lack of convergence in most models fitted to this sub-cohort (Appendix Table B2). Among the specific sites there is information only for lung cancer; relative risks are somewhat higher than, but consistent with, risks in the full cohort, suggesting that the subcohort is not too dissimilar from the full cohort.
The relevance of this study to radiation therapy regimes is intriguing. Person-year-weighted stomach doses average 5.7 Gy overall, comparable with radiotherapy doses in many groups treated for cancer, although doses to other organs are generally lower (e.g., person-year-weighted bone marrow dose averages 0.6 Gy overall). The magnitude of excess cancer risks are generally close to those of the LSS, in which average organ doses are generally much lower (mean 0.1 Gy). Using the linear low-dose excess relative risk coefficient in fits of the linear-exponential model (Table 3 model 3) for cancers of the stomach, lung and leukemia are 0.223 (95% CI −0.508, 4.906) Gy−1, 0.343 (95% CI 0.029, 1.723) Gy−1, and 0.831 (95% CI −2.136, 13.49) Gy−1, respectively, consistent with the values, 0.397 Sv−1, 0.318 Sv−1, and 1.019 Sv−1, respectively, predicted by UNSCEAR risk models fitted to LSS incidence and mortality data evaluated at age 60 (the approximate mean age in this dataset).1 Relative risks for stomach cancer and leukemia are also similar to those observed in a study of women irradiated for treatment of cervical cancer, 0.69 (95% CI 0.01, 2.25) Gy−1, 0.149 (95% CI 0.00, 0.45) Gy−1 20, respectively, as also with those observed in the UK nuclear worker mortality study, 0.34 (95% CI −0.63, 1.88) Sv−1, 1.71 (95% CI −0.17, 4.92) Sv−1 21. Mean stomach and bone marrow doses are 2 Gy and 7 Gy, respectively, in the cervical cancer study20, and about 0.02 Sv in the worker study21. There is little evidence for excess risk of pancreatic cancer in other exposed groups, in particular in the latest LSS cancer incidence2 or mortality22 datasets. The consistency of the risks in the peptic ulcer data, in which dose was delivered acutely in about 10 daily fractions (see Methods) with those in the LSS, in which dose was also delivered acutely but in a single fraction, and with the risks in occupational series, in which dose was delivered at low dose rate in small daily fractions, implies that there may be little sparing effect of low dose rate or dose fractionation.
Supplementary Material
SUMMARY.
High doses of radiation have long been linked to cancer. Here, a cohort treated with radiation for peptic ulcer is reanalysed to assess how risk varies with dose, and how radiogenic risk varies with age.
There are significant excess risks for stomach, pancreas, and lung cancer, and downward curvature in dose response for most endpoints, but little evidence of age-at-exposure modifications. Risks are consistent with those observed in the A-bomb survivors and in nuclear workers.
Acknowledgements
The authors are grateful for the detailed and helpful comments of Dr Lindsay Morton, Dr Kiyohiko Mabuchi, Dr Ethel Gilbert, and two referees. This work was supported by the Intramural Research Program of the National Institutes of Health, the National Cancer Institute, Division of Cancer Epidemiology and Genetics.
Footnotes
Publisher's Disclaimer: This is a PDF file of an unedited manuscript that has been accepted for publication. As a service to our customers we are providing this early version of the manuscript. The manuscript will undergo copyediting, typesetting, and review of the resulting proof before it is published in its final citable form. Please note that during the production process errors may be discovered which could affect the content, and all legal disclaimers that apply to the journal pertain.
Conflicts of interest notification No authors have any conflicts of interest.
Reference List
- (1).United Nations Scientific Committee on the Effects of Atomic Radiation (UNSCEAR) UNSCEAR 2006 Report. Annex A. Epidemiological Studies of Radiation and Cancer. United Nations; New York: 2008. pp. 13–322. [Google Scholar]
- (2).Preston DL, Ron E, Tokuoka S, et al. Solid cancer incidence in atomic bomb survivors: 1958–1998. Radiat Res. 2007;168:1–64. doi: 10.1667/RR0763.1. [DOI] [PubMed] [Google Scholar]
- (3).United Nations Scientific Committee on the Effects of Atomic Radiation (UNSCEAR) Sources and effects of ionizing radiation. UNSCEAR 1993 report to the General Assembly, with scientific annexes. E.94.IX.2. United Nations; New York: 1993. pp. 1–922. [Google Scholar]
- (4).Little MP, Weiss HA, Boice JD, Darby SC, Day NE, Muirhead CR. Risks of leukemia in Japanese atomic bomb survivors, in women treated for cervical cancer, and in patients treated for ankylosing spondylitis. Radiation Research. 1999;152:280–292. [PubMed] [Google Scholar]
- (5).Sigurdson AJ, Ronckers CM, Mertens AC, et al. Primary thyroid cancer after a first tumour in childhood (the Childhood Cancer Survivor Study): a nested case-control study. Lancet. 2005;365:2014–2023. doi: 10.1016/S0140-6736(05)66695-0. [DOI] [PubMed] [Google Scholar]
- (6).Little MP. Heterogeneity of variation of relative risk by age at exposure in the Japanese atomic bomb survivors. Radiat Environ Biophys. 2009;48:253–262. doi: 10.1007/s00411-009-0228-x. [DOI] [PubMed] [Google Scholar]
- (7).Bauer S, Gusev BI, Pivina LM, Apsalikov KN, Grosche B. Radiation exposure due to local fallout from Soviet atmospheric nuclear weapons testing in Kazakhstan: solid cancer mortality in the Semipalatinsk historical cohort, 1960–1999. Radiat Res. 2005;164:409–419. doi: 10.1667/rr3423.1. [DOI] [PubMed] [Google Scholar]
- (8).Krestinina LY, Preston DL, Ostroumova EV, et al. Protracted radiation exposure and cancer mortality in the Techa River Cohort. Radiat Res. 2005;164:602–611. doi: 10.1667/rr3452.1. [DOI] [PubMed] [Google Scholar]
- (9).Pierce DA, Preston DL. Joint analysis of site-specific cancer risks for the atomic bomb survivors. Radiat Res. 1993;134:134–142. [PubMed] [Google Scholar]
- (10).Carr ZA, Kleinerman RA, Stovall M, Weinstock RM, Griem ML, Land CE. Malignant neoplasms after radiation therapy for peptic ulcer. Radiat Res. 2002;157:668–677. doi: 10.1667/0033-7587(2002)157[0668:mnartf]2.0.co;2. [DOI] [PubMed] [Google Scholar]
- (11).Little MP, Kleinerman RA, Stovall M, Smith SA, Mabuchi K. Analysis of Dose Response for Circulatory Disease After Radiotherapy for Benign Disease. Int J Radiat Oncol Biol Phys. 2012 doi: 10.1016/j.ijrobp.2012.01.053. [DOI] [PMC free article] [PubMed] [Google Scholar]
- (12).Cristy M. Active Bone-Marrow Distribution As A Function of Age in Humans. Physics in Medicine and Biology. 1981;26:389–400. doi: 10.1088/0031-9155/26/3/003. [DOI] [PubMed] [Google Scholar]
- (13).McCullagh P, Nelder JA. Monographs on statistics and applied probability 37. 2nd edition Chapman and Hall/CRC; Boca Raton, FL: 1989. Generalized linear models; pp. 1–526. [Google Scholar]
- (14).Little MP. Comparison of the risks of cancer incidence and mortality following radiation therapy for benign and malignant disease with the cancer risks observed in the Japanese A-bomb survivors. Int J Radiat Biol. 2001;77:431–464. doi: 10.1080/09553000010022634. [DOI] [PubMed] [Google Scholar]
- (15).Preston DL, Kusumi S, Tomonaga M, et al. Cancer incidence in atomic bomb survivors. Part III. Leukemia, lymphoma and multiple myeloma, 1950–1987. Radiat Res. 1994;137:S68–S97. [PubMed] [Google Scholar]
- (16).Deschavanne PJ, Fertil B. A review of human cell radiosensitivity in vitro. Int J Radiat Oncol Biol Phys. 1996;34:251–266. doi: 10.1016/0360-3016(95)02029-2. [DOI] [PubMed] [Google Scholar]
- (17).Sachs RK, Brenner DJ. Solid tumor risks after high doses of ionizing radiation. Proc Natl Acad Sci U S A. 2005;102:13040–13045. doi: 10.1073/pnas.0506648102. [DOI] [PMC free article] [PubMed] [Google Scholar]
- (18).Little MP. A multi-compartment cell repopulation model allowing for inter-compartmental migration following radiation exposure, applied to leukaemia. J Theor Biol. 2007;245:83–97. doi: 10.1016/j.jtbi.2006.09.026. [DOI] [PubMed] [Google Scholar]
- (19).Shuryak I, Sachs RK, Hlatky L, Little MP, Hahnfeldt P, Brenner DJ. Radiation-induced leukemia at doses relevant to radiation therapy: modeling mechanisms and estimating risks. J Natl Cancer Inst. 2006;98:1794–1806. doi: 10.1093/jnci/djj497. [DOI] [PubMed] [Google Scholar]
- (20).Boice JD, Jr., Engholm G, Kleinerman RA, et al. Radiation dose and second cancer risk in patients treated for cancer of the cervix. Radiat Res. 1988;116:3–55. [PubMed] [Google Scholar]
- (21).Muirhead CR, O'Hagan JA, Haylock RG, et al. Mortality and cancer incidence following occupational radiation exposure: third analysis of the National Registry for Radiation Workers. Br J Cancer. 2009;100:206–212. doi: 10.1038/sj.bjc.6604825. [DOI] [PMC free article] [PubMed] [Google Scholar]
- (22).Ozasa K, Shimizu Y, Suyama A, et al. Studies of the mortality of atomic bomb survivors, report 14, 1950–2003: an overview of cancer and noncancer diseases. Radiat Res. 2012;177:229–243. doi: 10.1667/rr2629.1. [DOI] [PubMed] [Google Scholar]
Associated Data
This section collects any data citations, data availability statements, or supplementary materials included in this article.