

Abstract
Clarification of the genetic nature and more effective care for hypertension are required, given the high incidences of cardiovascular and cerebrovascular mortality. Thus, we surveyed candidate genes for hypertension with rat whole gene DNA microarrays using three novel methods. Gene expression analyses were conducted as follows: Method 1, three types of spontaneously hypertensive rat (SHR) substrains, SHR, stroke-prone SHR (SHRSP) and malignant type of SHRSP (M-SHRSP) were used and compared to normotensive Wistar Kyoto rats; Method 2, the expressed genes between rats of different ages were compared for different blood pressures; and Method 3, genes that were expressed in rats treated with or without an acute hypotensive stimulus, the antihypertensive hydralazine hydrochloride, were compared. This approach identified dozens of genes, including Dusp15, Cyp8b1, Armc 3, Gtpbp4, Mettl2, Mapk14, Prkar2b, frame 12, Anxa13, Ephx2, Myr8 and Pcdh9 by Method 1; Cyp2C and Atp12a by Method 2; and Kcnc3, Vnn1, TC560558 and Gabrq and a number of unknown genes by Methods 2 and 3, as probable candidate genes for hypertension in SHR substrains. Ephx2 was previously reported as a candidate gene in SHRs; however other genes were identified for the first time in this study. Since it was not always possible to completely demonstrate that these genes are responsible for hypertension in SHRs, further research into true candidate genes that participate in the genesis of hypertension in SHR substrains is warranted.
Keywords: kidney, DNA array, hypertension, spontaneously hypertensive rat, stroke-prone spontaneously hypertensive rat, malignant type of stroke-prone spontaneously hypertensive rat, hydralazine
Introduction
Hypertension is one of the most prevalent diseases in humans who live a modern life style. It is a silent disease and does not markedly affect quality of life when it is moderate and not serious. However, when left untreated it leads to life-threatening diseases associated with atherosclerosis, including myocardial infarction, renal failure and strokes (1–3). In Japan, where general medical care should be sufficient to treat hypertension, more than 300,000 patients per year die from diseases that are related to hypertension (4,5). Clarification of the genetic nature and more effective care for hypertension are required.
There are a number of methods for investigating the genetic nature of hypertension. The polygenic nature of human essential hypertension has made it challenging to isolate the genes involved in the genesis of the disease. DNA microarrays are a potentially powerful tool for studying the genetics of hypertension, as they facilitate the measurement of the expression of thousands of genes simultaneously (6–8). Inbred homozygous rodent models of human essential hypertension are ideal for microarray research, and animal models of essential hypertension have been studied using microarrays (9).
In this study, we present a comparison of kidney gene expression in three hypertensive rat models: spontaneously hypertensive rats (SHRs) (10) and two substrains derived from SHR – stroke-prone SHRs (SHRSPs) (11) and malignant-type SHRSPs (M-SHRSPs) (12). SHR, the current model for essential hypertension research, were developed in a breeding program based solely on the selection of elevated blood pressure (BP) in Wistar Kyoto (WKY) rats (10). Normotensive WKY rats, from which the SHR strain was derived, were used as controls. SHRSPs were established from SHRs by selective inbreeding for stroke proneness (11), and M-SHRSPs were selected and established through the brother-sister mating of selected SHRSPs that showed higher BP following treatment with hydralazine hydrochloride to prevent the development of hypertension and stroke (12). An inbred strain of M-SHRSPs shows BPs of 250 mmHg or higher before 14 weeks of age and, compared to SHRSPs, M-SHRSPs showed more rapid and severe increases in BP and stroke in almost all animals. Our facility is one of the original places that bred the three types of SHR substrains and families. The former director, Professor Kozo Okamoto, introduced these animals to our school when relocating from the Kyoto University School of Medicine, the original site of SHR breeding. Using these three SHR substrains, we previously reported (13) that a number of BP-regulating genes, including sparc/osteonectin (Spock2), kynureninase (Kynu), regulator of G-protein signaling 2 (Rgs2) and gap junction protein α1 (Gja1) were identified as up-regulated, and urotensin 2 (Uts2), cytoplasmic epoxide hydrolase 2 (Ephx2), apelin (Apln), insulin-like growth factor 1 receptor (Igf1r) and angiotensin II receptor-associated protein (Agtrap) were identified as down-regulated in the adrenal glands at 6 weeks of age.
Kidneys are logical candidate organs for studying hypertension due to their direct influence on body fluids and endocrine, cardiovascular and sympathetic functions (14,15). The relationship between kidney function and blood pressure is known to be influenced by numerous intrinsic and extrinsic factors, such as the renin-angiotensin system and catecholamine and aldosterone hormones (16,17). Previously, Sty1 (18), Edg1, Vcam1 (19), C1q, CD24 (20), SPON1 (21), Gstm1 (22), ACE-2 (23), AMPK, APLP2 (24), Ephx2, Ela1 (25) and Egln1 (26) were shown to be hypertension-related genes in SHR or SHRSP kidneys using a DNA microarray. In contrast to the reports, this study is the first attempt to compare gene expression profiles in the kidneys of three SHR substrains, SHR, SHRSP and M-SHRSP, employing WKY rats as controls and using DNA microarrays to survey for genes related to hypertension in these SHR substrains. In addition to analyzing gene expression in these three types of SHR substrains (Method 1), young rats whose BP levels were not yet elevated (6 weeks of age) and slightly older rats that developed hypertension (9 weeks of age) were used to survey candidate blood pressure elevating genes and to examine the relationship between blood pressure elevation and gene expression (Method 2). Next, a hypotensive drug with no known receptor, hydralazine hydrochloride, was administered to each group of rats to induce acute hypotension to detect hypertension-associated genes. Thus, genes induced by acute hypotension were identified (Method 3). This study aimed to use three analytical methods to comprehensively identify candidate genes involved in the genesis of hypertension in the kidneys of SHR substrains.
Materials and methods
Animals
The experiments were performed on rats at 6 and 9 weeks of age. A total of 3 rats were used in each experimental group. WKY/Izm was used as a wild-type control strain, and SHR/Kpo (10), SHRSP/Kpo (11) and M-SHRSP/Kpo (12) were hypertensive model rats. WKY/Izm were purchased from SLC Co. (Shizuoka, Japan) and the other three substrains were purchased from the Animal Center of Kinki University School of Medicine. The animals used in this experiment were handled with due care according to the guidelines established by the Japanese Association for Laboratory Animal Science, which complies with international rules and policies. This study was performed under approval (KAME-19-078 on April 1, 2007) of the Animal Care and Use Committee of Kinki University. Measures were taken to minimize the pain and discomfort of the experimental animals. Hydralazine hydrochloride (30 mg/kg/day) mixed with SP-2 chow (Funahashi Farm, Chiba, Japan) was administered to half of each rat group (n=3) to induce an acute decline in blood pressure for 2 days prior to euthanasia.
Systolic blood pressure measurements
Systolic BP (SBP) was measured using the tail-cuff method with a UR-5000 instrument (Ueda, Tokyo, Japan). Briefly, three consecutive SBP readings were taken between 09:00–11:00 after warming the body at 35°C for 5 min in a heater box. The SBP values were expressed as the mean ± SEM.
Tissue processing and RNA isolation
After the kidneys were harvested under sodium pentobarbital anesthesia (50 mg/kg i.p.), the organs were homogenized at a pitch speed of 22 strokes/sec for 2 min (twice) in a 2-ml plastic tube with 5-mm diameter glass beads with a Qiagen Tissue Lyser (Retsch GmbH & Co., Haan, Germany). Total RNA was extracted with an RNeasy Mini kit (Qiagen GmbH, Hilden, Germany) according to the manufacturer's protocol. The quality of RNA was checked with RNA Nano Chips (Agilent Technologies, Waldbornn, Germany) with an Agilent 2100 Bioanalyzer, and the RNA was then used in the microarray experiments. For the microarray analysis, tissues from 3 rats per group of all hypertensive and normotensive strains were used in each experiment.
Analysis of gene expression profiling with oligonucleotide arrays
To examine the gene expression profiles of rat kidneys, cRNA labeled with cyanine 3-CTP (PerkinElmer, Boston, MA, USA) was synthesized from 1 μg of DNase I-treated total RNA with a Low RNA Input Amplification kit (Agilent Technologies), and this was hybridized by incubating with a Whole Rat Genome Microarray (4×44K formatted) (Agilent Technologies) in a rotor oven (Agilent Technologies) for 17 h at 65°C, followed by washing. The hybridized slides were scanned with an Agilent GenPix Scanner 4000 (Agilent Technologies). The data were extracted, and the overall raw signal intensities on each array were normalized to the median value of all rat probes with BRB-Array Tool software ver. 3.7.0. (Biometric Research Branch) (27). A significance level (P<0.01) for each probe was set using the univariate Student's t-test.
Annotation of differentially expressed genes
A BLASTN search of the NCBI RefSeq database was performed, employing corresponding 60-nucleotide probes (NCBI, GEO accession: GPL7294) to identify homologous genes with functional annotations (28). After running the BLASTN search, clones showing either a score higher than 50 or an E-value below 5e-05 were defined as annotated clones, and the remaining clones were defined as non-annotated clones or unknown genes. The annotated gene and protein symbols are shown in italics and regular font, respectively.
Strategies to survey candidate genes related to hypertension
The following three different analyses were adopted to identify candidate genes related to or causing hypertension as described above. Method 1: data from the comparison among the SHR substrains were used to survey candidate genes among the SHRs, SHRSPs and M-SHRSPs according to the ascending order of hypertension. Method 2: data from the comparison between the 6- and 9-week-old rats of each SHR substrain were used to survey the candidate genes in ascending or descending order of expression between age groups in each substrain. Method 3: data obtained from the comparison of hypotensive effects, with or without hydralazine hydrochlo-ride treatment, in the SHR substrains compared to the WKY rats were used to survey the genes induced by this treatment in each SHR substrain.
Analyses of genes expressed in biochemical pathways
Analyses of the role of genes expressed in biochemical pathways were performed using Skypainter of REACTOME, a free and open-source database (http://www.reactome.org/), offered on the website of the Cold Spring Harbor Laboratory, The European Bioinformatics Institute and The Gene Ontology Consortium.
Statistical analyses
Comparisons between the means of the data in each group were performed using one-way analysis of variance (ANOVA) and Scheffe's multiple comparisons test. Differences were considered significant at P<0.05 and P<0.01 for BP measurements and DNA array measurements, respectively.
Results
Blood pressure
SBP was measured in the WKY rats and the three SHR substrains at 6 and 9 weeks of age before and 2 days after receiving 30 mg/kg/day p.o. hydralazine hydrochloride (Table I). SBP levels in the SHRs and M-SHRSPs were significantly higher than levels in the WKY rats at 6 weeks of age. At 9 weeks of age, SBP levels increased in the order WKY rats, SHRs, SHRSPs and M-SHRSPs as compared to those at 6 weeks of age, and every value was higher than that noted in the WKY rats. Moreover, hydralazine hydrochloride (30 mg/kg/day p.o.) significantly decreased SBP levels in every rat at 6 and 9 weeks of age 2 days after drug administration compared to the values prior to drug administration
Table I.
SBP levels (mmHg) of the WKYs, SHRs, SHRSPs and M-SHRSPs with or without hydralazine administration for 2 days.
| Rats | 6 weeks of age (n=3)
|
9 weeks of age (n=3)
|
||
|---|---|---|---|---|
| No treatment | 30 mg/kg hydralazine | No treatment | 30 mg/kg hydralazine | |
| WKY | 130±4.1 | 118±4.9d | 137±5.2 | 122±1.2d |
| SHR | 139±2.5a | 127±6.4d | 158±7.1b,c | 146±4.3d |
| SHRSP | 140±7.6 | 126±1.2d | 180±10b,c | 161±5.8d |
| M-SHRSP | 153±2.1a | 142±3.4d | 217±10b,c | 198±6.0d |
Significant differences at P<0.05;
vs. 6-week-old WKY;
vs. 9-week-old WKY;
vs. the same subgroup of rats aged 6 weeks,
vs. without hydralazine (no treatment);
Microarray findings
Since this study aimed to identify the candidate genes involved in the genesis of hypertension in three SHR substrains, gene expression profiles were compared to DNA microchips that contained 41,012 probes using the mRNAs extracted from the kidneys of the three SHR substrains at 6 and 9 weeks of age, with or without the hypotensive agent, hydralazine hydrochloride, which dilates resistant arteries distributed in the whole body through an unknown receptor. The numbers of up- and down-regulated genes were less than the number of probes due to redundancy in the probe sets (i.e., in some cases, two or three probes represent one gene).
Method 1: Comparison of the spontaneously hypertensive rat substrains
Significantly increased or decreased DNA array data from each SHR substrain were obtained and compared to age-matched WKY rats. In 6-week-old rats, the numbers of significantly up-regulated genes compared to the WKY rats at the level of a probability ratio <0.01 were 217, 405 and 224 in SHRs, SHRSPs and M-SHRSPs, respectively. The numbers of commonly expressed genes between the SHRs and SHRSPs, SHRSPs and M-SHRSPs, and M-SHRSPs and SHRs were 135, 123 and 79, respectively. A total of 63 genes were commonly expressed in the SHRs, SHRSPs and M-SHRSPs Among these genes, 16 were expressed more than four times higher than in the WKY rats (Table II). Of these 16 genes, Gc, Sugt 1, Dusp15, Cyp8b1, Sult1b1, EprE, Armc 3, Serpina3m, Bri3bp, Ptrh1 and Trps1 were identified as known functional genes in addition to five previously unidentified genes. In 9-week-old rats, the numbers of significantly up-regulated genes compared to the WKY rats at the level of a probability ratio <0.01 were 5,447, 4,172 and 9,549 in the SHRs, SHRSPs and M-SHRSPs, respectively. The numbers of commonly expressed genes between the SHRs and SHRSPs, SHRs and M-SHRSPs, and SHRSPs and M-SHRSPs were 2,764, 3,647 and 3,018, respectively. In the SHRs, SHRSPs and M-SHRSPs, 2,103 genes were commonly expressed. Of these genes, 37 genes were expressed more than four times higher compared to the WKY rats (Table III). Of these 37 genes, Dusp15, Armc 3, Cyp8b1, Acox2, Sugt 1, Rdh2, Zfp597, Gtpbp4, Serpina3m, Gc, XR_006738 (similar to nucleolar GTP-binding protein 1), Tmem14a, XM_347233 (similar to indolethylamine N-methyltransferase), TC539990 (ATP synthase subunit 8), TC540923 (phosphatidylinositol 3 kinase regulator), TC528756 (EprE protein), Gloxd1, Fbxo36, Ddit4, Sv2a, Cyr61, RGD1560736 (similar to solute carrier family 9), Dpt, Mett12, Mapk14, LOC689240 (similar to amyotrophic lateral sclerosis 2 chromosome region), Bri3bp, Slc11a1 and Prkar2b were identified as known functional genes in addition to ten previously unidentified genes. A total of 8 genes were identified that were commonly expressed at a higher level in the SHRs, SHRSPs and M-SHRSPs compared to the WKY rats at 6 and 9 weeks of age (Table IV). A total of 7 known genes, Gc, Dusp15, Sugt 1, Cyp8b1, Armc 3, Serpina3m and Bri3bp, and one previously unknown gene were detected.
Table II.
Genes (16) commonly expressed more than four times higher in the kidneys of the SHRs, SHRSPs and M-SHRSPs compared to WKY rats at 6 weeks of age.
| Fold increases (/WKY)
|
||||||
|---|---|---|---|---|---|---|
| SHR | SHRSP | M-SHRSP | Clones | GB account | Description | |
| 1. | 91.961 | 27.387 | 49.827 | A_43_P13995 | Gc | Group-specific component |
| 2. | 26.341 | 29.378 | 20.778 | A_44_P863709 | AW143870 | RGICB87 5′ end, mRNA sequence |
| 3. | 18.587 | 17.952 | 17.263 | A_44_P868694 | TC538548 | Sugt 1, kinetochore function |
| 4. | 18.822 | 17.034 | 17.395 | A_44_P562830 | Dusp15_predicted | Dual specificity phosphatase-like 15 (predicted) |
| 5. | 14.245 | 15.181 | 9.883 | A_44_P653949 | TC558814 | Unknown |
| 6. | 13.108 | 6.051 | 9.843 | A_44_P387780 | Cyp8b1 | Cytochrome P450, family 8, subfamily b, polypeptide 1 |
| 7. | 8.900 | 7.453 | 9.406 | A_44_P371125 | Sult1b1 | Sulfotransferase family 1B, member 1 |
| 8. | 6.604 | 7.894 | 7.490 | A_44_P670594 | TC528756 | O87809 EprE protein |
| 9. | 9.898 | 5.456 | 6.217 | A_42_P655890 | XM_225610 | Armc3, multiple functions in signal transduction |
| 10. | 6.068 | 7.768 | 7.310 | A_44_P470661 | Serpina3m | Serine (or cysteine) proteinase inhibitor, member 3M |
| 11. | 7.768 | 6.944 | 5.705 | A_42_P732437 | Bri3bp | Bri3 binding protein |
| 12. | 7.222 | 6.495 | 6.503 | A_44_P227132 | RGD1564324_predicted | cDNA clone UI-R-CV1-bvu-e-07-0-UI 3′ |
| 13. | 6.473 | 6.865 | 5.205 | A_44_P928190 | RGD1561961_predicted | Similar to IQ motif and WD repeats 1 (predicted) |
| 14. | 5.301 | 5.194 | 5.294 | A_42_P578953 | Ptrh1_predicted | Peptidyl-tRNA hydrolase 1 homolog (predicted) |
| 15. | 5.733 | 5.427 | 4.624 | A_44_P176831 | BG378920 | BG378920 UI-R-CV1-bvu-e-07-0-UI.s1 UI-R-CV1 |
| 16. | 4.841 | 4.507 | 4.438 | A_44_P1033521 | Trps1_predicted | Trichorhinophalangeal syndrome I (predicted) |
Gene names in bold print represent genes commonly expressed at 6 and 9 weeks of age.
Table III.
Genes (37) commonly expressed more than four times higher in the kidneys of the SHRs, SHRSPs and M-SHRSPs compared to the WKY rats at 9 weeks of age.
| Fold increases (/WKY)
|
||||||
|---|---|---|---|---|---|---|
| SHR | SHRSP | M-SHRSP | Clones | GB account | Description | |
| 1. | 29.913 | 28.674 | 39.915 | A_44_P863709 | AW143870 | cDNA clone RGICB87 5′ end |
| 2. | 22.900 | 29.660 | 36.970 | A_44_P562830 | Dusp15_predicted | Dual specificity phosphatase-like 15 (predicted) |
| 3. | 40.920 | 14.342 | 25.341 | A_44_P457153 | RGD1564999_predicted | Similar to isopentenyl-diphosphate δ isomerase 2 |
| 4. | 26.305 | 15.898 | 14.860 | A_42_P655890 | XM_225610 | Armc 3, multiple functions in signal transduction |
| 5. | 25.413 | 12.309 | 17.761 | A_44_P387780 | Cyp8b1 | Cytochrome P450, family 8, subfamily b, polypeptide 1 |
| 6. | 15.568 | 14.383 | 23.048 | A_44_P653949 | TC558814 | Unknown |
| 7. | 13.884 | 9.754 | 15.786 | A_44_P330188 | Acox2 | Acyl-Coenzyme A oxidase 2 |
| 8. | 9.098 | 10.313 | 16.107 | A_44_P868694 | TC538548 | Sugt 1, kinetochore function |
| 9. | 7.847 | 9.047 | 16.460 | A_44_P970369 | BG664685 | cDNA clone DRABHF03 5′ |
| 10. | 10.039 | 8.030 | 13.229 | A_44_P132729 | Rdh2 | Retinol dehydrogenase 2 |
| 11. | 9.048 | 8.655 | 11.654 | A_42_P826202 | Zfp597 | Zinc finger protein 597 |
| 12. | 11.879 | 4.934 | 10.385 | A_43_P12900 | Gtpbp4 | GTP binding protein 4 |
| 13. | 6.778 | 7.495 | 10.912 | A_44_P470661 | Serpina3m | Serine (or cysteine) proteinase inhibitor, member 3M |
| 14. | 6.829 | 7.566 | 11.821 | A_44_P746348 | RGD1562658_predicted | Similar to RIKEN cDNA 1700009P17 (predicted) |
| 15. | 8.605 | 5.376 | 11.989 | A_43_P13995 | Gc | Group-specific component |
| 16. | 11.364 | 4.291 | 9.047 | A_44_P1036339 | XR_006738 | Similar to nucleolar GTP-binding protein 1 |
| 17. | 6.639 | 6.330 | 11.704 | A_44_P1029892 | Tmem14a_predicted | Transmembrane protein 14A (predicted) |
| 18. | 4.650 | 7.172 | 12.044 | A_43_P23115 | XM_347233 | Similar to indolethylamine N-methyltransferase |
| 19. | 10.275 | 5.217 | 8.145 | A_44_P792207 | TC539990 | O63614 (O63614) ATP synthase subunit 8 |
| 20. | 6.619 | 8.338 | 8.469 | A_44_P777328 | TC540923 | Phosphatidylinositol 3 kinase regulator |
| 21. | 5.459 | 5.549 | 9.791 | A_44_P670594 | TC528756 | O87809 (O87809) EprE protein |
| 22. | 6.291 | 5.570 | 8.778 | A_44_P464942 | BF545795 | cDNA clone UI-R-BT0-qc-d-07-0-UI 5′ |
| 23. | 6.257 | 5.488 | 8.339 | A_44_P117119 | Gloxd1 | Glyoxalase domain containing 1 |
| 24. | 6.115 | 5.583 | 7.945 | A_42_P645467 | Fbxo36_predicted | F-box only protein 36 (predicted) |
| 25. | 8.799 | 6.587 | 4.183 | A_43_P16225 | J01879 | Rat brain-specific identifier sequence RNA, clone p2a120 |
| 26. | 5.900 | 4.490 | 7.362 | A_44_P556895 | Ddit4 | DNA-damage-inducible transcript 4 |
| 27. | 5.505 | 5.534 | 6.463 | A_44_P928190 | RGD1561961_predicted | Similar to IQ motif and WD repeats 1 (predicted) |
| 28. | 4.469 | 4.354 | 8.532 | A_42_P649672 | Sv2a | Synaptic vesicle glycoprotein 2a |
| 29. | 6.838 | 5.859 | 4.258 | A_44_P218896 | Cyr61 | Cysteine rich protein 61 |
| 30. | 5.950 | 4.612 | 6.371 | A_44_P333374 | RGD1560736_predicted | Similar to solute carrier family 9 (predicted) |
| 31. | 4.734 | 4.573 | 6.306 | A_44_P180259 | Dpt_predicted | Dermatopontin (predicted) |
| 32. | 4.471 | 4.216 | 6.773 | A_44_P534791 | Mettl2_predicted | Methyltransferase like 2 (predicted) |
| 33. | 4.846 | 4.425 | 5.821 | A_44_P360409 | Mapk14 | Mitogen activated protein kinase 14 |
| 34. | 5.594 | 4.498 | 4.891 | A_44_P497253 | LOC689240 | Similar to amyotrophic lateral sclerosis 2 chromosome region |
| 35. | 4.151 | 4.143 | 5.636 | A_42_P732437 | Bri3bp | Bri3 binding protein |
| 36. | 4.203 | 4.772 | 4.697 | A_44_P466118 | Slc11a1 | Solute carrier family 11, member 1 |
| 37. | 4.512 | 4.038 | 4.971 | A_44_P316122 | Prkar2b | Protein kinase, cAMP dependent regulatory, type II β |
Gene names in bold print represent genes commonly expressed either at 6 or 9 weeks of age.
Table IV.
Genes (8) commonly expressed more than four times in the kidneys of the SHRs, SHRSPs and M-SHRSPs compared to the WKY rats at 6 and 9 weeks of age.
| Fold increases (/WKY): 6 or 9 weeks
|
||||||
|---|---|---|---|---|---|---|
| SHR | SHRSP | M-SHRSP | Clones | GB account | Description | |
| 1. | 91.961 | 27.387 | 49.827: 6W | A_43_P13995 | Gc | Group-specific component |
| 8.605 | 5.376 | 11.989: 9W | ||||
| 2. | 18.822 | 17.034 | 17.395: 6W | A_44_P562830 | Dusp15_predicted | Dual specificity phosphatase-like 15 (predicted) |
| 22.900 | 29.660 | 36.970: 9W | ||||
| 3. | 14.245 | 15.181 | 9.883: 6W | A_44_P653949 | TC558814 | Unknown |
| 15.568 | 14.383 | 23.048: 9W | ||||
| 4. | 18.587 | 17.952 | 17.263: 6W | A_44_P868694 | TC538548 | Sugt 1, kinetochore function |
| 9.098 | 10.313 | 16.107: 9W | ||||
| 5. | 13.108 | 6.051 | 9.843: 6W | A_44_P387780 | Cyp8b1 | Cytochrome P450, family 8, subfamily b, polypeptide 1 |
| 25.413 | 12.309 | 17.761: 9W | ||||
| 6. | 9.898 | 5.456 | 6.217: 6W | A_42_P655890 | XM_225610 | Armc 3, multiple functions in signal transduction |
| 26.305 | 15.898 | 14.860: 9W | ||||
| 7. | 6.068 | 7.768 | 7.310: 6W | A_44_P470661 | Serpina3m | Serine (or cysteine) proteinase inhibitor, member 3M |
| 6.778 | 7.495 | 10.912: 9W | ||||
| 8. | 7.768 | 6.944 | 5.705: 6W | A_42_P732437 | Bri3bp | Bri3 binding protein |
| 4.151 | 4.143 | 5.636: 9W | ||||
6W and 9W represent 6 and 9 weeks of age, respectively.
In 6-week-old rats, the numbers of significantly down-regulated genes compared to the WKY rats at the level of a probability ratio <0.01 were 1,611, 1,260 and 1,361 in the SHRs, SHRSPs and M-SHRSPs, respectively. The numbers of commonly down-regulated genes between the SHRs and SHRSPs, SHRs and M-SHRSPs, and SHRSPs and M-SHRSPs were 1,094, 1,021 and 851, respectively. In the SHRs, SHRSPs and M-SHRSPs, 767 genes were commonly down-regulated. Of these genes, 6 were expressed less than 1/4 the levels noted in the WKY rats (Table V). SclB, Hmmr and frame 12 were identified as known genes in addition to three previously unidentified genes. In 9-week-old rats, the numbers of significantly down-regulated genes compared to those in the WKY rats at the level of a probability ratio <0.01 were 1,330, 1,465 and 176 in the SHRs, SHRSPs and M-SHRSPs, respectively. The numbers of commonly down-regulated genes between the SHRs and SHRSPs, SHRs and M-SHRSPs, and SHRSPs and M-SHRSPs were 844, 121 and 125, respectively. In the SHRs, SHRSPs and M-SHRSPs, 121 commonly down-regulated genes were identified. Of these genes, 18 were expressed less than 1/4 the levels noted in the WKY rats (Table VI) and included Anxa13, SclB, Olr1455, frame 12, Ephx2, Kb9, Myr8, Tspan1, Pcdh9 and CA506853 (HIV-I Nef negative effector of Fas and TNF) as known genes in addition to 8 previously unidentified genes. A total of 5 genes were found to be commonly expressed at lower levels in SHR, SHRSP and M-SHRSP compared to WKY at 6 and 9 weeks of age (genes shown in bold in Table V) and included SclB, Hmmr and frame 12.
Table V.
Genes (6) whose expression was commonly lower in the kidneys of the SHRs, SHRSPs and M-SHRSPs compared to the WKY rats at 6 weeks of age.
| Fold changes (/WKY)
|
||||||
|---|---|---|---|---|---|---|
| SHR | SHRSP | M-SHRSP | Clones | GB account | Description | |
| 1. | 0.088 | 0.088 | 0.091 | A_44_P808578 | TC525845 | SclB, collagen-like surface protein of Streptococcus |
| 2. | 0.104 | 0.094 | 0.088 | A_44_P362486 | BQ780215 | cDNA clone UI-R-FF0-cpb-k-24-0-UI 3′ |
| 3. | 0.044 | 0.179 | 0.114 | A_44_P292314 | Hmmr | Hyaluronan mediated motility receptor |
| 4. | 0.127 | 0.141 | 0.102 | A_44_P402948 | TC540893 | Unknown |
| 5. | 0.156 | 0.161 | 0.113 | A_44_P306008 | AI179380 | Frame 12, RSPCG42 3′ end |
| 6. | 0.174 | 0.174 | 0.220 | A_42_P719350 | RGD1562974_predicted | Similar to DKFZp434P0316 (predicted) |
Gene names in bold print represent genes commonly expressed either at 6 or 9 weeks of age.
Table VI.
Genes (18) whose expression was commonly lower in the kidneys of the SHRs, SHRSPs and M-SHRSPs compared to WKY at 9 weeks of age.
| Fold changes (/WKY)
|
||||||
|---|---|---|---|---|---|---|
| SHR | SHRSP | M-SHRSP | Clones | GB account | Description | |
| 1. | 0.033 | 0.039 | 0.032 | A_44_P157134 | Anxa13_predicted | Annexin A13 (predicted) |
| 2. | 0.071 | 0.073 | 0.055 | A_44_P396474 | RGD1563398_predicted | RGD1563398 (predicted) |
| 3. | 0.062 | 0.054 | 0.093 | A_44_P362486 | BQ780215 | cDNA clone UI-R-FF0-cpb-k-24-0-UI 3′ |
| 4. | 0.077 | 0.080 | 0.077 | A_44_P808578 | TC525845 | SclB, collagen-like surface protein of Streptococcus |
| 5. | 0.044 | 0.045 | 0.158 | A_44_P540755 | Olr1455_predicted | Olfactory receptor 1455 (predicted) |
| 6. | 0.067 | 0.095 | 0.085 | A_44_P402948 | TC540893 | Unknown |
| 7. | 0.086 | 0.056 | 0.157 | A_44_P306008 | AI179380 | Frame 12, RSPCG42 3′ end |
| 8. | 0.100 | 0.083 | 0.121 | A_44_P531870 | Ephx2 | Epoxide hydrolase 2 |
| 9. | 0.073 | 0.112 | 0.146 | A_44_P138838 | Kb9 | Type II keratin Kb9 |
| 10. | 0.112 | 0.125 | 0.193 | A_44_P850331 | BF554752 | cDNA clone UI-R-C2p-ol-e-12-0-UI 5′ |
| 11. | 0.150 | 0.108 | 0.179 | A_44_P142391 | LOC360919 | Similar to α-fetoprotein |
| 12. | 0.158 | 0.163 | 0.127 | A_44_P510436 | Myr8 | Myosin heavy chain |
| 13. | 0.122 | 0.142 | 0.223 | A_43_P10290 | Tspan1 | Tetraspanin 1 |
| 14. | 0.130 | 0.144 | 0.247 | A_42_P719350 | RGD1562974_predicted | Similar to DKFZp434P0316 (predicted) |
| 15. | 0.217 | 0.128 | 0.206 | A_44_P900530 | Pcdh9_predicted | Protocadherin 9 (predicted) |
| 16. | 0.198 | 0.135 | 0.249 | A_44_P324806 | AI103119 | cDNA clone REMBX47 3′ end |
| 17. | 0.223 | 0.206 | 0.212 | A_44_P223009 | CA506853 | HIV-I Nef: negative effector of Fas and TNF |
| 18. | 0.205 | 0.223 | 0.221 | A_44_P780781 | TC564995 | Unknown |
Gene names in bold print were expressed at lower levels at either 6 or 9 weeks of age.
Up-regulated genes in the SHR substrains compared to the WKY rats were separately analyzed with the Reactome database to determine the functional relationship in hypertension. An example of analysis of genes up-regulated more than two times in the M-SHRSPs compared to the WKY rats at 6 weeks of age (n=193) is shown in Fig. 1A. Analysis of genes up-regulated more than four times in the M-SHRSPs compared to the WKY rats at 9 weeks of age (n=228) is shown in Fig. 1B. A total of 4 genes, including Yc2, Cyp2c, Gsta3 and Cyp8b1, participate in biological oxidation with a relatively strong relationship at the P=1.4×10⁻² level at 6 weeks of age. A total of 7 genes, including RGD1564999, Hmgcs2, Apob, Aptlc1, Acox2, Angptl4 and Cyp8b1, participate in the metabolism of lipids and lipoproteins with a relatively stronger relationship at the P=4.1×10⁻² level at 9 weeks of age.
Figure 1.
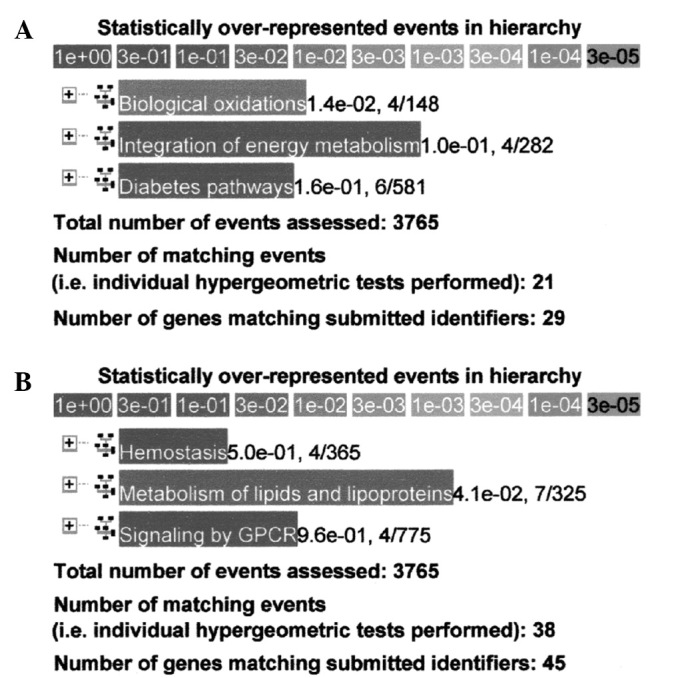
Sample analysis using the Reactome database in Method 1 [more up-regulated genes in the spontaneously hypertensive rats (SHRs) substrains than in the Wistar Kyoto (WKY) rats]. Sample analysis of genes that were up-regulated >2 times in the malignant-type stroke-prone SHRs than in the WKY rats at (A) 6 weeks of age, n=193, and (B) 9 weeks of age, n=228.
Method 2: Comparison of two different ages of each spontaneously hypertensive rat substrain
SBP was elevated in each SHR strain during the period from 6 to 9 weeks of age as shown in Table I. Therefore, candidate genes that were up- or down-regulated during this time may be related to hypertension. Multiple methods were used to survey candidate genes related to increased blood pressure during the ages of 6 to 9 weeks in each substrain. The numbers of genes that were up-regulated to a greater extent in rats at 9 compared to 6 weeks of age were 302, 680, 881 and 1,352 in the WKY rats, SHRs, SHRSPs and M-SHRSPs, respectively. Of these genes, 79, 124 and 7 genes were more highly up-regulated in the SHRs, SHRSPs and M-SHRSPs compared to the WKY rats, respectively. A total of 8 genes were up-regulated >1.5 times between rats 6 to 9 weeks of age in two or more substrains or in the M-SHRSPs (Table VII). The known genes were Nef3, Slc26a4, Cyp2C, Gfra1 and Resp18, and three previously unidentified genes were noted as well. The numbers of genes showing reduced expression in rats at 9 weeks of age compared to 6 weeks of age were 988, 285, 1,285 and 38 in the WKY rats, SHRs, SHRSPs and M-SHRSPs, respectively. Of these genes, 5, 51 and 0 genes showed reduced expression in the SHRs, SHRSPs and M-SHRSPs compared to the WKY rats, respectively. A total of 2 genes, Atp12a and Hbb, were expressed at less than 1/4 the levels at 6 compared to 9 weeks of age in more than two substrains (Table VIII).
Table VII.
Genes (8) whose expression was higher in the kidneys of the SHRs, SHRSPs and M-SHRSPs at 9 compared to 6 weeks of age and whose expression was higher in the SHR substrains than in the WKY rats.
| Clones | Fold increases (9/6 weeks of age)
|
GB account | Description | |||
|---|---|---|---|---|---|---|
| SHR | SHRSP | M-SHRSP | ||||
| 1. | A_42_P752336 | 5.281 | 8.974 | 10.278 | Nef3 | Neurofilament 3, medium |
| 2. | A_44_P669819 | 2.513 | 2.886 | 5.548 | TC543467 | Unknown |
| 3. | A_42_P800771 | 8.739 | 4.865 | RGD1563825_predicted | Similar to ENSANGP00000020885, SOD | |
| 4. | A_44_P302221 | 5.804 | 5.057 | LOC689753 | Similar to K06A9.1b | |
| 5. | A_44_P1017035 | 1.475 | 2.020 | Slc26a4 | Solute carrier family 26, member 4, controls the balance of charged ions | |
| 6. | A_44_P280786 | 3.749 | 7.594 | Cyp2C | Cytochrome P450, subfamily lic | |
| 7. | A_43_P11634 | 2.117 | Gfra1 | Glial cell line derived neurotrophic factor family receptor α 1 | ||
| 8. | A_43_P12005 | 2.165 | Resp18 | Regulated endocrine-specific protein 18 | ||
Table VIII.
Genes (2) whose expression was lower in the kidney of the SHRs and SHRSPs at 9 compared to 6 weeks of age and was lower compared to the WKYs.
| Clones | Fold changes (9/6 weeks of age)
|
GB account | Description | ||
|---|---|---|---|---|---|
| SHR | SHRSP | ||||
| 1. | A_42_P684885 | 0.229 | 0.118 | Atp12a | ATPase, H+/K+ transporting, non-gastric, α polypeptide |
| 2. | A_44_P306307 | 0.162 | 0.247 | Hbb | Hemoglobin β chain complex |
Using the Reactome database as a representative sample, genes that were up-regulated more than two times (n=391) at 9 compared to 6 weeks of age in M-SHRSP were separately analyzed to determine the functional relationship in hypertension. Although three genes (Slc28a1, Xdh and Gda) were related to the metabolism of nucleotides at a P=9.9×10⁻² level, no significant relationship with other processes was observed (Fig. 2).
Figure 2.
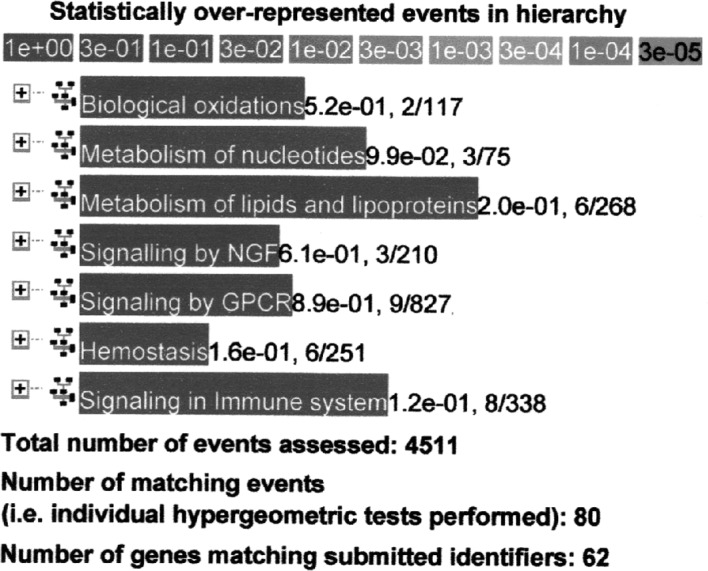
Sample analysis using the Reactome database in Method 2. Genes up-regulated >2 times (n=391) at 9 compared to 6 weeks of age in malignant-type stroke-prone spontaneously hypertensive rats.
Method 3: Comparison between genes expressed with and without hydralazine hydrochloride-induced hypotensive effects in the Wistar Kyoto rats and the spontaneously hypertensive rat substrains
BP was decreased in all rats after 30 mg/kg/day hydralazine hydrochloride treatment for 2 days. In this paradigm, candidate genes related to hydralazine hydrochloride-induced hypotension may be up- or down-regulated, particularly in the SHR substrains. Following administration of hydralazine hydrochloride, 22, 35, 26 and 66 genes in the WKYs, SHRs, SHRSPs and M-SHRSPs were up-regulated 4, 2, 2 and 8 times at 6 weeks of age, respectively. The numbers of genes up-regulated >1.0-fold in the WKY rats and M-SHRSPs, SHRs and SHRSPs, SHRs and M-SHRSPs, and SHRSPs and M-SHRSPs at 6 weeks of age were 67, 5, 9 and 23, respectively. Following administration of hydralazine hydrochloride, 9, 34, 60 and 4 genes in the WKY rats, SHRs, SHRSPs and M-SHRSPs were up-regulated 1.2, 1.2, 1.5 and 1.2 times at 9 weeks of age, respectively. The numbers of genes up-regulated >1.0-fold in the WKY rats and M-SHRSPs, SHRs and SHRSPs, SHRs and M-SHRSPs, and SHRSPs and M-SHRSPs at 9 weeks of age were 67, 5, 9 and 23, respectively. On the other hand, following administration of hydralazine hydrochloride, 13, 20, 11 and 18 genes showed expression that was reduced 0.6, 0.2, 0.6 and 0.25 times in the WKY rats, SHRs, SHRSPs and M-SHRSPs at 6 weeks of age, respectively. The numbers of genes showing expression that was reduced by <1.0-fold in the WKY rats and M-SHRSPs, SHRs and SHRSPs, SHRs and M-SHRSPs, and SHRSPs and M-SHRSPs at 6 weeks of age were 3, 0, 21 and 3, respectively. In addition, the numbers of genes showing expression that was reduced <0.8 times following administration of hydralazine hydrochloride were 11, 7, 7 and 41 in the WKY rats, SHRs, SHRSPs and M-SHRSPs, respectively, at 9 weeks of age. The numbers of genes showing expression that was reduced <1.0-fold in the WKY rats and M-SHRSPs, SHRs and SHRSPs, SHRs and M-SHRSPs, and SHRSPs and M-SHRSPs at 9 weeks of age were 3, 0, 21 and 3, respectively.
Using this method, few genes were identified that were both up- and down-regulated and commonly expressed between substrains. Thus, the analyses were modified as follows. Genes identified with Method 3 and those identified with Method 2 were combined and considered candidate hypertension-related genes. Using this method, genes that were up-regulated >1.2 times or down-regulated <0.8 times in two or more substrains were focused on. After identifying the genes that were expressed in the WKY rats and satisfying the criteria of Method 2, ten genes satisfied both conditions at once. These 10 genes are strongly suggested to be candidate genes (Table IXA), and they included TC550463 (farnesyl pyrophosphate synthetase), Kcnc3, Vnn1 and RGD1561143 (similar to cell surface receptor FDFACT) in addition to 6 previously unidentified genes. In addition, 4 genes that were up-regulated >4 times following administration of hydralazine hydrochloride for 2 days in 6-week-old M-SHRSP and that satisfied the criteria of Method 2 were identified as possible candidate genes (Table IXB). These genes included TC560558 (FK506-binding protein 1B), TC564079 (Drosophila melanogaster), XM_343516 (similar to sulfotransferase K2) and one previously unidentified gene.
Table IX.
Genes (14) that were up- or down-regulated following administration of hydralazine, and/or were commonly more highly expressed in the kidneys of the SHRs, SHRSPs or M-SHRSPs compared to the WKY rats at 9 compared to 6 weeks of age.
| A, Genes strongly suggested to be associated with hypertension | |||||
|
| |||||
| Fold changes (hydralazine/none) | Strains | Clones | GB account | Description | |
|
| |||||
| 1.a | 9.646 | 6W M-SHRSP | A_44_P566390 | TC550463 | Farnesyl pyrophosphate synthetase |
| 2.a | 9.551 | 6W M-SHRSP | A_44_P623610 | TC525804 | Unknown |
| 3.a | 8.615 | 6W M-SHRSP | A_43_P10474 | TC527985 | Unknown |
| 4.a | 8.419 | 6W M-SHRSP | A_44_P808679 | TC541828 | Unknown |
| 5.a | 8.387 | 6W M-SHRSP | A_44_P104687 | Kcnc3 | Potassium voltage-gate channel protein |
| 6.a | 2.044 | 6W SHRSP | A_44_P871211 | TC566645 | Unknown |
| 7.a | 0.664 | 9W SHR | A_44_P732488 | TC567669 | Unknown |
| 8. | 2.367 | 6W SHR | |||
| 2.529 | 6W SHRSP | A_42_P811256 | Vnn1 | Participate in an oxidative-stress response | |
| 9. | 2.205 | 6W SHRSP | |||
| 8.872 | 6W M-SHRSP | A_44_P854454 | TC543180 | Unknown | |
| 10. | 1.260 | 9W SHR | |||
| 2.115 | 6W SHRSP | A_44_P435955 | RGD1561143_predicted | Similar to cell surface receptor FDFACT | |
|
| |||||
| B, Genes possibly suggested to be associated with hypertension | |||||
|
| |||||
| 1.b | 9.245 | 6M M-SHRSP | A_44_P610417 | TC560558 | FK506-binding protein 1B |
| 2.c | 8.997 | 6W M-SHRSP | A_44_P841829 | TC564079 | CG4187-PA, Drosophila melanogaster |
| 3.b | 8.969 | 6W M-SHRSP | A_44_P917243 | TC533180 | Unknown |
| 4.b | 8.533 | 6W M-SHRSP | A_44_P408114 | XM_343516 | Similar to sulfotransferase K2 |
More highly expressed at 9 than at 6 weeks of age in either SHR or SHRSP;
More highly expressed at 9 than at 6 weeks of age in SHRSP;
More highly expressed at 9 than at 6 weeks of age in SHR.
When genes that were up-regulated 1.5 times (n=505) following hydralazine hydrochloride administration i n 6-week-old SHRSPs were analyzed further with the Reactome database, 5 genes (P=2.7×10⁻²) involved in DNA replication, 14 genes (P=9.7×10⁻²) involved in diabetes pathways, 5 genes (P=5.9×10⁻³) involved in APC/C:Cdh1-mediated degradation of Skp2, 5 genes (P=8.3×10⁻³) involved in Cdc20: phospho-APC/C-mediated degradation of cyclin A, 2 genes (P=9.2×10⁻³) involved in the inhibition of hormone sensitive lipase (HSL), 3 genes (P=6.3×10⁻²) involved in the metabolism of vitamins and cofactors, and 4 genes (P=2.1×10⁻²) involved in Wnt signaling were detected with high significance (Fig. 3). Thus, expression of numerous genes related to DNA replication and cell proliferation, including Psmc6, Psma2, Psma6 and LOC311078 [proteasome (prosome, macropain) subunits], was modified by hydralazine hydrochloride treatment of the SHRSPs with high significance.
Figure 3.
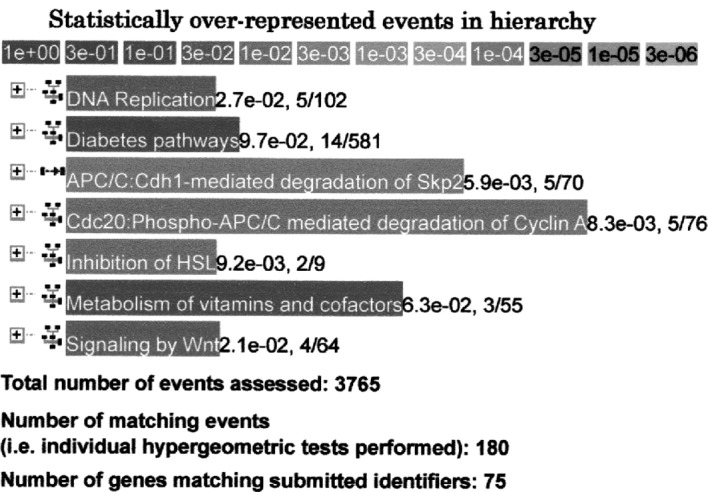
Sample analysis using the Reactome database in Method 3. Genes up-regulated >1.5 times (n=505) following treatment with 30 mg/kg/day hydralazine hydrochloride for 2 days in 6-week-old stroke-prone spontaneously hypertensive rats.
As shown in Table X, the expression of three possibly hypertension-related genes was found to be down-regulated 0.25 times by hydralazine hydrochloride administration for 2 days in either 6-week-old SHR or M-SHRSP, including Gabrq (γ-aminobutyric acid A receptor) and two previously unidentified genes.
Table X.
Genes (3) down-regulated following administration of hydralazine in the SHRs and M-SHRSPs at 6 weeks of age.
| Fold changes (hydralazine/none) | Strains | Clones | GB account | Description | |
|---|---|---|---|---|---|
| 1. | 0.090 | 6W SHR | |||
| 0.168 | 6W M-SHRSP | A_44_P541438 | RGD1308699 | Similar to 1700060H10Rik protein | |
| 2. | 0.132 | 6W SHR | |||
| 0.129 | 6W M-SHRSP | A_43_P15862 | Gabrq | γ-aminobutyric acid A receptor | |
| 3. | 0.113 | 6W SHR | |||
| 0.204 | 6W M-SHRSP | A_44_P281788 | BQ196033 | cDNA clone UI-R-CN1-cmn-f-01-0-UI 3′ |
Discussion
SHRs (10) were created at the Kyoto University School of Medicine, Japan, around 1963 through continuous brother-sister mating of six generations of normotensive WKY rats, and they have a slightly higher BP. Using this strain with high blood pressure, numerous studies concerning essential hypertension, including pathophysiology and the effects of food, have been carried out (29,30). Descendants of SHRs, SHRSPs (11) were created through continuous brother-sister mating in a closed colony of SHRs after approximately one decade of mating. M-SHRSPs (12) were established in 1985 through the brother-sister mating of the SHRSP strain under hypotensive treatment with hydralazine hydrochloride to avoid stroke during mating and litter care. An inbred strain of M-SHRSP shows SBPs of 250 mmHg or higher before 14 weeks of age, and shows more rapid and severe increases in BP and stroke in almost all animals (31). These three types of hypertensive rat substrains, SHR, SHRSP and M-SHRSP, have been used in multiple investigations of pathophysiology, preventive medicine, pharmacology and drug development worldwide (29–32). Our facility is one of the original places that bred the three types of SHR substrains and families. For our present study, we decided to use DNA array methodology and these three hypertensive substrains of rats and the normotensive WKY to identify genes related to hypertension and, when possible, to identify candidate genes that cause hypertension.
For theoretical reasons, we should have investigated hereditary subjects using congenic or consomic animal models of disease (33,34). We considered the three substrains of hypertensive rats, SHR, SHRSP and M-SHRSP, to belong to one family, although several decades have passed since the inbred strains were established. SHRs are derived from WKY rats, SHRSPs are derived from SHRs and M-SHRSPs are derived from SHRSPs on the basis of higher blood pressure and/or high incidences of stroke as a selection criterion. M-SHRSPs show a higher and earlier elevation of blood pressure that is accompanied by a higher and earlier incidence of stroke compared to SHRSPs. This is also true for SHRSPs compared to SHRs. Therefore, candidate genes for hypertension must be condensed, increased or expressed at higher/lower levels to a greater extent in M-SHRSP than in SHRSP and SHR substrains. On this basis, we searched for candidate genes for hypertension with these three hypertensive SHR substrains compared to normotensive WKY rats.
The kidneys were thought to be the most appropriate tissue for studying hypertension due to their direct influence on body fluids and endocrine, cardiovascular and sympathetic functions (14). There are numerous intrinsic and extrinsic factors, including the renin-angiotensin system and catecholamine and aldosterone hormones, that control the relationship between kidney function and blood pressure (14,15). This study is the first attempt to use DNA microarrays to compare the gene expression profiles of the kidneys of SHRs, SHRSPs and M-SHRSPs employing WKY rats as a control. In addition to analyzing the genes expressed in these three types of SHR substrains (Method 1), young rats (6 weeks old), whose blood pressure was not yet elevated, and slightly older rats (9 weeks old) that had developed hypertension were employed to detect candidates genes related to blood pressure elevation (Method 2). Furthermore, a hypotensive drug, hydralazine hydrochloride, which acts through an unknown receptor, was administered to each group of rats to induce acute hypotension to detect hypertension-associated genes (Method 3). This study aimed to identify candidate genes for hypertension in the kidneys of the SHR substrains using these three analytical methods.
BP was elevated in 9-week-old SHR substrains compared to 6-week-old rats, and tended to increase from WKY to SHR, SHRSP and M-SHRSP in this order at 6 and 9 weeks of age. Hydralazine hydrochloride administration for 2 days decreased blood pressure in all the rats (Table I). Therefore, Methods 1, 2 and 3 may be appropriate for surveying candidate genes related to BP.
In the Method 1 analysis at 6 weeks of age, 16 genes were significantly more highly expressed in SHR, SHRSP and M-SHRSP (Table II). Of these genes, Sugt 1 (kinetochore function), Dusp15 (dual specificity phosphatase-like 15), Armc 3 (multiple functions in signal transduction) and Serpina3m (serine or cysteine protease inhibitor, member 3M) were related to cell proliferation, protein modification or signal transduction. At 9 weeks of age, Cyp8b1 (cytochrome P450, family 8, subfamily b, polypeptide 1), Zfp597 (zinc finger protein 597), Gtpbp4 (GTP binding protein 4), Tmem14a (transmembrane protein 14A), TC540923 (phosphatidylinositol 3 kinase regulator), Sv2a (synaptic vesicle glycoprotein 2a), Mapk14 (mitogen activated protein kinase 14) and Prkar2b (protein kinase, cAMP dependent regulatory type II β) were involved in cell proliferation, protein modification or signal transduction (Table III). At 6 and 9 weeks of age, Gc (group specific component), Dusp15, TC558814 (unknown), Sugt 1, Cyp8b1, Armc 3, Serpina3m and Bri3bp (Bri3 binding protein) were significantly more highly expressed (Table IV). A number of genes were significantly expressed at lower levels and included SclB (collagen-like surface protein of Streptococcus), Hmmr (hyaluronan mediated motility receptor) and frame 12 (RSPCG42 3′ end) at 6 weeks of age (Table V), and Anxa13 (annexin A13), Ephx2 (epoxide hydrolase 2), Kb9 (type II keratin Kb9), Myr8 (myosin heavy chain), Tspan1 (tetraspanin 1) and Pcdh9 (protocadherin 9) at 9 weeks of age (Table VI). A number of previously unidentified genes were also found.
The genes that were identified by Method 1 as being more highly expressed were investigated using the Reactome database to determine how and where they work in biochemical processes. As shown in Fig. 1A and B, these genes were highly related to biological oxidation at 6 weeks of age and metabolism of lipids and lipoproteins at 9 weeks of age. However, these genes were not involved in signal transduction or muscle function in M-SHRSPs compared to WKY rats. Therefore, the data derived from the Method 1 analysis may show differences in metabolic characteristics mainly between SHR substrains and WKY rats, although further study is required.
In the Method 2 analysis, which compared two different ages of each SHR substrain, Nef3 (neurofilament 3), Slc26a4 (solute carrier family 26, member 4, controls the balance of ions), Cyp2C (cytochrome P450, subfamily lic), Gfra1 (glial cell line-derived neurotrophic factor family receptor α1) and Resp18 (regulated endocrine-specific protein 18) were identified as known genes that were up-regulated in addition to three previously unidentified genes (Table VII). In addition, Atp12a (ATPase, H+/K+ transporting, nongastric, α polypeptide) and Hbb (hemoglobin β chain complex) were identified as genes that were down-regulated with age in the SHR substrains (Table VIII). Functional relationship analysis with the Reactome database of genes from 6-week-old M-SHRSP showed three genes involved in the metabolism of nucleotides, including Slc28a1, Xdh and Gda. Therefore, the genes indentified with this method, including Slc26a4, Cyp2C, Gfra1, Resp18 and Atp12a, may be closely related to hypertension as they are related to energy production and consumption or ion exchange. Further investigation is required to determine the importance of these identified genes.
From analysis with Method 3 which compared genes expressed with or without hydralazine hydrochloride-induced hypotensive effects in the SHR substrains to WKY rats, Vnn1 (participates in the oxidative-stress response) was identified as a gene that was more highly expressed, and Gabrq (γ-aminobutyric acid A receptor) was identified as a suppressed gene. These two genes were commonly expressed in more than two SHR substrains. Numerous other genes were uniquely expressed in one SHR substrain, but not expressed commonly among the three substrains. Therefore, other candidate genes were identified by combining Methods 2 and 3. From this process, TC550463 (farnesyl pyrophosphate synthetase), Kcnc3 (potassium voltage-gate channel protein), TC560558 (FK506-binding protein 1B) and XM_343516 (sulfotransferase K2) were selected in addition to a number of previously unidentified genes. When genes that were up-regulated more than 1.5 times (n=505) by hydralazine hydrochloride administration in the 6-week-old SHRSP were analyzed with the Reactome database software, five genes involved in DNA replication, five genes involved in the APC/C:Cdh1-mediated degradation of Skp2, five genes involved in the Cdc20:phospho-APC/C-mediated degradation of cyclin A, two genes involved in the inhibition of HSL and four genes involved in Wnt signaling were detected with high significances (Fig. 3). A number of genes related to DNA replication and cell proliferation, including Psmc6, Psma2, Psma6 and LOC311078 [proteasome (prosome, macropain) subunits], were indentified in 6-week-old SHRSP. Therefore, genes identified with Methods 2 and 3 may be the candidate genes closely related to hypertension for which we are searching.
Although current gene expression arrays permit the simultaneous analysis of thousands of rat genes, this method is not yet capable of addressing all functional genes in the genome. However, as rat genome annotation progresses and arrays continue to improve in their extent of genomic coverage, a more complete analysis will be possible. Our present approach identified dozens of genes, including Dusp15, Cyp8b1, Armc 3, Gtpbp4, Mettl2, Mapk14, Prkar2b, frame 12, Anxa13, Ephx2, Myr8 and Pcdh9 from Method 1; Cyp2C and Atp12a from Method 2; and Kcnc3, Vnn1, TC560558 and Gabrq from Methods 2 and 3, in addition to a number of previously unidentified genes, as probable candidate genes that cause hypertension in SHR substrains, as determined by common biochemical knowledge. Of these genes, only Ephx2 has been previously reported as a strongly related gene in SHRs (24). A key question has arisen regarding Ephx2. Ephx2 was reported to be a significantly up-regulated gene in SHRs by 3.39- and 4.30-fold at 3 and 9 weeks of age, respectively, compared to WKY rats (24). However, we identified Ephx2 as a significantly down-regulated gene at 9 weeks of age (but not at 6) in the SHRs, SHRSPs and M-SHRSPs by 0.100-, 0.083- and 0.121-fold, respectively (Table VI). Fornage et al reported lower expression of this gene in the kidney of 4- to 5-week-old SHRs compared to WKY rats (35), and Corenblum et al observed lower expression of Ephx2 in the brain of SHRSPs compared to stroke-resistant SHRs (36). Although a number of studies have reported that soluble epoxide hydrolase elevates blood pressure by degrading vasodilative epoxyeicosatrienoic acids by means of an inhibitor (37–39), the role of Ephx2 in hypertension remains controversial. Considering our data and several other reports, Ephx2 may not be a candidate gene for hypertension as the expression of Ephx2 was elevated or decreased in some SHR substrains at some ages and, thus, results were not consistent. Ephx2 possibly controls the adaptation of BP changes.
Why the surveyed genes related to hypertension vary among reports has yet to be elucidated. In addition, we believe that discovering the roles of unknown genes is crucial, as genes that are strongly related to hypertension may exist among these candidates, and these genes may be related to the cause of stroke in SHRSPs and M-SHRSPs. Since the majority of these genes have not yet been demonstrated to be responsible for hypertension in SHRs, we must continue to search for true candidate genes that participate in the genesis of hypertension in SHR substrains using current technology.
Acknowledgments
This study was supported by a Japanese Grant-in-Aid for Scientific Research (no. 19500699), an Aid Grant to private universities to cover current expenses from the MEXT in Japan, the Fund of Mishima-Kaiun Memorial Foundation, a donation from Ueshima Coffee Co., Ltd., and the Kinki University School of Medicine. We thank the National Center for Biotechnology Information, USA, and the DNA Data Bank of Japan for access to the network servers.
References
- 1.Acelajado MC, Oparil S. Hypertension in the elderly. Clin Geriatr Med. 2009;25:391–412. doi: 10.1016/j.cger.2009.06.001. [DOI] [PubMed] [Google Scholar]
- 2.Ghiadoni L, Bruno RM, Stea F, Virdis A, Taddei S. Central blood pressure, arterial stiffness, and wave reflection: new targets of treatment in essential hypertension. Curr Hypertens Rep. 2009;11:190–196. doi: 10.1007/s11906-009-0034-5. [DOI] [PubMed] [Google Scholar]
- 3.Kannel WB. Table of contents. Hypertension: reflections on risks and prognostication. Med Clin North Am. 2009;93:541–558. doi: 10.1016/j.mcna.2009.02.006. [DOI] [PMC free article] [PubMed] [Google Scholar]
- 4.Imaizumi Y. Mortality in the elderly population aged over 40 in Japan, 1947–1988. Jinko Mondai Kenkyu (in Japanese) 1991;47:40–57. [PubMed] [Google Scholar]
- 5.Kesteloot H, Yuan XY, Joossens JV. Changing mortality patterns in men. Acta Cardiol. 1988;43:133–139. [PubMed] [Google Scholar]
- 6.Drmanac R, Drmanac S, Strezoska Z, et al. DNA sequence determination by hybridization: a strategy for efficient large-scale sequencing. Science. 1993;260:1649–1652. doi: 10.1126/science.8503011. [DOI] [PubMed] [Google Scholar]
- 7.Schena M, Heller RA, Theriault TP, Konrad K, Lachenmeier E, Davis RW. Microarrays: biotechnology's discovery platform for functional genomics. Trends Biotechnol. 1998;16:301–306. doi: 10.1016/s0167-7799(98)01219-0. [DOI] [PubMed] [Google Scholar]
- 8.Hacia JG, Brody LC, Collins FS. Applications of DNA chips for genomic analysis. Mol Psychiatry. 1998;3:483–492. doi: 10.1038/sj.mp.4000475. [DOI] [PubMed] [Google Scholar]
- 9.McBride MW, Charchar FJ, Graham D, et al. Functional genomics in rodent models of hypertension. J Physiol. 2004;554:56–63. doi: 10.1113/jphysiol.2003.049361. [DOI] [PMC free article] [PubMed] [Google Scholar]
- 10.Okamoto K, Aoki K. Development of a strain of spontaneously hypertensive rat. Jpn Circ J. 1963;27:282–293. doi: 10.1253/jcj.27.282. [DOI] [PubMed] [Google Scholar]
- 11.Okamoto K, Yamori Y, Nagaoka A. Establishment of the stroke-prone spontaneously hypertensive rats (SHR) Circ Res. 1974;34(Suppl 1):143–153. [Google Scholar]
- 12.Okamoto K, Yamamoto K, Morita N, Ohta Y. Establishment and characteristics of rat with precocious and severe hypertension (M-SHRSP) Acta Med Kinki Univ. 1985;10:73–95. [Google Scholar]
- 13.Ashenagar MS, Tabuchi M, Kinoshita K, et al. Gene expression in the adrenal glands of three spontaneously hypertensive rat substrains. Mol Med Rep. 2010;3:213–222. doi: 10.3892/mmr_00000242. [DOI] [PubMed] [Google Scholar]
- 14.Guyton AC. Dominant role of the kidneys and accessory role of whole-body autoregulation in the pathogenesis of hypertension. Am J Hypertens. 1989;2:575–585. doi: 10.1093/ajh/2.7.575. [DOI] [PubMed] [Google Scholar]
- 15.Guyton AC. Abnormal renal function and autoregulation in essential hypertension. Hypertension. 1991;18(Suppl 5):49–53. doi: 10.1161/01.hyp.18.5_suppl.iii49. [DOI] [PubMed] [Google Scholar]
- 16.Gavras H, Brunner HR, Laragh JH. Renin and aldosterone and the pathogenesis of hypertensive vascular damage. Prog Cardiovasc Dis. 1974;17:39–49. doi: 10.1016/0033-0620(74)90037-1. [DOI] [PubMed] [Google Scholar]
- 17.Satoh T, Owada S, Ishida M. Recent aspects in the genetic renal mechanisms involved in hypertension. Intern Med. 1999;38:919–926. doi: 10.2169/internalmedicine.38.919. [DOI] [PubMed] [Google Scholar]
- 18.Ely D, Milsted A, Dunphy G, et al. Delivery of sry1, but not sry2, to the kidney increases blood pressure and SNS indices in normotensive WKY rats. BMC Physiol. 2009;9:10. doi: 10.1186/1472-6793-9-10. [DOI] [PMC free article] [PubMed] [Google Scholar]
- 19.Graham D, McBride MW, Gaasenbeek M, et al. Candidate genes that determine response to salt in the stroke-prone spontaneously hypertensive rat: congenic analysis. Hypertension. 2007;50:1134–1141. doi: 10.1161/HYPERTENSIONAHA.107.095349. [DOI] [PubMed] [Google Scholar]
- 20.Kreutz R, Schulz A, Sietmann A, Stoll M, Daha MR, de Heer E, Wehland M. Induction of C1q expression in glomerular endothelium in a rat model with arterial hypertension and albuminuria. J Hypertens. 2007;25:2308–2316. doi: 10.1097/HJH.0b013e3282ef8611. [DOI] [PubMed] [Google Scholar]
- 21.Clemitson JR, Dixon RJ, Haines S, et al. Genetic dissection of a blood pressure quantitative trait locus on rat chromosome 1 and gene expression analysis identifies SPON1 as a novel candidate hypertension gene. Circ Res. 2007;100:992–999. doi: 10.1161/01.RES.0000261961.41889.9c. [DOI] [PMC free article] [PubMed] [Google Scholar]
- 22.McBride MW, Brosnan MJ, Mathers J, et al. Reduction of Gstm1 expression in the stroke-prone spontaneously hypertension rat contributes to increased oxidative stress. Hypertension. 2005;45:786–792. doi: 10.1161/01.HYP.0000154879.49245.39. [DOI] [PubMed] [Google Scholar]
- 23.Zhong JC, Huang DY, Yang YM, Li YF, Liu GF, Song XH, Du K. Upregulation of angiotensin-converting enzyme 2 by all-trans retinoic acid in spontaneously hypertensive rats. Hypertension. 2004;44:907–912. doi: 10.1161/01.HYP.0000146400.57221.74. [DOI] [PubMed] [Google Scholar]
- 24.Kurdi M, Cerutti C, Randon J, McGregor L, Bricca G. Macroarray analysis in the hypertrophic left ventricle of renin-dependent hypertensive rats: identification of target genes for renin. Renin Angiotensin Aldosterone Syst. 2004;5:72–78. doi: 10.3317/jraas.2004.013. [DOI] [PubMed] [Google Scholar]
- 25.Seubert JM, Xu F, Graves JP, et al. Differential renal gene expression in prehypertensive and hypertensive spontaneously hypertensive rats. Am J Renal Physiol. 2005;289:F552–F561. doi: 10.1152/ajprenal.00354.2004. [DOI] [PubMed] [Google Scholar]
- 26.Charchar FJ, Kaiser M, Bingham AJ, Fotinatos N, Ahmady F, Tomaszewski M, Samani NJ. Whole genome survey of copy number variation in the spontaneously hypertensive rat: relationship to quantitative trait loci, gene expression, and blood pressure. Hypertension. 2010;55:1231–1238. doi: 10.1161/HYPERTENSIONAHA.109.141663. [DOI] [PMC free article] [PubMed] [Google Scholar]
- 27.Simon R, Lam A, Li M-C, et al. Analysis of gene expression data using BRB-array tools. Cancer Informatics. 2007;3:11–17. [PMC free article] [PubMed] [Google Scholar]
- 28.Altschul SF, Thomas LM, Alejandro AS, et al. Gapped BLAST and PSI-BLAST: a new generation of protein database search programs. Nucleic Acids Res. 1977;25:3389–3402. doi: 10.1093/nar/25.17.3389. [DOI] [PMC free article] [PubMed] [Google Scholar]
- 29.Toal C, Leenen FH. Dietary sodium restriction and development of hypertension in spontaneously hypertensive rats. Am J Physiol. 1983;245:H1081–H1084. doi: 10.1152/ajpheart.1983.245.6.H1081. [DOI] [PubMed] [Google Scholar]
- 30.Wexler BC. Inhibition of the pathogenesis of spontaneous hypertension in spontaneously hypertensive rats by feeding a high fat diet. Endocrinology. 1981;108:981–989. doi: 10.1210/endo-108-3-981. [DOI] [PubMed] [Google Scholar]
- 31.Okamoto K, Ohta Y, Chikugo T, Shiokawa H, Morita N. Chronic treatment with captopril, SQ29,852, hydralazine and a 33% fish meal diet in malignant stroke-prone spontaneously hypertensive rats. J Hypertens. 1991;9:1105–1117. [PubMed] [Google Scholar]
- 32.Yamori Y. Implication of hypertensive rat models for primordial nutritional prevention of cardiovascular diseases. Clin Exp Pharmacol Physiol. 1999;26:568–572. doi: 10.1046/j.1440-1681.1999.03085.x. [DOI] [PubMed] [Google Scholar]
- 33.Pravenec M, Kurtz TW. Recent advances in genetics of the spontaneously hypertensive rat. Curr Hypertens Rep. 2010;12:5–9. doi: 10.1007/s11906-009-0083-9. [DOI] [PMC free article] [PubMed] [Google Scholar]
- 34.Cowley AW, Jr, Roman RJ, Jacob HJ. Application of chromosomal substitution techniques in gene-function discovery. J Physiol. 2004;554:46–55. doi: 10.1113/jphysiol.2003.052613. [DOI] [PMC free article] [PubMed] [Google Scholar]
- 35.Fornage M, Hinojos CA, Nurowska BW, Boerwinkle E, Hammock BD, Morisseau CHP, Doris PA. Polymorphism in soluble epoxide hydrolase and blood pressure in spontaneously hypertensive rats. Hypertension. 2002;40:485–490. doi: 10.1161/01.hyp.0000032278.75806.68. [DOI] [PubMed] [Google Scholar]
- 36.Corenblum MJ, Wise VE, Georgi K, Hammock BD, Doris PA, Fornage M. Altered soluble epoxide hydrolase gene expression and function and vascular disease risk in the stroke-prone spontaneously hypertensive rat. Hypertension. 2008;51:567–573. doi: 10.1161/HYPERTENSIONAHA.107.102160. [DOI] [PubMed] [Google Scholar]
- 37.Chiamvimonvat N, Ho CM, Tsai HJ, Hammock BD. The soluble epoxide hydrolase as a pharmaceutical target for hypertension. J Cardiovasc Pharmacol. 2007;50:225–237. doi: 10.1097/FJC.0b013e3181506445. [DOI] [PubMed] [Google Scholar]
- 38.Li J, Carroll MA, Chander PN, Falck JR, Sangras B, Stier CT. Soluble epoxide hydrolase inhibitor, AUDA, prevents early salt-sensitive hypertension. Front Biosci. 2008;13:3480–3487. doi: 10.2741/2942. [DOI] [PubMed] [Google Scholar]
- 39.Yousif MH, Benter IF. Role of 20-hydroxyeicosatetraenoic and epoxyeicosatrienoic acids in the regulation of vascular function in a model of hypertension and endothelial dysfunction. Pharmacology. 2010;86:149–156. doi: 10.1159/000317521. [DOI] [PubMed] [Google Scholar]