Abstract
The importance of spatial pattern in ecosystems has long been recognized. However, incorporating patchiness into our understanding of forces regulating ecosystems has proved challenging. We used a combination of continuously sampling moored sensors, complemented by shipboard sampling, to measure the temporal variation, abundance and vertical distribution of four trophic levels in Hawaii's near shore pelagic ecosystem. Using an analysis approach from trophic dynamics, we found that the frequency and intensity of spatial aggregations—rather than total biomass—in each step of a food chain involving phytoplankton, copepods, mesopelagic micronekton and spinner dolphins (Stenella longirostris) were the most significant predictors of variation in adjacent trophic levels. Patches of organisms had impacts disproportionate to the biomass of organisms within them. Our results are in accordance with resource limitation—mediated by patch dynamics—regulating structure at each trophic step in this ecosystem, as well as the foraging behaviour of the top predator. Because of their high degree of heterogeneity, ecosystem-level effects of patchiness such as this may be common in many pelagic marine systems.
Keywords: trophodynamics, patchiness, ecosystem regulation, bottom-up, top-down
1. Introduction
Understanding the relative roles of the biological and physical factors that control populations and communities is a central challenge in ecology. Trophic interactions, which in many systems determine distributions and abundances of organisms, are regulated by a combination of factors [1], including resources [2] and predators [3]. While some researchers have argued that environmental heterogeneity must be considered in assessing the relative roles of ecological forces [1,4], a widespread and fundamental ecosystem characteristic, patchiness, or the spatial variability in biomass at relatively small scales, has been difficult to incorporate in studies of these controls. We examined the relationships among four trophic levels that are found in distinct, extreme spatial aggregations [5,6] to examine the relative importance of biomass and patchiness in the regulation of a pelagic marine food web.
2. Material and methods
We measured the temporal variation, abundance and vertical distribution of organisms in Hawaii's near shore pelagic ecosystem from 20 April to 12 May 2009. Ship-based sampling with a downward-looking acoustics package and a high-resolution profiler instrumented with optical, acoustical and hydrographic sensors [5,7,8] was conducted close to continuously sampling instruments moored at the 25 m isobath off leeward Oahu over three, 24 h periods, as well as during four other days and nights dispersed over the study period. A moored autonomous profiler collected hydrographic and chlorophyll fluorescence data every half-hour between the bottom and the surface with less than 1 cm vertical resolution [7]. A calibrated, moored upward-looking 200, 420, 740 kHz echosounder collected acoustic backscatter once per second with a vertical resolution of 1 cm.
From the moored acoustic data, large scatterers with intense echoes at all frequencies were identified as spinner dolphins (Stenella longirostris) [9] and enumerated by echo counting to calculate their abundance. The degree of dolphin aggregation at night was quantified using short-term times-series autocorrelation analysis allowing lags of up to 5 min. The resulting coefficient ranges from zero, representing dolphins that are randomly distributed, to one representing highly periodic detections and thus highly aggregated dolphins. The 200 kHz volume backscatter was used to measure the density and vertical distribution of micronekton [8] that S. longirostris specialize in foraging on [10]. Net tows with an opening/closing 0.5 m diameter, 200 μm mesh net provided the identity of zooplankton in discrete aggregations. Differences in species composition in net tows were correlated with the frequency response in acoustic scattering: aggregations dominated by copepods had higher scattering at 740 kHz, whereas aggregations dominated by amphipods had higher scattering at 420 kHz. Acoustic scattering at 740 kHz was used to describe the vertical distribution of copepods, the preferred prey for the mesopelagic micronekton identified using the profiled camera system [8,11], and integrated to provide an estimate of copepod biomass.
Thin layers—intense, sheet-like aggregations—of plankton were detected in the moored datasets. Thin layers were identified as features with vertical scales of less than 2 m with intensities at least 50 per cent higher than the surrounding water column [12] using half-hour resolution data. For layers of plankton and micronekton, the peak intensity, layer thickness and mean density were calculated; and for plankton layers, their frequency of occurrence was calculated for each sampling day. The relationships between the biomass in each trophic level and individual layer characteristics were explored using correlation analysis. Each layer characteristic was also used as the dependent variable for multiple correlation analysis with the layer characteristics and biomass of the next lower trophic level as independent variables. Finally, all analyses were repeated to relate phytoplankton characteristics directly to spinner dolphins. Tolerance values for all independent variables were greater than 0.20 for each model, indicating no significant effect of multi-collinearity.
3. Results
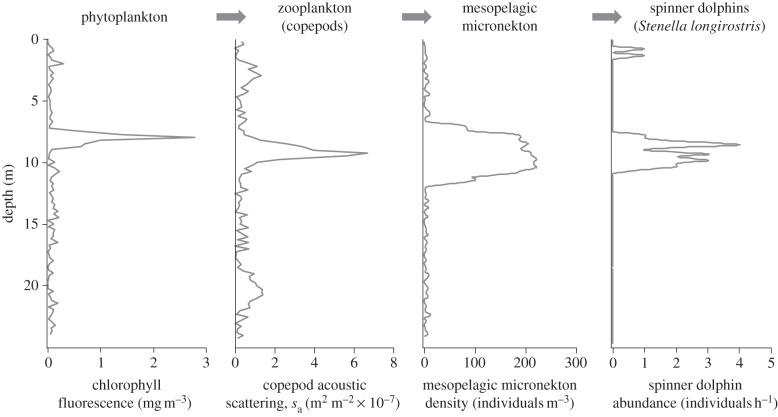
Thin layers of phytoplankton fluorescence (figure 1) were found in an average of 5 per cent of vertical profiles each day (range 0–20%). Thin layers of zooplankton in the copepod size range were found in an average of 15 per cent of profiles each day (range 7–33%). Plankton layer abundance was negatively correlated with integrated biomass for both trophic levels (phytoplankton r2 = 0.22; zooplankton r2 = 0.19). Mesopelagic micronekton, identified with the shipboard profiler cameras as primarily myctophid fishes, were found in a discrete, midwater sound-scattering layer [8]. The density of mesopelagic micronekton within this layer was negatively correlated with the total water-column abundance of mesopelagic micronekton (r2 = 0.41) because of concomitant changes in layer thickness.
Figure 1.
An example of the vertical distribution of each step in the food chain in Hawaii's near shore pelagic ecosystem measured at 2300 on 4 May 2009 using instruments moored on the 25 m isobath.
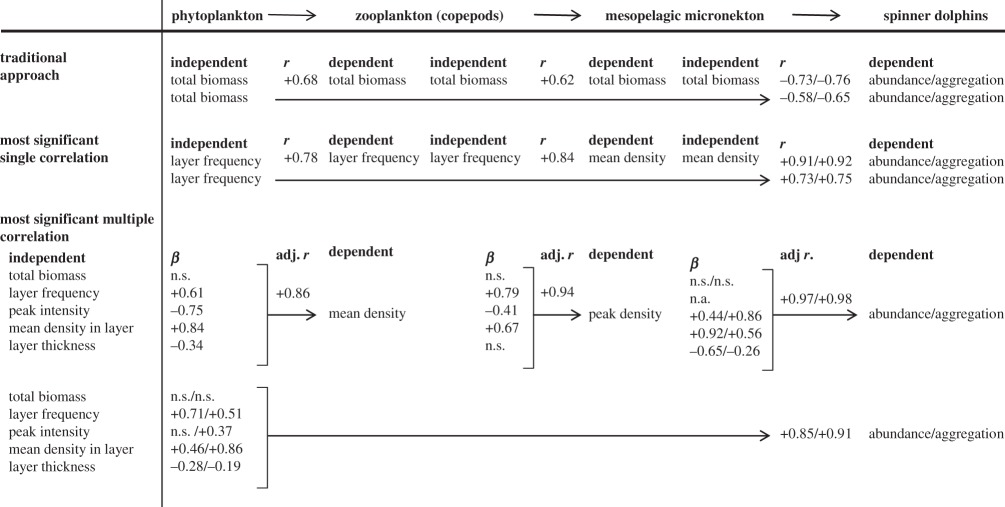
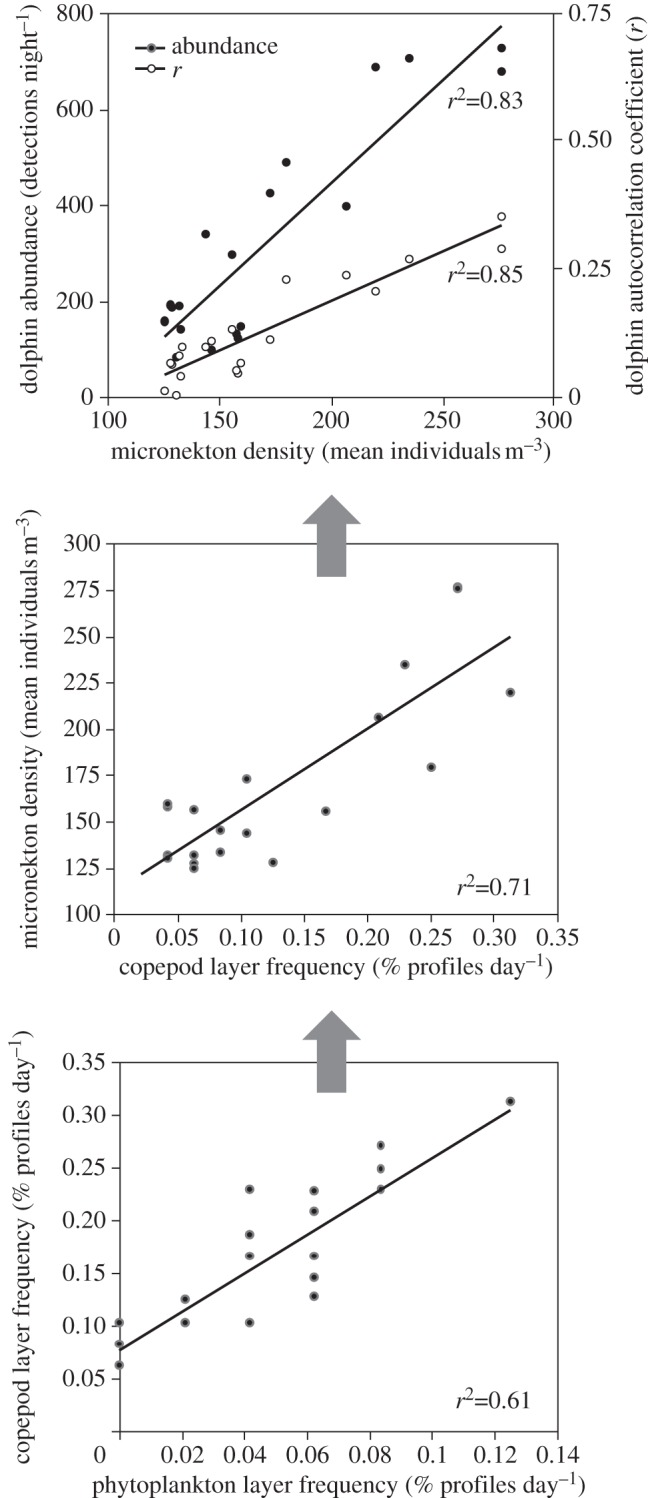
The strongest single correlations found between adjacent trophic levels were positive relationships between aggregation rates of consumers and their resources (table 1 and figure 2). These relationships were significantly stronger than the correlations of biomass between adjacent levels. Multiple correlation analysis showed that only patch characteristics contributed significantly to prediction of the next trophic level. While only the single most significant multiple correlation for each trophic level is shown in table 1, all possible dependent variables were examined, and in no case was biomass a significant predictor variable, even when biomass was the dependent variable.
Table 1.
Correlation coefficients (r2) describing the relationships between adjacent trophic levels in single and multiple correlations. Beta values indicate how strongly each predictor variable in the multiple correlation influences the dependent variable shown with ns indicating no significant contribution at p < 0.05 level; only the most strongly predicted dependent variable (highest r adjusted for the number of variables) is shown for each level.
 |
Figure 2.

The single strongest relationships between aggregation characteristics of adjacent steps in the food chain.
4. Discussion
In habitats where experimental manipulation of trophic levels is not possible, positive correlations in the standing biomasses of consumers and resources are used as evidence for regulation of the food web by food limitation [13]. Our results showing positive correlations between aggregations at adjacent levels in this pelagic food web support control of organisms at each step by their food, or a dominance of bottom-up forcing in this ecosystem, however, only if patchiness is considered. Similar analyses using the standing biomass of organisms, the typical approach to examining forcing of trophic relationships, showed that the biomasses of organisms at adjacent trophic levels were consistently more weakly correlated than aggregations of organisms, and in some cases were negatively correlated (table 1). Multiple correlation analysis showed biomass never became a significant predictor variable when patch characteristics were included as predictive variables, even when standing biomass was the dependent variable.
The abundance of spinner dolphins in the study site and their aggregation behaviour can be predicted based on the aggregation characteristics of phytoplankton to provide an estimate of the total strength of bottom-up effects because of the consistent positive correlations observed at each step of the food chain. While phytoplankton biomass was negatively correlated with dolphin abundance as well as aggregation intensity, and predicted only 34 per cent and 42 per cent of variability, respectively, the abundance of thin phytoplankton layers was positively correlated with both the abundance and aggregation intensity of spinner dolphins, explaining 54 per cent and 57 per cent of their variability, respectively. Using multiple, easily measured patch characteristics, predictive capacity was extremely high relative to studies examining only biomass (72% abundance; 83% aggregation) [14,15].
We observed that bottom-up effects explained increasingly more of the variability in consumer aggregations at increasingly higher trophic levels. This contrasts with previous efforts that suggest that resource limitation should have the greatest effects at the bottom of the food chain while control by predators should have a greater influence nearer the top of the food chain [13]. The difference might be explained by different effects of consumers and resources in open pelagic systems that are fully connected to the surrounding environment from those that can approach steady-state equilibria, particularly when considering temporal scales shorter than the reproductive scales of consumers, as in the short-term study described here [16]. At short time scales in open systems, changes in standing stocks of consumers are not primarily the result of changes in productivity, but are more likely the result of movement of organisms into and out of the study area. It is likely that the increasingly strong correlations we observed with movement up the food chain are associated with a parallel increase in the mobility of organisms [7,9,17], allowing tighter coupling between consumers and their prey through larger scale movements to find and better use food resources. Behavioural responses may also explain why the strength and frequency of aggregations of resources rather than their absolute biomass were observed to be strongly correlated with consumer as foraging success is often more strongly related to local prey density than total prey abundance [18,19].
Our data show that aggregations of organisms can have effects disproportionate to the biomass of organisms in them, revealing the role patch dynamics can play in the regulation of processes in a trophic web. In this system, patchiness increased the relative importance of resource limitation at all trophic levels. Ecosystem-level effects of patchiness such as this may be more common in pelagic marine systems, where both the habitat and the organisms that live in it show great spatial and temporal heterogeneity over a range of scales [20], and there is a great potential for movement, both passive and active, by consumers in relation to resource distribution. Recent evidence shows that heterogeneity of food is critical to predator survival and recruitment in the marine environment when food availability is low [21] and thus particular attention should be paid to patchiness whenever resource limitation is being investigated. Quantification of the processes that control organism abundances in marine systems is necessary for assessing ecosystem resilience, understanding the ecological impacts of fishing, effective management of exploited species, and prediction and mitigation of the impacts of climate change [22]. The finding that characteristics of organism distributions can dramatically modify how trophodynamics structure marine ecosystems improves our ability to predict populations, communities and the responses of ecosystems to short- and long-term environmental change.
Acknowledgements
We thank C. Waluk, J. Sevadjian, A. Timmerman, R. Timmerman, J. Eckman, J. Patterson, D. Bloedorm, D. Viviani, T. Cowles, C. Miller, M. Chapman of Mecco, Deap-Sea Power and Light, Captains J. Reich, T. Swenarton and T. Brown. We express our most sincere gratitude to D. V. Holliday for fostering the authors' collaboration. This work was funded by the US Office of Naval Research and conducted under US National Marine Fisheries Service Permit 1000-1617.
References
- 1.Hunter M. D., Price P. W. 1992. Playing chutes and ladders: heterogeneity and the relative roles of bottom-up and top-down forces in natural communities. Ecology 73, 724–732 [Google Scholar]
- 2.White T. 1978. The importance of a relative shortage of food in animal ecology. Oecologia 33, 71–86 10.1007/BF00376997 (doi:10.1007/BF00376997) [DOI] [PubMed] [Google Scholar]
- 3.Hairston N., Smith F., Slobodkin L. 1960. Community structure, population control, and competition. Am. Nat. 94, 421–424 10.1086/282146 (doi:10.1086/282146) [DOI] [Google Scholar]
- 4.Oksanen L., Fretwell S., Arruda J., Niemela P. 1981. Exploitation ecosystems in gradients of primary productivity. Am. Nat. 118, 240–261 10.1086/283817 (doi:10.1086/283817) [DOI] [Google Scholar]
- 5.Benoit-Bird K., Zirbel M., McManus M. 2008. Diel variation of zooplankton distributions in Hawaiian waters favors horizontal diel migration by midwater micronekton. Mar. Ecol. Prog. Ser. 367, 109–123 10.3354/meps07571 (doi:10.3354/meps07571) [DOI] [Google Scholar]
- 6.Benoit-Bird K. J., Au W. W. L. 2009. Cooperative prey herding by the pelagic dolphin, Stenella longirostris. J. Acoust. Soc. Am. 125, 125–137 10.1121/1.2967480 (doi:10.1121/1.2967480) [DOI] [PubMed] [Google Scholar]
- 7.McManus M. M., Benoit-Bird K. J., Woodson C. B. 2008. Behavior exceeds physical forcing in the diel horizontal migration of a midwater sound-scattering layer in Hawaiian waters. Mar. Ecol. Prog. Ser. 365, 91–101 10.3354/meps07491 (doi:10.3354/meps07491) [DOI] [Google Scholar]
- 8.Benoit-Bird K. J., Au W. W. L. 2006. Extreme diel horizontal migrations by a tropical nearshore resident micronekton community. Mar. Ecol. Prog. Ser. 319, 1–14 10.3354/meps319001 (doi:10.3354/meps319001) [DOI] [Google Scholar]
- 9.Benoit-Bird K. J., Au W. W. L. 2003. Prey dynamics affect foraging by a pelagic predator (Stenella longirostris) over a range of spatial and temporal scales. Behav. Ecol. Sociobiol. 53, 364–373 10.1007/S00265-003-0585-4 (doi:10.1007/S00265-003-0585-4) [DOI] [Google Scholar]
- 10.Norris K. S., Dohl T. P. 1980. Behavior of the Hawaiian spinner dolphin, Stenella longirostris. Fish Bull. 77, 821–849 [Google Scholar]
- 11.Clarke T. A. 1980. Diets of fourteen species of vertically migrating mesopelagic fishes in Hawaiian waters. Fish Bull. 78, 619–640 [Google Scholar]
- 12.Dekshenieks M. M., Donaghay P. L., Sullivan J. M., Rines J. E. B., Osborn T. R., Twardowski M. S. 2001. Temporal and spatial occurrence of phytoplankton thin layers in relation to physical processes. Mar. Ecol. Prog. Ser. 223, 61–71 10.3354/meps223061 (doi:10.3354/meps223061) [DOI] [Google Scholar]
- 13.McQueen D., Post J., Mills E. 1986. Trophic relationships in freshwater pelagic ecosystems. Can. J. Fish Aquat. Sci. 43, 1571–1581 10.1139/f86-195 (doi:10.1139/f86-195) [DOI] [Google Scholar]
- 14.Schindler D. W. 1978. Factors regulating phytoplankton production and standing crop in the world's fresh waters. Limnol. Oceanogr. 23, 478–486 10.4319/lo.1978.23.3.0478 (doi:10.4319/lo.1978.23.3.0478) [DOI] [Google Scholar]
- 15.Ware D., Thomson R. 2005. Bottom-up ecosystem trophic dynamics determine fish production in the northeast Pacific. Science 308, 1280–1284 10.1126/science.1109049 (doi:10.1126/science.1109049) [DOI] [PubMed] [Google Scholar]
- 16.Nisbet R., Diehl S., Wilson W., Cooper S., Donalson D., Kratz K. 1997. Primary-productivity gradients and short-term population dynamics in open systems. Ecol. Monogr. 67, 535–553 10.1890/0012-9615(1997)067[0535:PPGAST]2.0.CO;2 (doi:10.1890/0012-9615(1997)067[0535:PPGAST]2.0.CO;2) [DOI] [Google Scholar]
- 17.Benoit-Bird K. J., Zirbel M. J., McManus M. M. 2008. Diel variation of zooplankton distributions in Hawaiian waters favors horizontal diel migration by midwater micronekton. Mar. Ecol. Prog. Ser. 367, 109–123 10.3354/meps07571 (doi:10.3354/meps07571) [DOI] [Google Scholar]
- 18.Boyd I. I. 1996. Temporal scales of foraging in a marine predator. Ecol. 77, 426–434 10.2307/2265619 (doi:10.2307/2265619) [DOI] [Google Scholar]
- 19.Tiselius P., Jonsson P. R., Verity P. G. 1993. A model evaluation of the impact of food patchiness on foraging strategy and predation risk in zooplankton. Bull. Mar. Sci. 53, 247–264 [Google Scholar]
- 20.Steele J. H. 1976. Patchiness. In The ecology of the seas (eds Cushing D. H., Walsh J. J.), pp. 98–115 Philadelphia, PA: W.B. Saunders Company [Google Scholar]
- 21.Holliday D., Greenlaw C., Donaghay P. 2010. Acoustic scattering in the coastal ocean at Monterey Bay, CA, USA: fine-scale vertical structures. Cont. Shelf Res. 30, 81–103 10.1016/j.csr.2009.08.019 (doi:10.1016/j.csr.2009.08.019) [DOI] [Google Scholar]
- 22.Hunt G., McKinnell S. 2006. Interplay between top-down, bottom-up, and wasp-waist control in marine ecosystems. Prog. Oceanogr. 68, 115–124 10.1016/j.pocean.2006.02.008 (doi:10.1016/j.pocean.2006.02.008) [DOI] [Google Scholar]


