

Abstract
The striking diversity of sperm shape across the animal kingdom is still poorly understood. Postcopulatory sexual selection is an important factor driving the evolution of sperm size and shape. Interestingly, morphometric sperm traits, such as the length of the head, midpiece and flagellum, exhibit a strong positive phenotypic correlation across species. Here we used recently developed comparative methods to investigate how such phenotypic correlations between morphometric sperm traits may evolve. We compare allometric relationships and evolutionary trajectories of three morphometric sperm traits (length of head, midpiece and flagellum) in passerine birds. We show that these traits exhibit strong phenotypic correlations but that allometry varies across families. In addition, the evolutionary trajectories of the midpiece and flagellum are similar while the trajectory for head length differs. We discuss our findings in the light of three scenarios accounting for correlated trait evolution: (i) genetic correlation; (ii) concerted response to selection acting simultaneously on different traits; and (iii) phenotypic correlation between traits driven by mechanistic constraints owing to selection on sperm performance. Our results suggest that concerted response to selection is the most likely explanation for the phenotypic correlation between morphometric sperm traits.
Keywords: trait coevolution, correlated traits, allometry, sperm morphometry, comparative methods
1. Introduction
The evolutionary causes and consequences of the remarkable diversity of spermatozoa are still poorly understood [1,2]. Morphometric sperm traits such as overall sperm length, midpiece length/volume and flagellum length (but not sperm head length) appear to be under postcopulatory sexual selection owing to varying risk of sperm competition (e.g. [3–10]; but see [11]) and cryptic female choice [12,13]. Interestingly, morphometric sperm traits show a strong positive phenotypic correlation across species: in mammals for example, the size of the midpiece and the size of the flagellum are significantly positively correlated (r = 0.44; [14,15]) as are head length and flagellum length (r = 0.56; [15]). Similarly, in passerine birds and in pheasants, midpiece length and flagellum length are strongly positively correlated (passerine birds: r = 0.84 [10], r = 0.97 [16]; pheasants: r = 0.78 [17]), suggesting that these traits show correlated evolution. However, the causes underlying this apparent correlated evolution are poorly understood. There are three non-exclusive scenarios that may lead to correlated evolution of two traits: (i) underlying genetic correlation [18], (ii) concerted response to selection acting simultaneously on different traits [19,20], and/or (iii) extrinsic functional or intrinsic mechanistic constraints [21], which may result in a positive/negative phenotypic correlation between traits.
To date, little is known about the genetic correlation between morphometric sperm traits. Nevertheless, the few existing empirical studies of the genetic architecture of sperm traits suggest that sperm are not a genetic unit but that sperm morphometric traits should be regarded as independent. In the house mouse Mus musculus for example, selection on the length of the midpiece did not result in a proportional change in the length of the principal piece of the flagellum [22]. A recent experimental study of the Gouldian finch Erythrura gouldiae showed a differential response of individual sperm traits to changes in the social environment with midpiece length increasing in response to higher levels of aggression and stress, and flagellum length increasing in a more ‘relaxed’ environment [23]. Whether these differential responses to selection are adaptive remains to be tested. Nevertheless, genetic correlations between morphometric sperm traits have been demonstrated. In the zebra finch Taeniopygia guttata, sperm traits such as the length of the head, midpiece and flagellum are highly heritable with strong additive genetic effects on all traits, and indirect, maternal genetic effects on midpiece and flagellum length [24]. In addition, a negative genetic correlation exists between both additive and maternal genetic effects on the midpiece and flagellum, which suggests that the alleles of these two traits are either antagonistically pleiotropic or in linkage disequilibrium. A potential biological consequence of this negative genetic correlation is that while paternal genes may make a longer flagellum, maternal genes may make a shorter midpiece [24]. Nevertheless, negative genetic correlations do not preclude a positive phenotypic correlation between traits [25].
Selection may also act on multiple morphometric sperm traits in concert, resulting in strong phenotypic correlations. Under this scenario, one would expect traits to be more strongly correlated in species in which selection is stronger. Comparative studies of passerine birds show that intraspecific variation in several sperm traits, including midpiece and flagellum length, decreases with increasing risk of sperm competition [26,27]. Furthermore, traits have been found to show strong phenotypic correlations across species [10,15] but patterns within species may vary considerably [24,28]. It is therefore possible that sperm traits coevolve owing to a concerted response to selection.
Finally, a strong phenotypic correlation between two traits may occur owing to evolutionary constraints. Such constraints may be extrinsic, in which case selection acts on a functional sperm trait (e.g. sperm swimming velocity), which in turn may select for an optimal size ratio between two morphometric traits. Physical conditions such as the drag in the swimming medium may constrain the evolution of the size of the head in relation to the flagellum [29]. Similarly, an increase in flagellum length may require a proportional increase in midpiece size to maintain a constant metabolic turn-over [14]. A recent study across African cichlids showed that sperm probably first evolved to be faster and subsequently to be longer [30]. The authors suggest that selection acted predominantly on sperm energetics (i.e. ATP production), which subsequently may have altered sperm morphometry in an adaptive process: To increase ATP output, sperm might have evolved a larger midpiece, independently of overall sperm length. In a second step, the increase in energetic output may have allowed for the evolution of a longer flagellum (and hence longer overall sperm). Constraints may also be intrinsic if one trait creates mechanistic (spatial) constraints for another trait [31]. Since in the majority of passerine birds, the midpiece is relatively long and forms a helix twisted around the flagellum (distinguishing it from many other vertebrate sperm; [32–34]), the length of the flagellum limits the length of the midpiece. In both scenarios (intrinsic or extrinsic forces), allometry can act as a constraint reducing evolutionary divergence [31].
One way to improve our understanding of the nature of correlated evolution between morphometric sperm traits is to use recently developed comparative methods, which estimate and compare the evolutionary pathways of individual traits [35–39]. We used passerine birds as a study system and estimated the evolutionary trajectories of three sperm traits (length of the head, midpiece and flagellum), which are positively correlated across passerine species [10]. In addition, we assessed the allometry between these three traits within six families of passerine birds and compared the regression slopes and the sign of the allometry across these families. It is important to note that all three scenarios described above may result in a phenotypic correlation even if these traits have no common function. However, it is possible to make predictions for each scenario for distinct patterns regarding the evolutionary pathways and the nature of the allometry between these traits across different taxonomic groups: (i) Variation in the underlying genetic architecture should lead to variation in the evolutionary trajectories among traits and to variation in the allometry between traits across families. (ii) Concerted response to selection would lead to similar evolutionary trajectories of different traits, and overall similar correlations across families although the sign of the allometry and the slopes may vary. (iii) If extrinsic functional constraints are driving the coevolution of sperm traits, we would expect similar trajectories and no variation in the sign of allometry but slopes may still vary across families. In contrast, if the constraints were of an intrinsic mechanistic nature, we would expect no variation in sign of allometry and slopes.
2. Material and methods
(a). Data
We used data on sperm trait dimensions for 217 species of passerine birds belonging to 36 families (see the electronic supplementary material, table S1). Parts of this dataset have already been published [16,40]. Sample sizes per species ranged from one to 236, and for 78 species, we obtained sperm from at least five males. Sperm were collected from males during the breeding season using three different techniques: (i) from faecal samples [41], (ii) by dissection of the seminal glomera (under licence), and (iii) by cloacal massage [42]. Sampling methods were employed arbitrarily across males and species and often, more than one sampling method was employed for the same species. Importantly, sperm collected by different techniques do not significantly differ in their morphometrics [41,24]. Sperm samples were fixed in 200 µl of 5 per cent buffered (in phosphate-buffered saline solution) formalin solution (100% formalin = 40% formaldehyde). For examination of sperm traits, a subsample of 10 µl was placed on a microscope slide and covered with a coverslip. Digital images were taken at 250× or 400× magnification using light microscopy. Sperm traits were measured using the image analysis software IM50 from Leica. Passerine sperm have a very typical bauplan, which is characterized by a helically shaped head, a long flagellum starting at the caudal end of the head and an elongate midpiece that is twisted around the flagellum [33,34]. The lengths of the sperm head, midpiece helix and flagellum were measured to the nearest 0.1 µm, and the number of helical turns of the midpiece was counted. The straight helix length of the midpiece (SHL, hereafter referred to simply as midpiece) was calculated using the formula: 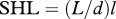 , where
 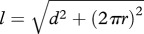 ,
,  , L is the length of the midpiece helix (as measured), N is the number of the helical turns and r is the radius from the centre of the sperm flagellum to the centre of the midpiece helix [24].
Five sperm were measured for each male, which captures most of the intra-male variation, provides an accurate mean per male and allows detecting significant differences between males [17,24] (see the electronic supplementary material, table S3).
(b). Phylogeny
A phylogenetic topology was constructed using published phylogenetic trees (see the electronic supplementary material for references). If published phylogenetic trees conflicted, we chose the most recent tree to construct our topology. Owing to the use of different methods in the different studies, branch lengths were not comparable across different published phylogenies. We therefore estimated maximum-likelihood branch lengths in a second step based on sequences from five mitochondrial genes (cytb, nadh1, nadh2, coi, rag1) downloaded from GenBank (kindly provided by G. Thomas) using the software PAUP* v. 4.10d122 for Macintosh [43]. State frequencies were estimated via maximum likelihood with a general time-reversible nucleotide substitution model. The heterogeneity of nucleotide substitution rates among sites was approximated by a gamma distribution (G) and an assumption of invariable sites (I). For subsequent comparative analyses, we converted the tree to an ultrametric tree (a tree with equal root-to-tip path lengths for all lineages) by applying non-parametric rate smoothing using the package ape [44] in R v. 2.10.0 [45].
(c). Comparative analyses of evolutionary rate for individual traits
In a first step, we performed analyses between sperm traits (head length, midpiece and flagellum length) within six passerine families using the PGLM approach [46] based on a script written by R. Freckleton for the statistical programming language R v. 2.10.0 [45]. We subsequently calculated the reduced major axis (RMA) regression slopes to obtain the correct slopes for estimating allometry and to compare slopes between families. Since RMA slopes in phylogenetically controlled analyses may be an overestimation of the actual relationship [47], we also present least-squares (LS) slopes. Because a post hoc Bonferroni correction bears an increased risk of type II errors, particularly with smaller sample sizes [48], we present the effect sizes for all correlations between traits (see the electronic supplementary material, table S4).
To estimate the evolutionary patterns of individual traits, we used four different analytical tools: (i) the morphological diversity index (MDI; [35]), (ii) a maximum-likelihood estimate of the phylogenetic parameter λ (lambda; [46]), (iii) a maximum-likelihood estimate of correlated evolution [39], and (iv) the potential occurrence of ‘early bursts’ [49]. These methods estimate the divergence of the evolutionary pattern of morphological traits from a model based on Brownian motion. All methods are described in detail elsewhere [36,38,39,46,49], so we provide only a short description of the individual methods (see the electronic supplementary material). To perform the analyses, we used the package Geiger [50] following Harmon et al. [35] and Gonzalez-Voyer et al. [37] and a script kindly provided by L. Revell for R. For all analyses, we used ln-transformed data.
Estimating a species value based on only one individual per species may increase the risks of type I and type II errors [51]. To address this potential problem, we chose species for which the mean was based on five or more males per species (n = 78) and re-estimated MDI [35], the phylogenetic parameter λ (lambda; [46]) and the maximum-likelihood estimate of correlated evolution [39] for this subset of our data. In addition, we performed ANOVAs to estimate for across-species versus within-species variation [51], which suggests that across-species variation is much higher (see the electronic supplementary material, table S3).
3. Results
(a). Correlation
The three traits all covaried positively. Across all species and also within most of the six focal families, sperm head length was significantly positively correlated with midpiece length (RMA slope ± s.e.: 0.24 ± 0.01 (LS slope: 0.14), t215 = 10.70, p < 0.001, R2 = 0.35, λ = 0.86) and flagellum length (0.37 ± 0.02, t215 = 8.40, p < 0.0001, R2 = 0.25, λ = 0.75; table 1). In addition, the association between midpiece and flagellum length was significant across all species as well as within all six families (RMA: 1.43 ± 0.05 (LS: 1.22), t215 = 24.20, p < 0.0001, R2 = 0.73, λ = 0.99; table 1). R2 and λ were obtained from the PGLM regression models. Subsequent pairwise comparisons between families indicated significant differences of the RMA slopes but not of the sign of allometry, i.e. the allometry was consistently positive (table 1).
Table 1.
Relationships between morphometric sperm traits within passerine families. Sample size (n), least-squares slope (LS slope) and standard error of slope (s.e.), R2 and t-value for PGLM regression are presented. RMA regression slopes were compared with slope = 1 (t for slope = 1) and among families (t for each family pair). Asterisks next to t-values indicate significance levels. *p < 0.05, **p < 0.005.
| n | LS slope | RMA slope | s.e. | R2t | t | slope = 1 (t) | Sylviidae (t) | Fringillidae (t) | Emberizidae (t) | Estrildidae (t) | Parulidae (t) | |
|---|---|---|---|---|---|---|---|---|---|---|---|---|
| Head–midpiece | ||||||||||||
| Sylviidae | 25 | 0.09 | 0.32 | 0.06 | 0.08 | 1.42 | 11.33** | |||||
| Fringillidae | 16 | 0.25 | 0.26 | 0.02 | 0.90 | 10.99** | 37.00** | 0.95 | ||||
| Emberizidae | 17 | 0.40 | 0.47 | 0.07 | 0.72 | 6.19** | 7.57** | 1.63 | 2.91* | |||
| Estrildidae | 22 | 0.15 | 0.23 | 0.04 | 0.43 | 3.90** | 19.25** | 1.25 | 0.67 | 2.96* | ||
| Parulidae | 30 | 0.41 | 0.55 | 0.07 | 0.55 | 5.86** | 6.43** | 2.50* | 4.03** | 0.81 | 3.95 | |
| Icteridae | 32 | 0.14 | 0.28 | 0.04 | 0.25 | 3.16** | 18.00** | 0.56 | 0.27 | 2.35* | 0.88 | 3.33** |
| head–flagellum | ||||||||||||
| Sylviidae | 25 | 0.24 | 0.76 | 0.15 | 0.10 | 1.58 | 1.60 | |||||
| Fringillidae | 16 | 0.66 | 0.81 | 0.12 | 0.67 | 5.39** | 1.58 | 0.26 | ||||
| Emberizidae | 17 | 0.44 | 0.53 | 0.08 | 0.69 | 5.8** | 5.88** | 1.35 | 2.00 | |||
| Estrildidae | 22 | 0.32 | 0.75 | 0.15 | 0.18 | 2.12* | 1.67 | 0.05 | 0.32 | 1.29 | ||
| Parulidae | 30 | 0.42 | 0.79 | 0.07 | 0.28 | 5.67** | 3.00** | 0.19 | 0.14 | 2.36* | 0.24 | |
| Icteridae | 32 | 0.21 | 0.40 | 0.07 | 0.28 | 3.15** | 8.57** | 2.25* | 2.93** | 1.18 | 2.06* | 3.98** |
| midpiece–flagellum | ||||||||||||
| Sylviidae | 25 | 2.29 | 2.58 | 0.25 | 0.79 | 9.31** | 6.32** | |||||
| Fringillidae | 16 | 1.20 | 1.27 | 0.11 | 0.89 | 10.49** | 2.46** | 4.85** | ||||
| Emberizidae | 17 | 1.11 | 1.12 | 0.02 | 0.99 | 64.33** | 6.00** | 5.84** | 1.36 | |||
| Estrildidae | 22 | 3.07 | 3.29 | 0.27 | 0.87 | 11.45** | 8.48** | 1.92 | 6.97** | 8.04** | ||
| Parulidae | 30 | 1.06 | 1.06 | 0.01 | 0.99 | 104.99** | 6.00** | 4.11** | 1.91 | 2.73* | 8.26** | |
| Icteridae | 32 | 1.40 | 1.46 | 0.08 | 0.92 | 18.44** | 5.75** | 4.31** | 1.36 | 4.15** | 6.54** | 4.94** |
(b). Disparity
The evolutionary pathway of all three sperm traits departed significantly from Brownian motion, and the pathways of the individual traits differed markedly between each other (figure 1 and table 2). When including all species, the MDI value was greater than zero for all three traits and smallest for flagellum length. The MDI values for the analyses including all species and analyses including species with at least five individuals were very similar (table 2). The departure of evolutionary pathways from Brownian motion was significant for all three traits when comparing the Brownian motion model with the lambda model (table 2). The intermediate to high values of the parameter λ suggest that all three traits covary considerably in proportion to their shared ancestry (table 2).
Figure 1.

Morphological disparity of the observed evolutionary pathway (solid line) and Brownian motion (broken line) of three morphometric sperm traits, head length (a,d), midpiece length (b,e) and flagellum (c,f), in passerine birds based on all 217 species (a–c) and on 78 species for which at least five individuals per species were measured (e–g). The position of the observed pathway compared with the line representing Brownian motion provides information about the rate of diversification of a trait over time (MDI). Note that the MDI estimates in table 2 were based on the disparity from 0 to 0.8 along the time line of the tree as missing species may provide false estimates of diversification towards the tips of the tree.
Table 2.
Comparison of three evolutionary rate models with Brownian motion. Morphological disparity index (MDI) and maximum-likelihood estimates (lnLH) for the λ-statistic for sperm head length, midpiece length and flagellum length including all families and families with five or more males per species. p-Values were obtained from likelihood ratio tests comparing lambda and early burst (EB) models with Brownian motion.
| trait | MDI ± s.d. | Brownian | lambda |
EB |
|||
|---|---|---|---|---|---|---|---|
| lnLH | λ | lnLH | p | lnLH | p | ||
| all families | |||||||
| head | 0.56 ± 0.05 | 42.09 | 0.43 | 307.94 | <0.001 | 42.09 | n.s. |
| midpiece | 0.48 ± 0.05 | −229.69 | 0.91 | −30.92 | <0.001 | −229.69 | n.s. |
| flagellum | 0.30 ± 0.05 | −125.96 | 0.86 | 92.72 | <0.001 | −125.96 | n.s. |
| families with five or more males per species | |||||||
| head | 0.55 ± 0.08 | −23.27 | 0.25 | 32.52 | <0.001 | −23.27 | n.s. |
| midpiece | 0.28 ± 0.07 | −316.41 | 0.99 | −84.20 | <0.001 | −140.96 | n.s. |
| flagellum | 0.30 ± 0.08 | −104.03 | 0.99 | −35.52 | <0.001 | −90.67 | n.s. |
The MDI value can be calculated based on a proportion of the length of the tree, where the root is zero and the tips are one. Since the species coverage is not complete, we calculated the MDI excluding part of the tree towards the tips because at the tips comparisons do not involve sister taxa and hence the observed disparity will be overestimated [35,37]. Given that the tree has a high concentration of speciation events towards the tips (and thus long inner branches), taking a proportion of 0.9 (90%) of the total tree length is justified because this way part of the recent events is omitted. For trees without such a structure, a lower proportion would be justified.
The comparison of the EB model with the Brownian motion model did not reveal the existence of any early burst in any of the three traits (table 2). The trajectories between the analyses including all species and the one including species with five males or more are very similar. This is confirmed by relatively similar MDI values (table 2). The important result here is that the observed disparities of the three traits suggest that the covariance between traits changes over evolutionary time, and in particular that the trajectory of sperm head length differs from the trajectories of the other two traits.
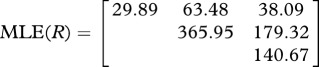
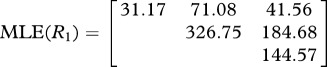
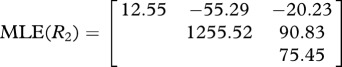
There are significant, non-proportional shifts in the evolutionary rate matrices between the three traits. The one-rate matrix null hypothesis was rejected compared with the two-rate matrix when evaluated against the χ2 distribution with four degrees of freedom (table 3). This result confirms the observations from the MDI plots that the evolutionary covariances between the traits have changed over evolutionary time. The evolutionary correlations between traits were weaker in the subclade consisting of more ancient taxa (e.g. Tyrannidae, Maluridae and Corvidae as the two-rate matrix model R2 in table 3) compared with the more modern passerines (e.g. Icteridae, Parulidae, Emberizidae, Sylviidae and Fringillidae as the two-rate matrix model R1 in table 3).
Table 3.
Comparison of one-rate and two-rate matrices to estimate the evolutionary correlation between three morphometric sperm traits. The evolutionary correlation coefficient r, log-likelihood (lnL) and AIC for the two models are shown.
| model | correlated traits | r | lnL | AIC |
|---|---|---|---|---|
| one-matrix model | ||||
 |
head–midpiece | 0.61 | −1286.7 | 2601.4 |
| head–flagellum | 0.59 | |||
| midpiece–flagellum | 0.79 | |||
| two-matrix model | ||||
 |
head–midpiece | 0.70 | −1229.9 | 2507.8 |
| head–flagellum | 0.62 | |||
| midpiece–flagellum | 0.85 | |||
 |
head–midpiece | −0.44 | ||
| head–flagellum | −0.66 | |||
| midpiece–flagellum | 0.30 | |||
| likelihood-ratio test | ||||
| −2 log(L1/L2)=168.1 | p(χ2, d.f. = 3) <0.0001 | |||
4. Discussion
In passerine birds, the correlations between the three examined sperm traits were significantly positive across all species, as well as within six families, confirming earlier results [10,16]. Although the slopes differed significantly, the allometry was consistently positive between the length of the midpiece and the flagellum. The evolutionary trajectories of three sperm traits departed significantly from Brownian motion. One possible explanation for this deviation is response to selection. Furthermore, the trajectories of the three traits also differed among each other: disparity of head length appears to be relatively high throughout, whereas disparities of midpiece and flagellum length exhibit more variation across evolutionary times and differ from the model of Brownian motion, which may indicate a response to selection over evolutionary time. We discuss the implications of our findings in the light of the three scenarios that can account for strong phenotypic correlations between traits: (i) genetic correlations, (ii) concerted response to selection, and (iii) extrinsic functional or intrinsic mechanistic constraints.
(a). Genetic architecture of sperm morphometry
The observed difference in the evolutionary trajectories particularly between head length and the other two traits in combination with the non-proportional shifts implied by the two-rate matrix hypothesis suggests sperm should not be regarded as an integrated selective unit but that morphometric sperm traits vary in their genetic architecture and may evolve independently. Our results support findings of intraspecific studies in house mice where selection on midpiece size did not affect the length of the flagellum [22], but also of a study on quantitative genetics of sperm morphometry in the zebra finch [24].
(b). Concerted response to selection
The finding that the evolutionary trajectories of the three sperm traits differed significantly from evolutionary pathways following Brownian motion confirms the empirical evidence of previous studies that sperm traits are under (postcopulatory sexual) selection (reviewed in [2]). However, the similarity between the evolutionary trajectories between midpiece and flagellum length confirms that these two traits appear to respond in a similar way to selection, supporting the findings of previous studies: whereas the size of the midpiece and flagellum has been shown to be associated with the risk of sperm competition in several taxa ([8,10,17]; but see [11]), the response of the sperm head appears to be more complex. In murid rodents for example, sperm competition appears to mainly drive the evolution of the shape and angle of the apical hook [17]. In passerine birds, to date no evidence exists that sperm head length is associated with the risk of sperm competition [10], but a more detailed study of sperm head shape may reveal new insights.
The idea that selection may act simultaneously on several traits and cause a concerted response is intuitive, given the importance of sperm for male fitness. However, the empirical evidence for concerted response to selection of morphometric sperm traits is limited to date (see [52] for review). A study of the house mouse revealed no differences in sperm morphometry between polyandrous and monogamous lines [53]. However, as supported by our results, if we consider a wider range of sperm and ejaculate traits, postcopulatory sexual selection may cause concerted responses in several traits (see also [54,55]).
(c). Intrinsic mechanistic and extrinsic functional constraints
Consistent allometry between traits is thought to be a strong indicator for a mechanistic link between traits [21,31]. The allometry between midpiece length and flagellum length was consistently positive, both across all species and within the six families (see also [10]), indicating that longer sperm generally have a relatively longer midpiece. Furthermore, the relationship between midpiece length and flagellum length was very strong (R2 values ranging between 0.78 in Sylviidae and 0.99 in the Parulidae). However, the regression slopes of the relationships between traits differed significantly across families. The combination of these results suggests that the constraint is unlikely to be of intrinsic mechanistic nature (e.g. a stabilizing function of the midpiece wrapped around the flagellum [56]) but most probably owing to extrinsic factors selecting on physical and metabolic sperm performance, which leads to the coevolution of these two traits. The importance of the relative size of midpiece and flagellum length for the metabolic rate of sperm [14] and therefore sperm performance [56] is likely to drive the coevolution of midpiece size and flagellum length.
One possible explanation for the variation in slopes across families may be that relative midpiece size plays an important role in determining sperm longevity [15]. In mammals, the negative allometric relationship between the midpiece and the flagellum, in combination with the increased metabolic rate of longer sperm, may cause reduced lifespan of longer sperm [14,15,57]. Despite the positive allometry observed in passerine bird sperm, some preliminary data suggest that the longer midpiece of longer sperm is associated with a reduction in sperm lifespan ([58,59]; S. Immler 2009, unpublished data). In addition, in pheasants, where the midpiece and flagellum also show positive allometry, midpiece size is negatively associated with sperm storage duration [17]. This is interesting as the basic bauplan of non-passerine avian sperm (including pheasants) is very different from that of passerine sperm and more similar to other vertebrate sperm [34]. The difference in allometry between mammals and birds may have evolved owing to a fundamental difference in the reproductive biology between these two taxonomic groups: in birds, females store sperm for up to several weeks between insemination and fertilization [60], whereas in mammals, sperm remain functional within the female tract for only a few days (with the exception of bats; [61,62]). Similarly, the observed variations in the slope for the relationship between midpiece and flagellum length across passerine families might hint at differences in sperm storage duration between families, possibly related to differences in female copulatory behaviour with respect to the timing of egg laying [63].
The relationship between head length and the other two traits, although generally significantly positive, was much weaker and more variable (R2 varying from 0.25 in Icteridae to 0.75 in Fringillidae). In addition, the slopes for the relationships between the head and both the midpiece and flagellum generally did not differ among families—with the exception of the Icteridae. One possible explanation for the lack of any significant differences between slopes may be that the correlations are not strong enough to detect differences at these sample sizes. Alternatively, the ratio of head length to the other two traits may be vital for mechanistic performances such as swimming speed [29,64], and hence the evolutionary constraints for this ratio are strong.
It is important to note that the tight relationship between morphometric sperm traits across species contrasts with the patterns observed at the intraspecific level. The relationship between midpiece and flagellum length shows marked variation at the intraspecific level, and seems to be almost non-existent for example in the zebra finch (r = −0.17; [24,65]), while it is rather strong in the dunnock Prunella modularis (−0.70; S. Calhim 2009, personal communication; see also [66]). Phenotypic plasticity of sperm traits may be a possible explanation for this variation across taxonomic levels, as the variable plasticity of sperm traits may disguise patterns at the intraspecific level [23,67], which are very obvious at the interspecific level. This fact certainly highlights that general conclusions about evolutionary patterns based on studies at only one taxonomic level may be misleading.
As already stated, passerine sperm are distinct from many other vertebrate sperm in that they typically possess a helically shaped head, and a helical midpiece, which seems to facilitate their progressive cork-screw-like motion [32–34,68]. Owing to variation in shape and method of locomotion across vertebrate sperm (and even more so in invertebrate sperm [69]), it is difficult to establish whether our findings apply to other taxonomic groups with distinct sperm morphometry. It is also important to recognize that sperm metabolic pathways may differ considerably between taxa [70–72], which in turn may influence the evolution of morphometric traits. This leaves two important aims for future investigations: (i) Further studies of the evolutionary pathways of individual sperm traits in other taxonomic groups (both vertebrates and invertebrates) will improve our understanding of the evolution of sperm as a whole and of the evolution of individual traits. (ii) Mechanisms underlying sperm metabolism will help us to understand how sperm shape and performance coevolve.
5. Conclusions
Given that sperm are generally regarded as a single entity selected for optimal performance, our finding that evolutionary rates of individual morphometric sperm traits vary over time and that these traits differ in their evolutionary trajectories as well as in their allometric relationship across families is interesting. While postcopulatory mechanisms are a major force driving the evolution of sperm morphometry [1,2], individual sperm traits appear to exhibit correlated evolution as a result of concerted selection rather than genetic correlation(s) or extrinsic mechanistic limitations. In addition, our results highlight the importance of investigating the coevolution of traits within and across taxonomic groups of relatively closely related species. The variation across groups provides valuable insight into the evolutionary patterns associated with specific traits. It would be interesting to perform similar studies in other taxa (mammals, fishes and insects) in order to be able to draw more general conclusions about the evolution of sperm shape and performance.
Acknowledgements
We are particularly grateful to all of our colleagues who collected samples for us, especially Sara Calhim, Kate Durrant, Sean Fitzpatrick, Stefan Lüpold, Claire Spottiswoode and Chris Wood. We are grateful to Gavin Thomas for providing the sequences to reconstruct branch length in the phylogenetic tree, to Liam Revell for providing the R code to run the analysis on correlated trait evolution using maximum likelihood and to Santiago Castroviejo Fisher for invaluable help with the phylogenetic reconstructions. We also thank Niclas Kolm and Bob Montgomerie for commenting on earlier drafts of the manuscript. This study was funded by a Leverhulme grant no. F/00118AJ to T.R.B. S.I. was funded by the Swiss National Foundation, the Wenner-Gren Foundation and the Swedish Research Council and A.G.-V. was funded by a Juan de la Cierva postdoctoral fellowship from the Spanish Ministerio de Ciencia e Inovación.
References
- 1.Snook R. R. 2005. Sperm in competition: not playing by the numbers. Trends Ecol. Evol. 20, 46–53 10.1016/j.tree.2004.10.011 (doi:10.1016/j.tree.2004.10.011) [DOI] [PubMed] [Google Scholar]
- 2.Pitnick S., Hosken D. J., Birkhead T. R. 2009. Sperm morphological diversity. In Sperm biology: an evolutionary perspective (eds Birkhead T. R., Hosken D. J., Pitnick S.), pp. 69–149 Oxford, UK: Academic Press [Google Scholar]
- 3.Gomendio M., Roldan E. R. S. 1991. Sperm competition influences sperm size in mammals. Proc. R. Soc. Lond. B 243, 181–185 10.1098/rspb.1991.0029 (doi:10.1098/rspb.1991.0029) [DOI] [PubMed] [Google Scholar]
- 4.Briskie J. V., Montgomerie R. 1992. Sperm size and sperm competition in birds. Proc. R. Soc. Lond. B 247, 89–95 10.1098/rspb.1992.0013 (doi:10.1098/rspb.1992.0013) [DOI] [PubMed] [Google Scholar]
- 5.Gage M. J. G. 1994. Associations between body size, mating pattern, testis size and sperm length across butterflies. Proc. R. Soc. Lond. B 258, 247–254 10.1098/rspb.1994.0169 (doi:10.1098/rspb.1994.0169) [DOI] [Google Scholar]
- 6.Balshine S., Leach B. J., Neat F., Werner N. Y., Montgomerie R. 2001. Sperm size of African cichlids in relation to sperm competition. Behav. Ecol. 12, 726–731 10.1093/beheco/12.6.726 (doi:10.1093/beheco/12.6.726) [DOI] [Google Scholar]
- 7.Byrne P. G., Simmons L. W., Roberts J. D. 2003. Sperm competition and the evolution of gamete morphology in frogs. Proc. R. Soc. Lond. B 270, 2079–2086 10.1098/rspb.2003.2433 (doi:10.1098/rspb.2003.2433) [DOI] [PMC free article] [PubMed] [Google Scholar]
- 8.Anderson M. J., Dixson A. F. 2002. Motility and the midpiece in primates. Nature 416, 496. 10.1038/416496a (doi:10.1038/416496a) [DOI] [PubMed] [Google Scholar]
- 9.Anderson M. J., Nyholt J., Dixson A. F. 2005. Sperm competition and the evolution of sperm midpiece volume in mammals. J. Zool. Lond. 267, 135–142 10.1017/S0952836905007284 (doi:10.1017/S0952836905007284) [DOI] [Google Scholar]
- 10.Immler S., Birkhead T. R. 2007. Sperm competition and sperm midpiece size: no consistent pattern in passerine birds. Proc. R. Soc. B 274, 561–568 10.1098/rspb.2006.3752 (doi:10.1098/rspb.2006.3752) [DOI] [PMC free article] [PubMed] [Google Scholar]
- 11.Gage M. J. G., Freckleton R. P. 2003. Relative testis size and sperm morphometry across mammals: no evidence for an association between sperm competition and sperm length. Proc. R. Soc. Lond. B 270, 625–632 10.1098/rspb.2002.2258 (doi:10.1098/rspb.2002.2258) [DOI] [PMC free article] [PubMed] [Google Scholar]
- 12.Miller G. T., Pitnick S. 2002. Sperm-female coevolution in Drosophila. Science. 298, 1230–1233 10.1126/science.1076968 (doi:10.1126/science.1076968) [DOI] [PubMed] [Google Scholar]
- 13.Briskie J. V., Montgomerie R., Birkhead T. R. 1997. The evolution of sperm size in birds. Evolution 51, 937–945 10.2307/2411167 (doi:10.2307/2411167) [DOI] [PubMed] [Google Scholar]
- 14.Cardullo R. A., Baltz J. M. 1991. Metabolic regulation in mammalian sperm: mitochondrial volume determines sperm length and flagellar beat frequency. Cell Mot. Cytoskel. 19, 180–188 10.1002/cm.970190306 (doi:10.1002/cm.970190306) [DOI] [PubMed] [Google Scholar]
- 15.Gage M. J. G. 1998. Mammalian sperm morphometry. Proc. R. Soc. Lond. B 265, 97–103 10.1098/rspb.1998.0269 (doi:10.1098/rspb.1998.0269) [DOI] [PMC free article] [PubMed] [Google Scholar]
- 16.Lüpold S., Linz G. M., Birkhead T. R. 2009. Sperm design and variation in the New World blackbirds (Icteridae). Behav. Ecol. Sociobiol. 63, 899–909 10.1007/s00265-009-0733-6 (doi:10.1007/s00265-009-0733-6) [DOI] [Google Scholar]
- 17.Immler S., Saint-Jalme M., Lesobre L., Sorci G., Roman Y., Birkhead T. R. 2007. The evolution of sperm morphometry in pheasants. J. Evol. Biol. 20, 1008–1014 10.1111/j.1420-9101.2007.01302.x (doi:10.1111/j.1420-9101.2007.01302.x) [DOI] [PubMed] [Google Scholar]
- 18.Price T., Langen T. 1992. Evolution of correlated characters. Trends Ecol. Evol. 7, 307–310 10.1016/0169-5347(92)90229-5 (doi:10.1016/0169-5347(92)90229-5) [DOI] [PubMed] [Google Scholar]
- 19.Lande R., Arnold S. 1983. The measurement of selection on correlated characters. Evolution 37, 1210–1226 10.2307/2408842 (doi:10.2307/2408842) [DOI] [PubMed] [Google Scholar]
- 20.Schluter D., Nychka D. 1994. Exploring fitness surfaces. Am. Nat. 4, 597–616 10.1086/285622 (doi:10.1086/285622) [DOI] [Google Scholar]
- 21.Pagel M., Harvey P. H. 1989. Taxonomic differences in the scaling of brain on body weight amongst mammals. Science 244, 1589–1593 10.1126/science.2740904 (doi:10.1126/science.2740904) [DOI] [PubMed] [Google Scholar]
- 22.Woolley D. 1971. Selection for the length of the spermatozoan midpiece in the mouse. Genet. Res. 16, 261–275 10.1017/S0016672300002524 (doi:10.1017/S0016672300002524) [DOI] [PubMed] [Google Scholar]
- 23.Immler S., Pryke S. R., Birkhead T. R., Griffith S. C. 2010. Pronounced within-individual plasticity in sperm morphometry across social environments. Evolution 64, 1634–1643 10.1111/j.1558-5646.2009.00924.x (doi:10.1111/j.1558-5646.2009.00924.x) [DOI] [PubMed] [Google Scholar]
- 24.Birkhead T. R., Pellatt E. J., Brekke P., Yeates R., Castillo-Juarez H. 2005. Genetic effects on sperm design in the zebra finch. Nature 434, 383–387 10.1038/nature03374 (doi:10.1038/nature03374) [DOI] [PubMed] [Google Scholar]
- 25.Chenoweth S., Blows M. 2008. QST meets the G matrix: the dimensionality of adaptive divergence in multiple correlated quantitative traits. Evolution 62, 1437–1449 10.1111/j.1558-5646.2008.00374.x (doi:10.1111/j.1558-5646.2008.00374.x) [DOI] [PubMed] [Google Scholar]
- 26.Calhim S., Immler S., Birkhead T. R. 2007. Postcopulatory sexual selection is associated with reduced variation in sperm morphology. PLoS ONE 2, e413. 10.1371/journal.pone.0000413 (doi:10.1371/journal.pone.0000413) [DOI] [PMC free article] [PubMed] [Google Scholar]
- 27.Immler S., Calhim S., Birkhead T. R. 2008. Increased postcopulatory sexual selection reduces the intramale variation in sperm design. Evolution 62, 1538–1543 10.1111/j.1558-5646.2008.00393.x (doi:10.1111/j.1558-5646.2008.00393.x) [DOI] [PubMed] [Google Scholar]
- 28.Skinner A., Watt P. 2007. Phenotypic correlates of phenotypic spermatozoon quality in the guppy, Poecilia reticulata. Behav. Ecol. 18, 47–52 10.1093/beheco/arl049 (doi:10.1093/beheco/arl049) [DOI] [Google Scholar]
- 29.Humphries S., Evans J. P., Simmons L. W. 2008. Sperm competition: linking form to function. BMC Evol. Biol. 8, 319. 10.1186/1471-2148-8-319 (doi:10.1186/1471-2148-8-319) [DOI] [PMC free article] [PubMed] [Google Scholar]
- 30.Fitzpatrick J., Montgomerie R., Desjardins J. K., Stiver K. A., Kolm N., Balshine S. 2009. Female promiscuity promotes the evolution of faster sperm in cichlid fishes. Proc. Natl Acad. Sci. USA 106, 1128–1132 10.1073/pnas.0809990106 (doi:10.1073/pnas.0809990106) [DOI] [PMC free article] [PubMed] [Google Scholar]
- 31.Blows M., Hoffmann A. 2005. A reassessment of genetic limits to evolutionary change. Ecology 86, 1371–1384 10.1890/04-1209 (doi:10.1890/04-1209) [DOI] [Google Scholar]
- 32.Retzius G. 1909. Die Spermien der Vögel. Biol. Unters. New Ser. 14, 89–122 [Google Scholar]
- 33.Koehler L. D. 1995. Diversity of avian spermatozoa ultrastructure with emphasis on the members of the order Passeriformes. Mém. Mus. Natl Hist. Nat. 166, 437–444 [Google Scholar]
- 34.Jamieson B. G. M. 2007. Avian spermatozoa: structure and phylogeny. In Reproductive biology and phylogeny of birds (ed. Jamieson B.), pp. 349–511 Enfield, NH: Science Publisher [Google Scholar]
- 35.Harmon L., Schulte J., Larson A., Losos J. 2003. Tempo and mode of evolutionary radiation in iguanian lizards. Science 301, 961–964 10.1126/science.1084786 (doi:10.1126/science.1084786) [DOI] [PubMed] [Google Scholar]
- 36.Butler M., King A. 2004. Phylogenetic comparative analysis: a modeling approach for adaptive evolution. Am. Nat. 164, 683–695 10.1086/426002 (doi:10.1086/426002) [DOI] [PubMed] [Google Scholar]
- 37.Gonzalez-Voyer A., Winberg S., Kolm N. 2009. Distinct evolutionary patterns of brain and body size during adaptive radiation. Evolution 63, 2266–2274 10.1111/j.1558-5646.2009.00705.x (doi:10.1111/j.1558-5646.2009.00705.x) [DOI] [PubMed] [Google Scholar]
- 38.Gonzalez-Voyer A., Winberg S., Kolm N. 2009. Brain structure evolution in a basal vertebrate clade: evidence from phylogenetic comparative analysis of cichlid fish. BMC Evol. Biol. 9, 238. 10.1186/1471-2148-9-238 (doi:10.1186/1471-2148-9-238) [DOI] [PMC free article] [PubMed] [Google Scholar]
- 39.Revell L., Collar D. 2009. Phylogenetic analysis of the evolutionary correlation using likelihood. Evolution 63, 1090–1100 10.1111/j.1558-5646.2009.00616.x (doi:10.1111/j.1558-5646.2009.00616.x) [DOI] [PubMed] [Google Scholar]
- 40.Immler S., Pitnick S., Parker G. A., Durrant K. L., Lüpold S., Calhim S., Birkhead T. R. 2011. Resolving variation in the reproductive tradeoff between sperm size and number. Proc. Natl Acad. Sci. USA 108, 5325–5330 10.1073/pnas.1009059108 (doi:10.1073/pnas.1009059108) [DOI] [PMC free article] [PubMed] [Google Scholar]
- 41.Immler S., Birkhead T. R. 2005. A non-invasive method for obtaining spermatozoa from birds. Ibis 147, 827–830 10.1111/j.1474-919x.2005.00456.x (doi:10.1111/j.1474-919x.2005.00456.x) [DOI] [Google Scholar]
- 42.Thiede H., Gerriets D., Berens V., Rautenfeld D. 1981. The problems and techniques of artificial insemination in small birds. Der. praktische. Tierarzt. 62, 879–882 [Google Scholar]
- 43.Swofford D. L. 2003. PAUP* Phylogenetic analysis using parsimony (*and other methods), version 4. ed. Sunderland, MA: Sinauer Associates [Google Scholar]
- 44.Paradis E., Claude J., Strimmer K. 2004. APE: analyses of phylogenetics and evolution in R language. Bioinformatics 20, 289–290 10.1093/bioinformatics/btg412 (doi:10.1093/bioinformatics/btg412) [DOI] [PubMed] [Google Scholar]
- 45.R Development Core Team 2008. R: A language and environment for statistical computing. Vienna, Austria: R Foundation for Statistical Computing; See http://www.R-project.org [Google Scholar]
- 46.Freckleton R. P., Harvey P. H., Pagel M. 2002. Phylogenetic analysis and comparative data: a test and review of evidence. Am. Nat. 160, 712–725 10.1086/343873 (doi:10.1086/343873) [DOI] [PubMed] [Google Scholar]
- 47.Carroll R. J., Ruppert D. 1996. The use and misuse of orthogonal regression in linear errors-in-variables models. Am. Stat. 50, 1–6 [Google Scholar]
- 48.Nakagawa S. 2004. A farewell to Bonferroni: the problems of low statistical power and publication bias. Behav. Ecol. 15, 1044–1045 10.1093/beheco/arh107 (doi:10.1093/beheco/arh107) [DOI] [Google Scholar]
- 49.Harmon L., et al. 2010. Early bursts of body size and shape evolution are rare in comparative data. Evolution 64, 2385–2396 [DOI] [PubMed] [Google Scholar]
- 50.Harmon L., Weir J., Glor R., Challenger W. 2008. GEIGER: investigating evolutionary radiations. Bioinformatics 24, 129–131 10.1093/bioinformatics/btm538 (doi:10.1093/bioinformatics/btm538) [DOI] [PubMed] [Google Scholar]
- 51.Harmon L., Losos J. 2005. Th effect of intraspecifc sample size on Type I and Type II error rates in comparative studies. Evolution 59, 2705–2710 [PubMed] [Google Scholar]
- 52.Simmons L. W., Moore A. 2009. Evolutionary quantitative genetics of sperm. In Sperm biology: an evolutionary perspective (eds Birkhead T. R., Hosken D. J., Pitnick S.), pp. 405–434 Oxford, UK: Academic Press [Google Scholar]
- 53.Firman R. C., Simmons L. W. 2010. Sperm midpiece length predicts sperm swimming velocity in house mice. Biol. Lett. 6, 513–516 10.1098/rsbl.2009.1027 (doi:10.1098/rsbl.2009.1027) [DOI] [PMC free article] [PubMed] [Google Scholar]
- 54.Fitzpatrick J. L., Simmons L. W., Evans J. P. 2012. Complex patterns of multivariate selection on the ejaculate of a broadcast spawning marine invertebrate. Evolution 66, 2451–2460 10.1111/j.1558-5646.2012.01627.x (doi:10.1111/j.1558-5646.2012.01627.x) [DOI] [PubMed] [Google Scholar]
- 55.Gómez Montoto L., Magaña C., Tourmente M., Martín-Coello J., Crespo C., Luque-Larena J. J., Gomendio M., Roldan E. R. S. 2011. Sperm competition, sperm numbers and sperm quality in muroid rodents. PLoS ONE 6, e18173. 10.1371/journal.pone.0018173 (doi:10.1371/journal.pone.0018173) [DOI] [PMC free article] [PubMed] [Google Scholar]
- 56.Lüpold S., Calhim S., Immler S., Birkhead T. R. 2009. Sperm morphology and sperm velocity in passerine birds. Proc. R. Soc. B 276, 1175–1181 10.1098/rspb.2008.1645 (doi:10.1098/rspb.2008.1645) [DOI] [PMC free article] [PubMed] [Google Scholar]
- 57.Gomendio M., Roldan E. R. S. 1993. Coevolution between male ejaculates and female reproductive biology in eutherian mammals. Proc. R. Soc. Lond. B 252, 7–12 10.1098/rspb.1993.0039 (doi:10.1098/rspb.1993.0039) [DOI] [PubMed] [Google Scholar]
- 58.Helfenstein F., Szép T., Nagy Z., Kempenaers B., Wagner R. H. 2008. Between-male variation in sperm size, velocity and longevity in sand martins Riparia riparia. J. Avian Biol. 39, 647–652 10.1111/j.1600-048X.2008.04450.x (doi:10.1111/j.1600-048X.2008.04450.x) [DOI] [Google Scholar]
- 59.Helfenstein F., Podevin M., Richner H. 2010. Sperm morphology, swimming velocity, and longevity in the house sparrow Passer domesticus. Behav. Ecol. Sociobiol. 64, 557–565 10.1007/s00265-009-0871-x (doi:10.1007/s00265-009-0871-x) [DOI] [Google Scholar]
- 60.Birkhead T. R., Møller A. P. 1992. Numbers and size of sperm storage tubules and the duration of sperm storage in birds: a comparative study. Biol. J. Linn. Soc. 45, 363–372 10.1111/j.1095-8312.1992.tb00649.x (doi:10.1111/j.1095-8312.1992.tb00649.x) [DOI] [Google Scholar]
- 61.Racey P. A. 1979. The prolonged storage and survival of spermatozoa in Chiroptera. J. Reprod. Fertil. 56, 391–402 10.1530/jrf.0.0560391 (doi:10.1530/jrf.0.0560391) [DOI] [PubMed] [Google Scholar]
- 62.Hosken D. J. 1997. Sperm competition in bats. Proc. R. Soc. Lond. B 264, 385–392 10.1098/rspb.1997.0055 (doi:10.1098/rspb.1997.0055) [DOI] [PMC free article] [PubMed] [Google Scholar]
- 63.Birkhead T. R., Møller A. P. 1993. Why do male birds stop copulating while their partners are still fertile? Anim. Behav. 45, 105–118 10.1006/anbe.1993.1010 (doi:10.1006/anbe.1993.1010) [DOI] [Google Scholar]
- 64.Mossman J., Slate J. A., Humphries S., Birkhead T. R. 2009. Sperm morphology and velocity are genetically co-determined in the zebra finch. Evolution 63, 2730–2737 10.1111/j.1558-5646.2009.00753.x (doi:10.1111/j.1558-5646.2009.00753.x) [DOI] [PubMed] [Google Scholar]
- 65.Immler S., Griffith S. C., Zann R. A., Birkhead T. R. 2012. Intra-specific variance in sperm morphometry: comparison between wild and domesticated zebra finches. Taeniopygia guttata. Ibis 154, 480–487 10.1111/j.1474-919X.2012.01232.x (doi:10.1111/j.1474-919X.2012.01232.x) [DOI] [Google Scholar]
- 66.Calhim S. 2008. Evolutionary significance of intraspecific variation in male passerine reproductive traits. Sheffield, UK: University of Sheffield [Google Scholar]
- 67.Crean A. J., Marshall D. J. 2008. Gamete plasticity in a broadcast spawning marine invertebrate. Proc. Natl Acad. Sci. USA 105, 13508–13513 10.1073/pnas.0806590105 (doi:10.1073/pnas.0806590105) [DOI] [PMC free article] [PubMed] [Google Scholar]
- 68.Vernon G. G., Woolley D. M. 1999. Three-dimensional motion of avian spermatozoa. Cell. Mot. Cytoskel. 42, 149–161 (doi:10.1002/(SICI)1097-0169(1999)42:2<149::AID-CM6>3.0.CO;2-0) [DOI] [PubMed] [Google Scholar]
- 69.Werner M., Simmons L. W. 2008. Insect sperm motility. Biol. Rev. 83, 191–208 10.1111/j.1469-185X.2008.00039.x (doi:10.1111/j.1469-185X.2008.00039.x) [DOI] [PubMed] [Google Scholar]
- 70.Lardy H. A., Phillips P. H. 1941. The interrelation of oxidative and glycolytic processes as sources of energy for bull spermatozoa. Am. J. Physiol. 133, 602–609 [Google Scholar]
- 71.Lardy H. A., Gosh D., Plat G. W. 1949. A metabolic regulator in mammalian spermatozoa. Science 109, 365–367 10.1126/science.109.2832.365 (doi:10.1126/science.109.2832.365) [DOI] [PubMed] [Google Scholar]
- 72.Fraser L. R., Quinn P. J. 1981. A glycolytic product is obligatory for initiation of the sperm acrosome reaction and whiplash motility required for fertilization in the mouse. J. Reprod. Fertil. 61, 25–35 10.1530/jrf.0.0610025 (doi:10.1530/jrf.0.0610025) [DOI] [PubMed] [Google Scholar]