Abstract
Background: Contradictory results from clinical trials that examined the role of vitamin E in chronic disease could be a consequence of interindividual variation, caused by factors such as xenobiotic use. Cometabolism of vitamin E with other pharmaceutical products could affect the bioavailability of the drug. Thus, it is necessary to understand fully the metabolic routes and biological endpoints of vitamin E.
Objective: The objective was to uncover novel metabolites and roles of vitamin E in humans and mouse models.
Design: Human volunteers (n = 10) were fed almonds for 7 d and then an α-tocopherol dietary supplement for 14 d. Urine and serum samples were collected before and after dosing. C57BL/6 mice (n = 10) were also fed α-tocopherol–deficient and –enriched diets for 14 d. Urine, serum, and feces were collected before and after dosing, and liver samples were collected after euthanization. Ultraperformance liquid chromatography electrospray ionization time-of-flight mass spectrometry and multivariate data analysis tools were used to analyze the samples.
Results: Three novel urinary metabolites of α-tocopherol were discovered in humans and mice: α-carboxyethylhydroxychroman (α-CEHC) glycine, α-CEHC glycine glucuronide, and α-CEHC taurine. Another urinary metabolite, α-CEHC glutamine, was discovered in mice after α-CEHC gavage. Increases in liver fatty acids and decreases in serum and liver cholesterol were observed in mice fed the α-tocopherol–enriched diet.
Conclusion: Novel metabolites and metabolic pathways of vitamin E were identified by mass spectrometry–based metabolomics and will aid in understanding the disposition and roles of vitamin E in vivo.
INTRODUCTION
Clinical trials that have examined the effect of vitamin E on chronic diseases, mainly those with an oxidative stress component, have shown numerous contradictory results. For example, trials investigating the effect of α-tocopherol on prostate cancer incidence reported a 17% increased risk (400 IU all-rac-α-tocopherol/d) in the Selenium and Vitamin E Cancer Prevention Trial (1); a 35% decreased risk (50 mg α-tocopherol/d) in the Alpha-Tocopherol, Beta Carotene trial (2); and no change in risk (400 IU α-tocopherol every other day) in the Physicians Health Study II (3). The variation in data reported from clinical trials could be influenced by interindividual variation as a result of differences in genomic, environmental, and gut microbiota influences (4). Cometabolism of vitamin E with xenobiotics such as pharmaceutical drugs, nicotine, and alcohol, which use similar drug-metabolizing enzymes and transporters, may affect bioavailability and mechanisms of regulation. Thus, to understand the absolute effects of a self-administered dietary supplement such as vitamin E, it is necessary to understand its metabolic routes and biological endpoints as factors that may affect its bioavailability and the bioavailability of any coadministered pharmaceutical drugs.
A novel metabolite of vitamin E, γ-carboxyethylhydroxychroman (CEHC)6 glucoside, was recently discovered in mice by mass spectrometry (MS)–based metabolomics (5), which indicates that other novel metabolites and metabolic pathways for vitamin E may exist. Hence, the aims of this study were to use MS-based metabolomics to identify novel human metabolites of the biologically active form of vitamin E, α-tocopherol. α-Tocopherol was administered in the form of a whole food (almonds) at the Recommended Dietary Allowance for vitamin E and a high-dose dietary supplement (600 IU α-tocopherol). This was done to determine whether vitamin E metabolites would be observable in biofluids when administered at its Recommended Dietary Allowance or whether it would be used fully; 94% of the tocopherols/tocotrienols in almonds are α-tocopherol (6). Vitamin E may have different biological effects when administered as a whole food (d-α-tocopherol) rather than as the synthetic biologically active compound all-rac-α-tocopherol. In addition, both types of dosing would show endogenous perturbations caused by low and high doses of vitamin E and thus show changes to metabolic pathways. A further study was undertaken in mice to determine whether the same α-tocopherol metabolites could be observed and also to identify possible changes in endogenous metabolism. These perturbations could indicate changes to human metabolism that are regulated by α-tocopherol, which may be masked by human interindividual variation. Therefore, this study could identify novel metabolite and roles for α-tocopherol in mice and humans.
SUBJECTS AND METHODS
Subjects and experimental design
The study protocol was approved by the Ethics Committee of the General Teaching Hospital in Prague, Czech Republic, in 2008 and the study commenced in June 2008. Human volunteers aged 18–40 y (n = 10) provided signed consent to take part in the study. Exclusion criteria included the following: volunteering in another clinical trial within the past 3 mo, use of vitamin E or other vitamins and dietary supplements within the past 2 mo, use of any over-the-counter or prescription drugs within the past 2 mo, any history of severe liver or renal disease, suspicion of any systemic disease, active infection or immunization within the past 4 wk, abuse of any drug or alcohol, smoking, or biochemical abnormalities in blood count or liver and renal functions (bilirubin, alanine aminotransferase, aspartate aminotransferase, alkaline phosphatase, creatinine, urea). A medical history and screening were undertaken 7 d before sampling.
On day −1, serum and 24-h urine samples were collected 2 h after breakfast. From days 0 to 7, raw almonds (55 g) were ingested daily; on day 7, serum samples and 24-h urine samples were collected. The subjects were subsequently administered 600 IU vitamin E capsules containing all-rac-α-tocopherol acetate (purchased from Zentiva) for 14 d. On days 7 and 14 of dosing, serum samples and 24-h urine samples were collected again. Venous blood samples (9 mL) were collected into serum-collecting tubes (S-Monovette–Serum; Sarstedt) and immediately centrifuged for 10 min at 4°C (2000 × g). Samples were portioned into aliquots in 1.5-mL microcentrifuge tubes and frozen at −80°C. Urine was collected over 24 h into sterile containers (BD Vacutainer Collection Container; Becton Dickinson), stored at 4°C during the collection time period, and then portioned into aliquots in 1.5-mL microcentrifuge tubes and frozen at −80°C. The samples were shipped overnight on dry ice from Charles University in Prague, Czech Republic, to the National Cancer Institute (NCI).
Animals, diets, and experimental design
All animal studies were conducted in accordance with the Institute of Laboratory Animal Resource guidelines and approved by the NCI Animal Care and Use Committee. From 3 wk of age, male C57BL/6 mice (n = 10) obtained from NCI-Frederick were maintained under a standard 12-h light/12-h dark cycle with water. They were fed an ad libitum purified vitamin E–free diet (purchased from Dyets Inc) containing vitamin-free casein, sucrose, cornstarch, dextrinized cornstarch, l-cystine, cellulose, tocopherol-stripped soybean oil, mineral mix, vitamin mix with no vitamin E, and choline bitartrate. The mineral mix consisted of calcium carbonate, potassium citrate, potassium phosphate monobasic, sodium chloride, potassium sulfate, magnesium oxide, ferric citrate, zinc carbonate, manganous carbonate, cupric carbonate, potassium iodate, sodium selenate, ammonium vanadate, and sucrose. The vitamin mix consisted of niacin, calcium pantothenate, pyridoxine hydrochloride, thiamine hydrochloride, riboflavin, folic acid, biotin, vitamin B-12, vitamin A palmitate, vitamin D3, vitamin K2/dextrose mix, and sucrose. At 6 and 7 wk of age, the mice were placed in individual metabolic cages for 24 h for acclimatization purposes. At 8 wk of age, the mice were placed in metabolic cages for 24-h predose urine and feces collections. Serum samples (100 μL) were collected into serum separator tubes (Becton Dickinson) by retro-orbital bleeding. This was carried out after removal of the mice from the metabolic cages. Half the mice were then fed the same vitamin E–deficient diet but were supplemented with 500 mg dl-α-tocopheryl acetate/kg (Glanbia Nutrition); the remaining half of the mice were fed the vitamin E–deficient diet. At 9 and 10 wk of age, the mice were placed in metabolic cages for 24-h urine and feces collection. After the final serum collection, the mice were euthanized under carbon dioxide. Livers were harvested, flash frozen in liquid nitrogen, and stored at −80°C. Total serum and liver cholesterol and triglycerides were measured by using kits from Wako Chemicals according to the manufacturer's instructions.
To determine all of the potential metabolites that could be formed from α-CEHC in the mouse, α-CEHC was administered directly via gavage. From 3 wk of age, male C57BL/6 mice (n = 10) obtained from NCI-Frederick were fed the vitamin E–deficient diet ad libitum as described in the previous paragraph. At 6, 7, and 8 wk of age, the mice were gavaged with 100 μL sodium carboxymethylcellulose (0.5% wt:vol) (Sigma-Aldrich) and placed in metabolic cages for acclimatization and predose urine collection. Gavaging was carried out so that the mice could become acclimatized to this stressful procedure, which could affect the metabolome. At 9 wk of age, half the mice were gavaged with sodium carboxymethylcellulose (0.5% wt:vol) and half with 100 μL 25 mg α-CEHC/kg (Cayman Chemical) in sodium carboxymethylcellulose (0.5% wt:vol). The mice were placed in metabolic cages for 24 h for urine collection. After being removed from the cages, the mice were euthanized under carbon dioxide.
Chemical synthesis
To verify the identities of α-CEHC acyl glucuronide, α-CEHC ether glucuronide, α-CEHC sulfate, α-carboxymethylbutylhydroxychroman (α-CMBHC) ether glucuronide, α-CEHC glycine, α-CEHC taurine, and α-CEHC glutamine, standards were synthesized in-house as described in the supplemental materials (see “Supplemental data” in the online issue).
Sample preparation for ultraperformance liquid chromatographyndashelectrospray ionizationndashquadrupole time-of-flight mass spectrometry
All reagents were of the highest purity grade and purchased from Sigma-Aldrich. Urine collected from humans and mice were thawed, and 50 μL was added to a microcentrifuge tube containing 50 μL acetonitrile:water (50:50 vol:vol) and 5 μmol chlorpropamide/L stored at 4°C. The samples were mixed by vortex for 1 min each and centrifuged at 14,000 × g for 20 min at 4°C to remove proteins and particulates. The supernatant fluid was transferred to an ultraperformance liquid chromatography (UPLC) vial (Waters Corp). Dried mouse feces (25 mg) was homogenized in 1 mL methanol with 1.0 mm zirconia/silica beads (BioSpec Products Inc) in a Precellys 24 homogenizer (Bertin Technologies) at 6500 rpm for 20 s. The samples were centrifuged at 14,000 × g for 20 min at 4°C, and the supernatant fluid was transferred to a 1.5-mL microcentrifuge tube. They were concentrated for 6 h in a Savant Speedvac (Thermo Scientific) and resuspended in 400 μL methanol:water (50:50 vol:vol) containing 5 μmol chlorpropamide/L. The samples were then centrifuged twice at 14,000 × g for 20 min at 4°C, and the final supernatant fluid was transferred to a UPLC vial. Frozen mouse liver (50 mg) was homogenized in 1.5 mL methanol:water (50:50 vol:vol) with 1.0 mm zirconia/silica beads (BioSpec Products Inc) in a Precellys 24 homogenizer (Bertin Technologies) at 6500 rpm for 20 s. The samples were incubated at 4°C for 20 min on a shaker at 1200 rpm and then centrifuged at 14,000 × g for 20 min at 4°C. For the aqueous fraction, the supernatant fluid was transferred to a 1.5-mL microcentrifuge tube and concentrated for 6 h in a Savant Speedvac. The samples were resuspended in 400 μL methanol:water (50:50 vol:vol) containing 5 μmol chlorpropamide/L and centrifuged twice at 14,000 × g for 20 min at 4°C. The final supernatant fluid was transferred to a UPLC vial. For the organic fraction, the pellet remaining from the original homogenization was homogenized again as above in 1.5 mL dichloromethane:methanol (50:50 vol:vol). The supernatant fluid was removed and added to glass vials and left to evaporate in a fume cabinet overnight. The samples were resuspended in 400 mL methanol:water (50:50 vol:vol) containing 5 μmol/L chlorpropamide and centrifuged twice at 14,000 × g for 20 min at 4°C. The final supernatant fluid was transferred to a UPLC vial. Sera were thawed, and 25 μL was added to a microcentrifuge tube containing 75 μL methanol stored at 4°C. The samples were mixed by vortex for 1 min each, and centrifuged at 14,000 × g for 20 min at 4°C to remove proteins and particulates. The supernatant fluid was transferred to a 1.5-mL microcentrifuge tube and concentrated for 2 h in a Savant Speedvac; the samples were resuspended in 100 μL methanol:water (50:50 vol:vol) containing 5 μmol chlorpropamide/L and centrifuged twice at 14,000 × g for 20 min at 4°C. The final supernatant fluid was transferred to a UPLC vial. For all of the above extractions, pooled samples were also made for quality control containing 5 μL of each sample.
Metabolomics analysis
Urine samples were randomized and analyzed by UPLC–electrospray ionization (ESI)–quadrupole time-of-flight mass spectrometry (QTOFMS) as described previously (7). In brief, samples were injected onto a reversed-phase 50 × 2.1 mm ACQUITY 1.7 μm BEH C18 column (Waters Corp) using an ACQUITY UPLC system (Waters Corp) with a gradient mobile phase of 0.1% formic acid (solution A) and acetonitrile containing 0.1% formic acid (solution B) at a flow rate of 0.5 mL/min: 98% A for 0.5 min to 20% B at 4.0 min to 95% B at 8 min. The column was washed with 98% B for 1 min and then equilibrated with 98% A before subsequent injections. Pooled, blank, and standard samples were injected after every 5 samples. MS was performed on a Waters QTof-Premier-MS operating in ESI− and ESI+ mode. For feces, liver, and serum analysis, samples were injected as for urine with a gradient mobile phase of 0.1% formic acid (solution A) and methanol containing 0.1% formic acid (solution B) with a flow rate of 0.5 mL/min: 98% A for 0.5 min to 60% B at 4.0 min to 99% B at 8 min. The column was washed with 99% B for 1 min and then equilibrated with 98% A before subsequent injections. Pooled, blank, and standard were injected after every 3 samples. MS was performed as for the urine samples.
The mass spectral data were centroided, integrated, and deconvoluted to generate a multivariate data matrix by using MarkerLynx (Waters Corp). Peak picking, alignment, deisotoping, and integration were performed automatically by the software at the following parameters: mass tolerance = 0.05 amu, peak width at 5% height = 1 s, peak-to-peak baseline noise = 10, intensity threshold = 100 counts, mass window = 0.05 Da, retention time window = 0.20 min, and noise elimination level = 10. The raw data were transformed into a multivariate matrix containing aligned peak areas with matched mass-to-charge ratios (m/z) and retention times. The data were normalized to the peak area of the internal standard chlorpropamide, which appeared at a retention time of 5.3 min, 275.024 [M-H]−, and 277.041 [M+H]+ and exported in SIMCA-P+ software (Umetrics). The ESI+ and ESI− data were Pareto-scaled and analyzed by principal components analysis (PCA), projection to latent structures discriminant analysis (PLS-DA), and orthogonal projection to latent structures discriminant analysis (OPLS-DA). For the identification of metabolites, OPLS-DA models were constructed by comparing predose with postdose samples. Ions with a p(corr) value >0.8 and a peak area >100 were subjected to tandem MS. Further confirmation of identity was then carried out by repeating the tandem MS fragmentation by using authentic standards at 100 μmol/L in water and in urine.
Biomarkers were quantitated by multiple reaction monitoring (MRM) on an ACQUITY UPLC coupled to a XEVO triple-quadrupole tandem MS (Waters Corp). This was to obtain the actual concentration of each metabolite normalized to the endogenous creatinine concentration. Standard calibration curves were made, and the following MRM transitions were monitored for creatinine (114.0→86.1 m/z ESI+), α-CEHC acyl glucuronide (453.2→233.2 m/z ESI−), α-CEHC ether glucuronide (455.2→279.2 m/z ESI+), α-CEHC sulfate (359.1→245.1 m/z ESI+), α-CMBHC ether glucuronide (497.1→165.1 m/z ESI+), α-CEHC glycine (336.2→261.2 m/z ESI+), α-CEHC taurine (386.2→234.1 m/z ESI+), and α-CEHC glutamine (407.1→83.8 m/z ESI+) by using authentic standards. Urine samples were deproteinized in 50% acetonitrile and diluted 1:2. An internal standard of chlorpropamide (277.1→110.9 m/z ESI+) was added to each sample with a final concentration of 1 μmol/L. The samples were quantitated by using TargetLynx (Waters Corp) software.
Endogenous liver metabolites were quantitated by using an ACQUITY UPLC H-class coupled to a XEVOG2 QTOFMS with Quantof technology (Waters Corp), as recently described (8). Standard calibration curves of 0 to 35 μmol/L of linoleic acid, linolenic acid, adrenic acid, oleic acid, DHA, arachidonic acid, and palmitic acid were made by using authentic standards. The samples were quantitated by using TargetLynx (Waters Corp) software by integrating peak areas of extracted ion chromatograms.
Gene expression analysis
cDNA was synthesized from 1 μg total RNA by using Superscript II reverse transcriptase kit (Invitrogen). For the quantitative polymerase chain reaction (qPCR) analysis, primers were designed by using Primer Express software (Applied Biosystems) based on GenBank sequence data. qPCR reactions contained 25 ng cDNA, 150 nmol/L of each primer, and 5 μL SYBR Green PCR Master Mix (Applied Biosystems) in a total volume of 10 μL. All reactions were performed in triplicate on an Applied Biosystems Prism 7900HT Sequence Detection System. Relative mRNA concentrations were calculated by using the comparative threshold cycle method, with β-actin as the internal control.
Statistical analysis
All concentrations were expressed as means ± SEMs after either 1-factor ANOVA with Bonferroni's correction for multiple comparisons, Mann-Whitney U test on unpaired samples, or Wilcoxon's matched-pairs signed-rank test for paired samples by using GraphPad Prism version 5.00 for Windows (GraphPad Software). A comparison with a P value <0.05 was statistically significant and noted on each graph.
RESULTS
Metabolomic analysis of human urine and serum
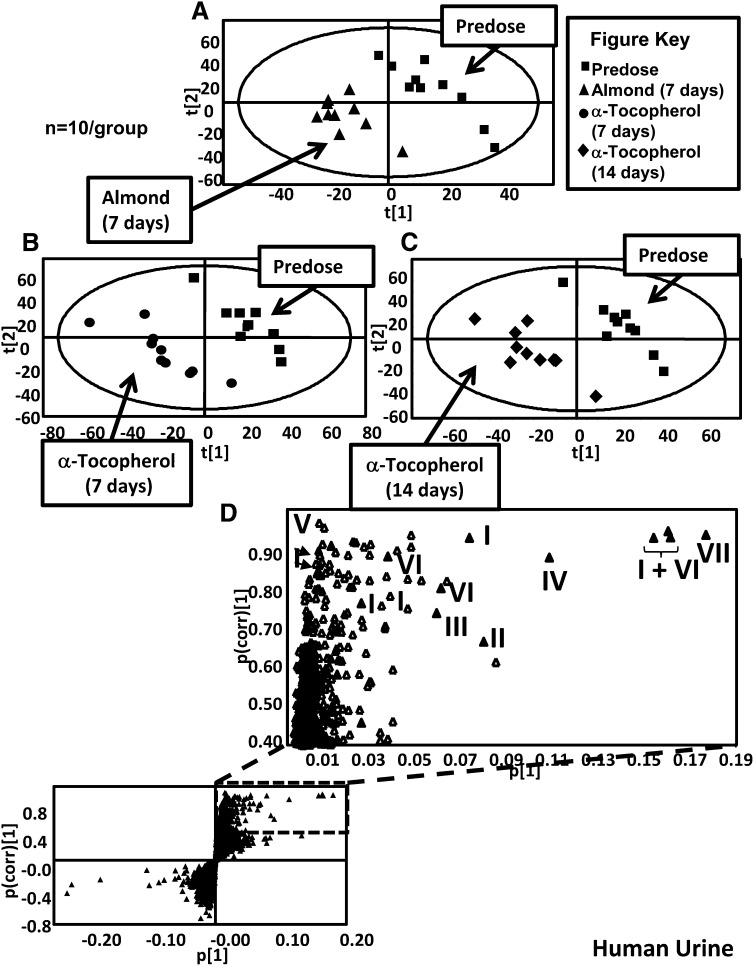
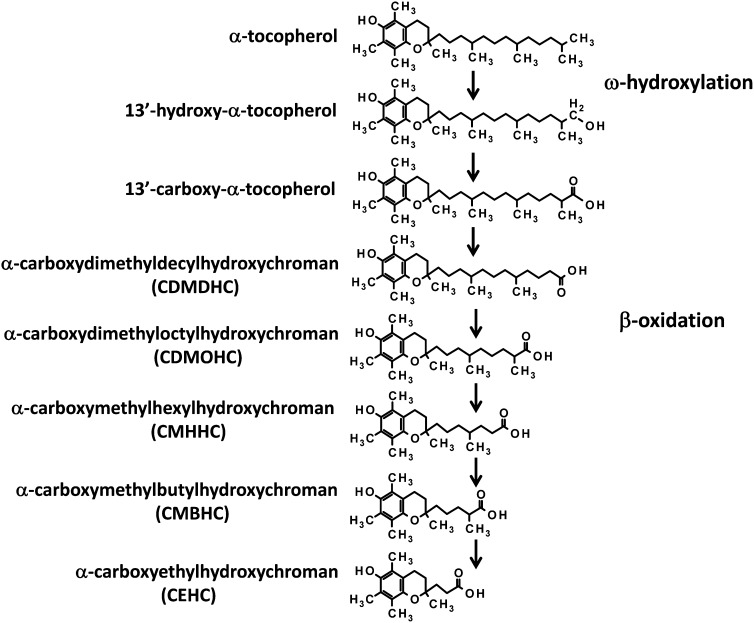
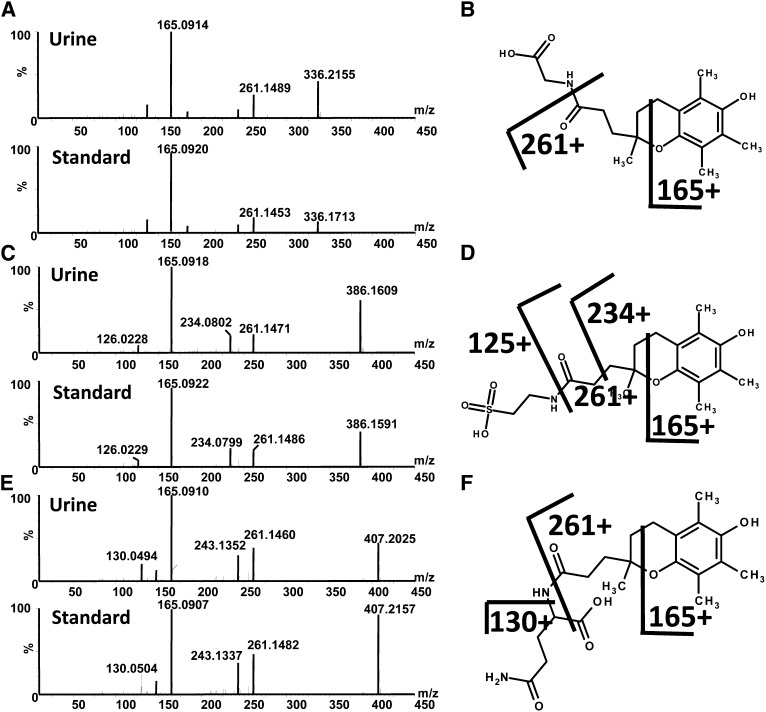
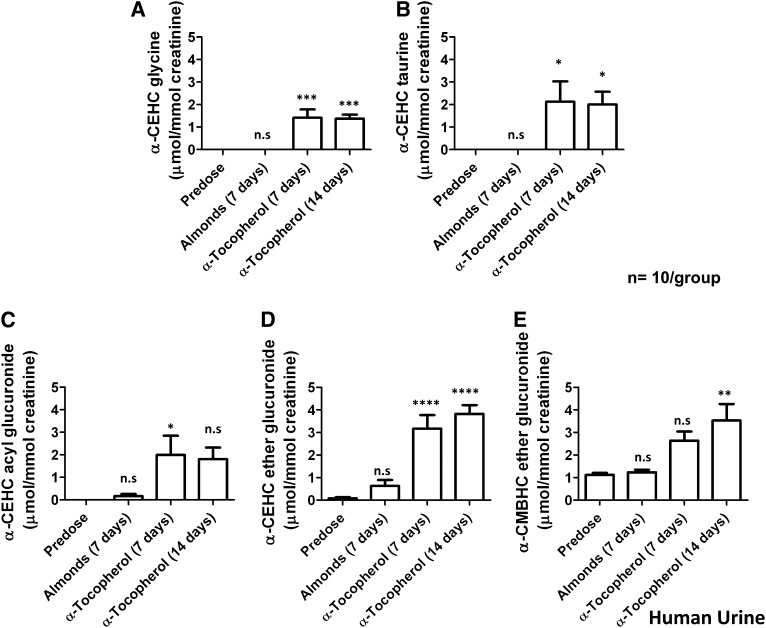
UPLC-ESI-QTOFMS analysis was carried out on urine samples collected from volunteers before and after almond/α-tocopherol dosing. The positive and negative mode data were subjected to multivariate data analysis (MDA) after preprocessing steps. PCA models were initially constructed by comparing all of the urine samples (2 principal components and 8126 variables) and then by using samples from predose and postdose almond or α-tocopherol. No separation was seen between the predose and postdose samples; thus, supervised 2-component PLS-DA models were made. The urine samples from before and after almond feeding clustered in dosing groups as shown in Figure 1A for the ESI− mode data; however, this model was not predictive. Urine samples from before and after α-tocopherol dosing were well separated, as is evident 7 d after dosing ( and 14 d after dosing (Figure 1C). OPLS-DA models were constructed from both positive and negative mode data reflecting the comparison of urine samples collected before dosing (y = 0) to 7 d after α-tocopherol supplement dosing and 14 d after α-tocopherol supplement dosing (y = 1). Many metabolites were highly correlated with dosing, as is evident in the S-plot for the comparison of before and 7 d after α-tocopherol supplement dosing in Figure 1D [R2X = 0.433, R2Y = 0.999, Q2 = 0.361 (Q2 is the measure of the predictive ability of the model on a scale of −1 to +1, with +1 being the most predictive)]. Ions that were highly correlated with α-tocopherol dosing, with a p(corr) >0.8 and a peak area >100, were subjected to tandem MS and compared against authentic standards that were synthesized in-house. The metabolites were confirmed as α-CEHC acyl glucuronide, α-CEHC ether glucuronide, α-CEHC sulfate, α-CMBHC ether glucuronide, α-CEHC glycine, and α-CEHC taurine. α-CEHC and α-CMBHC are the endproducts of a series of hydroxylated and oxidized α-tocopherol metabolites seen in Figure 2. Tandem MS also showed α-CEHC glycine glucuronide, which, when compared with the α-CEHC glycine standard, had characteristic fragments plus those of a glucuronide conjugate (m/z 193, 175, and 113). These metabolites and their mass spectral adducts and fragments after tandem MS are shown in Table 1. Of these 7 metabolites, α-CEHC glycine and α-CEHC taurine are both novel metabolites of α-tocopherol. Their extracted mass fragmentation patterns and structures can be seen in Figure 3, AndashD. Glucuronidated α-CEHC glycine was also a novel metabolite; it is assumed that the glucuronic acid was bound to a hydroxyl group on the chromanol ring via an O-ether linkage. The metabolites were quantitated by MRM. Standard calibration curves of 0 to 35 μmol/L were made for α-CEHC acyl glucuronide, α-CEHC ether glucuronide, α-CEHC sulfate, α-CMBHC ether glucuronide, α-CEHC glycine, and α-CEHC taurine. Urinary concentrations of these metabolites were calculated and can be seen in Figure 4. α-CEHC sulfate could not be quantitated by MRM, and α-CEHC glycine glucuronide was not quantitated because there was no authentic standard available. All of the volunteers produced α-CEHC and α-CMBHC ester glucuronides in their urine, but 90% of them produced α-CECH glycine, 70% α-CECH taurine, and 50% α-CEHC acyl glucuronide at day 7 and 70% at day 14. This indicates human interindividual variation in the metabolism of α-tocopherol. α-CMBHC was evident before dosing in the human urine samples and could possibly have been produced from the ingestion of tocotrienols found in wheat, bran, and rice. Tocotrienols can be converted to α-CMBHCs, as previously shown in HepG2 cells (9).
FIGURE 1.
PLS-DA scores determined from human urine samples analyzed by UPLC-ESI-QTOFMS. A: Before dosing compared with 7 d after almonds (R2X = 0.184, R2Y = 0.917, Q2 = −0.026). B: Before dosing compared with α-tocopherol supplementation for 7 d (R2X = 0.293, R2Y = 0.986, Q2 = 0.544). C: Before dosing compared with α-tocopherol supplementation for 14 d (R2X = 0.199, R2Y = 0.940, Q2 = 0.347). D: OPLS-DA loadings S-plot from human urine before dosing and after α-tocopherol supplementation for 7 d (R2X = 0.433, R2Y = 0.999, Q2 = 0.361). OPLS-DA, orthogonal projection to latent structures discriminant analysis; PLS-DA, projection to latent structures discriminant analysis; UPLC-ESI-QTOFMS, ultraperformance liquid chromatography–electrospray ionization–quadrupole time-of-flight mass spectrometry; I, α-carboxyethylhydroxychroman acyl glucuronide; II, α-carboxymethylbutylhydroxychroman ether glucuronide; III, α- carboxyethylhydroxychroman glycine; IV, α-carboxyethylhydroxychroman taurine; V, α-carboxyethylhydroxychroman glycine glucuronide; VI: α-carboxyethylhydroxychroman ether glucuronide; VII, α-carboxyethylhydroxychroman sulfate.
FIGURE 2.
Schematic of α-tocopherol metabolism.
TABLE 1.
α-Tocopherol metabolites discovered in human and mouse biofluids and liver by UPLC-ESI-QTOFMS metabolomics 14 d after supplementation with α-tocopherol1
| Metabolite | Biofluid | Species | Retention time | Experimental ion mass | Mass error | Formula | Fragments |
| min | ppm | ||||||
| α-CEHC ether glucuronide [M-H]− | Urine | Human, mouse | 4.86 | 453.1746 | 3.75 | C22H30O10 | 277.1428, 233.1536, 163.0757, 193.0357, 175.0277, 113.0246 |
| α-CEHC ether glucuronide [M+Na]+ | Urine | Human, mouse | 4.86 | 472.2201 | 3.81 | C22H30O10 | 279.1547, 261.1485, 243.1392, 165.0920 |
| α-CEHC ether glucuronide [M+NH4]+ | Urine | Human, mouse | 4.86 | 477.1754 | 3.56 | C22H30O10 | 301.1412 |
| α-CMBHC ether glucuronide [M-H]− | Urine | Human, mouse | 5.46 | 495.2225 | 1.00 | C25H36O10 | 319.1907, 275.2044, 175.0265, 150.0674, 113.0244, 85.0308 |
| α-CEHC glycine [M-H]− | Urine | Human, mouse | 5.12 | 334.1635 | 5.69 | C18H25NO5 | 275.1537, 163.0768, 150.0697, 74.0266 |
| α-CEHC glycine [M+H]+ | Urine | Human, mouse | 5.12 | 336.1806 | 1.49 | C18H25NO5 | 261.1418, 243.1380, 184.0955, 165.0923, 137.0931 |
| α-CEHC taurine [M-H]− | Urine | Human, mouse | 4.72 | 384.1463 | 4.68 | C18H27NO6S | 220.0615, 163.0774, 124.007, 106.9810, 79.9582 |
| α-CEHC taurine [M+H]+ | Urine | Human, mouse | 4.71 | 386.1626 | 2.84 | C18H27NO6S | 261.1483, 234.0783, 165.0922, 126.0234 |
| α-CEHC glycine glucuronide [M-H]− | Urine | Human, mouse | 4.44 | 510.1984 | 1.96 | C24H33NO11 | 334.1640, 175.0250, 113.0251, 74.0263 |
| α-CEHC sulfate [M-H]− | Urine | Human | 4.92 | 357.1000 | 2.22 | C16H22O7S | 233.1531, 163.0753, 79.9595 |
| α-CEHC acyl glucuronide [M-H]− | Urine | Human | 5.07 | 453.1751 | 2.65 | C22H30O10 | 277.1429, 233.1527, 163.0753, 193.0341, 175.0228, 113.0242 |
| α-CEHC acyl glucuronide [M+Na]+ | Urine | Human | 5.07 | 472.2211 | 5.92 | C22H30O10 | 279.1612, 261.1480, 165.0930, 137.0954 |
| α-CEHC acyl glucuronide [M+NH4]+ | Urine | Human | 5.07 | 477.1729 | 1.67 | C22H30O10 | 301.1423 |
| α-CEHC glutamine [M-H]- | Urine | Mouse | 4.97 | 405.2025 | 0.24 | C21H30N2O6 | 226.1432, 163.0748, 145.0615, 127.0503 |
| α-CEHC glutamine [M+H]+ | Urine | Mouse | 4.97 | 407.2221 | 9.5 | C21H29N2O6 | 261.1460, 243.1352, 165.0910, 147.0767, 130.0494 |
| 13-Hydroxy-α-tocopherol [M-H]− | Feces | Mouse | 7.62 | 445.3669 | 2.91 | C29H50O3 | 359.1534, 163.0765, 150.0708 |
| α-Tocopherol glucuronide [M-H]− | Serum | Human, mouse | 8.2 | 605.4059 | 7.26 | C16H22O4 | 429.3761, 175.0247, 163.0769, 113.0249 |
| α-CDMOHC [M+H]+ | Feces | Mouse | 6.58 | 390.2749 | 5.4 | C24H37O4 | 373.2810, 165.0928, 149.0253, 137.0984 |
| α-Tocopherol [M+H]+ | Liver | Mouse | 8.2 | 429.3710 | 5.4 | C16H22O4 | 233.1542, 205.1225, 165.0911, 149.0968 |
UPLC-ESI-QTOFMS, ultraperformance liquid chromatography–electrospray ionization–quadrupole time-of-flight mass spectrometry; α-CDMOHC, α-carboxydimethyloctylhydroxychroman; α-CEHC, carboxyethylhydroxychroman; α-CMBHC, α-carboxymethylbutylhydroxychroman.
FIGURE 3.
A: Extracted mass spectra 336.2 [M+H]+ of α-CEHC glycine in human urine (upper chromatogram) and synthesized standard (lower panel). B: α-CEHC glycine structure and calculated fragments. C: Extracted mass spectra 386.2 [M+H]+ of α-CEHC taurine in urine (upper chromatogram) and synthesized standard (lower panel). D: α-CEHC taurine structure and calculated fragments. E: Extracted mass spectra 407.2 [M+H]+ of α-CEHC glutamine in urine (upper chromatogram) and synthesized standard (lower panel). F: α-CEHC glutamine structure and calculated fragments. α-CEHC, α-carboxyethylhydroxychroman.
FIGURE 4.
Mean (±SEM) concentrations of α-tocopherol metabolites (α-CEHC glycine, α-CEHC taurine, α-CEHC acyl glucuronide, α-CEHC ether glucuronide, and α-CMBHC ether glucuronide) identified in human urine. Significance was determined by 1-factor ANOVA with Bonferroni's correction for multiple comparisons. Predose values were compared with values 7 d after almonds, 7 d after α-tocopherol, and 14 d after α-tocopherol. ****P < 0.0001, ***P < 0.001, **P < 0.01, *P < 0.05. α-CEHC, α-carboxyethylhydroxychroman; α-CMBHC, α-carboxymethylbutylhydroxychroman.
UPLC-ESI-QTOFMS analysis was also carried out on serum collected from the human volunteers. Similar to the urine sample analysis, models comparing serum before and after almond ingestion did not provide predictive models. PCA and PLS-DA models comparing values before and after α-tocopherol dosing showed a separation of samples into dosing groups for PLS-DA only (2-component model, 466 variables, 14 d after doing, ESI−: R2X = 0.390, R2Y = 0.754, Q2 = 0.165). OPLS-DA models were made by comparing negative and positive mode data from before dosing to 14 d after α-tocopherol supplement dosing, which indicated only one metabolite with a p(corr) value >0.8 (R2X = 0.562, R2Y = 0.989, Q2 = 0.097). This metabolite was identified as α-tocopherol glucuronide after fragmentation by tandem MS and comparison with an authentic standard for α-tocopherol. Previously, differences between metabolite profiles have been seen in serum and plasma (10). Glucuronides are typically formed through the actions of uridine diphosphate–glucuronosyl transferase enzymes in the endoplasmic reticulum of cells, and are then transported in the blood; there is no uridine diphosphate–glucuronosyl transferase activity in serum (11). However, because serum undergoes a clotting process and removes some metabolites, whereas plasma does not, it is likely that α-tocopherol glucuronide would also be seen in plasma.
Metabolomic analysis of mouse biofluids and tissues
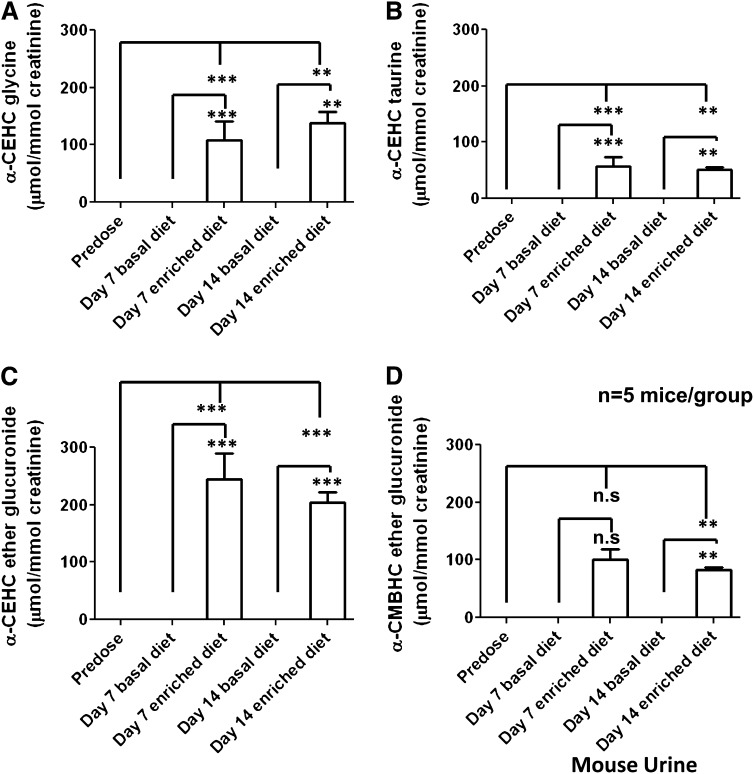
Urine, serum, and feces samples were collected from mice before and 7 and 14 d after α-tocopherol dosing. Liver samples were collected after euthanasia. The samples were prepared according to the sample type and analyzed by UPLC-ESI-QTOFMS and MDA. PCA models comparing predose, day 7 postdose, and day 14 postdose samples showed some separation between groups (ESI−: R2 = 0.622, Q2 = 0.151). PCA models were then made (2 components, 2346 variables) comparing urine taken from mice on the same day but fed different diets; groupings could now be seen according to diet (Figure 5, A and B) for days 7 and 14 after the α-tocopherol–enriched and –deficient diets, respectively. PLS-DA models (2 components) comparing urine from all 3 time points also showed clustering; predose and α-tocopherol–deficient diets clustered together and were well separated from samples taken from mice fed the α-tocopherol–enriched diet, as shown in Figure 5C. OPLS-DA models were constructed comparing urine samples from mice before dosing and fed the deficient diets (controls y = 0) with urine samples collected from mice fed the α-tocopherol–enriched diets after the 2 different time points (7 and 14 d) (y = 1) (ESI−: R2X = 0.340, R2Y = 0.955, Q2 = 0.823). Those metabolites highly correlated with α-tocopherol were investigated further. Tandem MS of these metabolites, with comparison with authentic synthesized standards, showed that 5 metabolites correlated with α-tocopherol dosing: α-CEHC ether glucuronide, α-CMBHC ether glucuronide, α-CEHC glycine, α-CEHC taurine, and α-CEHC glycine glucuronide were produced by every mouse fed the α-tocopherol–enriched diet. The metabolites were quantitated by MRM and are shown in Figure 6 and Table 1. α-CEHC glycine glucuronide was not quantitated because no available authentic standard was available. α-CEHC acyl glucuronide and α-CEHC sulfate, human urinary metabolites of α-tocopherol dosing, could not be identified in the mouse urine after global and targeted metabolomics.
FIGURE 5.
Principal components analysis scores determined from mouse urine samples analyzed by UPLC-ESI-QTOFMS 7 d (A; ESI−: R2 = 0.631, Q2 = 0.040) and 14 d (B; ESI−: R2 = 0.635, Q2 = 0.041) after dosing. C: PLS-DA scores from mouse urine samples analyzed by UPLC-ESI-QTOFMS before dosing and 7 and 14 d after dosing. ■, before dosing; △, α-tocopherol–deficient (basal) diet 7 d after dosing; ▴, α-tocopherol–enriched diet 7 d after dosing; ○, α-tocopherol–deficient (basal) diet 14 d after dosing; •, α-tocopherol–enriched diet 14 d after dosing (ESI−: R2X = 0.260, R2Y = 0.590, Q2 = 0.274). PLS-DA, projection to latent structures discriminant analysis; UPLC-ESI-QTOFMS, ultraperformance liquid chromatography–electrospray ionization–quadrupole time-of-flight mass spectrometry.
FIGURE 6.
Mean (±SEM) concentrations of α-tocopherol metabolites (α-CEHC glycine, α-CEHC taurine, α-CEHC ether glucuronide, and α-CMBHC ether glucuronide) identified in mouse urine. Significance was determined by 1-factor ANOVA with Bonferroni's correction for multiple comparisons. Comparisons were made between predose values and values 7 and 14 d after the α-tocopherol–enriched diet, 7 d after the basal diet compared with 7 d after the α-tocopherol–enriched diet, and 14 d after the basal diet compared with 14 d after the α-tocopherol–enriched diet. ***P < 0.001, **P < 0.01. α-CEHC, α-carboxyethylhydroxychroman; α-CMBHC, α-carboxymethylbutylhydroxychroman.
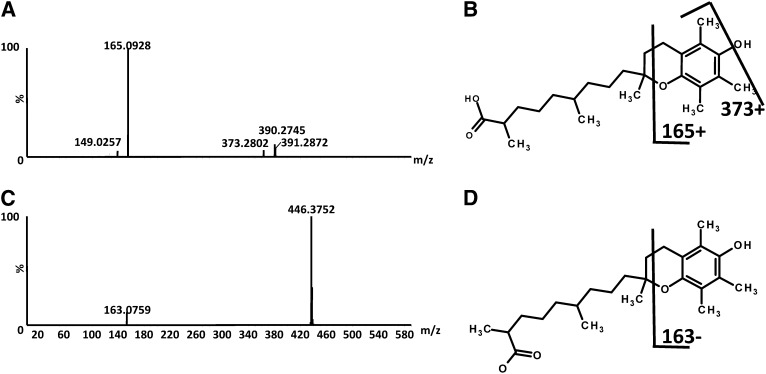
Fecal samples were also analyzed by UPLC-ESI-QTOFMS and MDA. PCA models comparing predose with 14-d postdose values showed groupings and separation between samples taken from mice fed α-tocopherol–enriched or –deficient diets (ESI− 2-component, 418 variables, R2 = 0.609, Q2 = 0.178). OPLS-DA models showed that ions correlated with α-tocopherol dosing. Tandem MS was carried out on these metabolites and indicated putative increases in 13-hydroxy-α-tocopherol and α-carboxydimethyloctylhydroxychroman after α-tocopherol dosing; fragmentation patterns can be seen in Figure 7, AndashD. Authentic standards were not available for these metabolites for confirmation.
FIGURE 7.
A: Extracted mass spectra 391.3 [M+H]+ of α-CDMOHC. B: α-CDMOHC structure and calculated fragments. C: Extracted mass spectra 446.4 [M-H]− of 13-hydroxy-α-tocopherol. D: 13-Hydroxy-α-tocopherol structure and calculated fragments. α-CDMOHC, α-carboxydimethyloctylhydroxychroman.
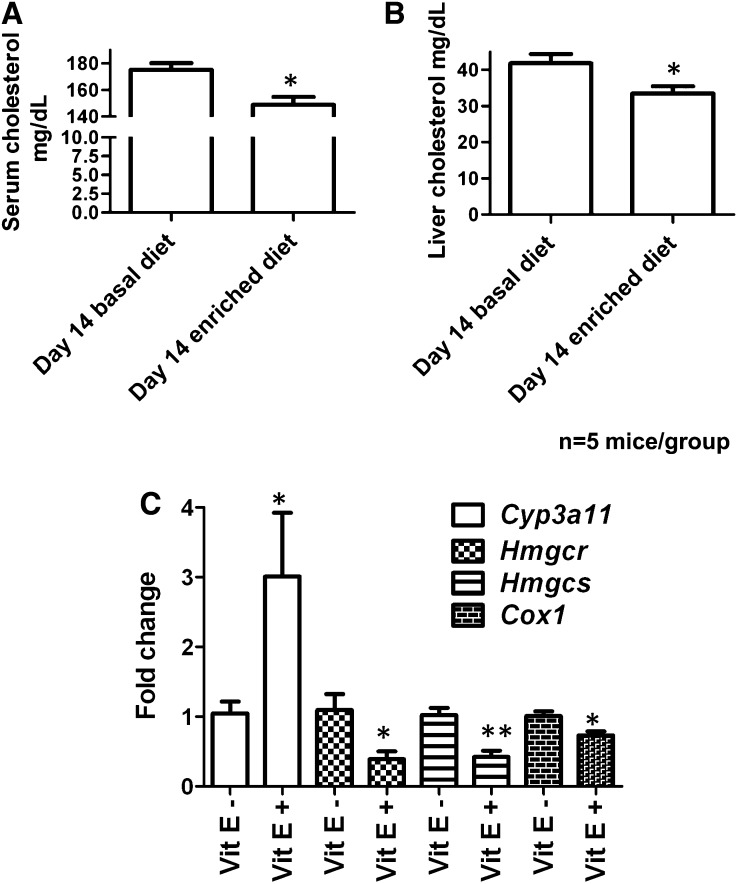
Serum was also collected from the mice and subjected to metabolomic analysis. PCA models showed no separation between predose and 14-d postdose samples, but separation was seen by PLS-DA analysis (2-component, 264 variables, ESI−: R2X = 0.523, R2Y = 0.998, Q2 = 0.869). OPLS-DA models (ESI−: R2X = 0.821, R2Y = 1.000, Q2 = 0.624) showed α-tocopherol glucuronide, which was also observed in the human serum samples. In addition, serum cholesterol was assayed and decreased 15% from 175.2 ± 5.0 to 148.7 ± 5.9 mg/dL (P = 0.0159) after α-tocopherol dosing (Figure 8A). Liver cholesterol was also assayed and was shown to decrease 20%, from 41.8 ± 2.6 to 33.4 ± 1.9 mg/dL (Figure 8B).
FIGURE 8.
Serum cholesterol (A) and liver cholesterol (B) concentrations in mice fed vitamin E–deficient and –enriched diets for 14 d. C: Gene expression analysis by quantitative polymerase chain reaction of genes affected by vitamin E dosing: Cyp3a11, Cox-2, Hmgcr, Hmgcs, and Cox-1. All values are normalized to β-actin and expressed as fold change (mean ± SEM). Significance was determined with the Mann-Whitney U test between the vitamin E–deficient and vitamin E–enriched diets. Two-tailed P value: **P < 0.01, *P < 0.05. Vit E, vitamin E.
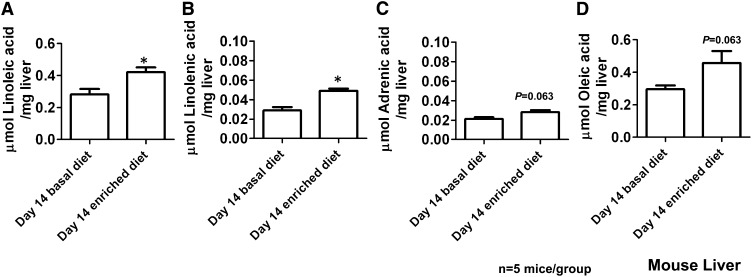
Liver tissues were analyzed by UPLC-ESI-QTOFMS and MDA. PCA models using ESI− mode data showed separation between liver metabolomes (organic fraction) from mice fed the α-tocopherol–deficient diet compared with those fed the α-tocopherol–enriched diets (2-component, 995 variables, R2 = 0.531, Q2 = 0.057). No separation was seen in ESI− or ESI+ in the aqueous liver fractions. PLS-DA models did, however, show good separation when samples were classified by diet, and OPLS-DA models were subsequently made by using the ESI− mode data. Many metabolites highly correlated with α-tocopherol were shown in the organic fractions (ESI−: R2X = 0.929, R2Y = 1.000, Q2 = 0.747). Tandem MS with authentic standards at collision energy of 50 eV showed the upregulated metabolites to be predominantly SFAs, MUFAs, and PUFAs; arachidonic acid; linoleic acid; linolenic acid; adrenic acid; oleic acid; palmitic acid; and DHA (Table 2). Palmitic acid and oleic acid did not fragment but were identified by their retention time. In ESI+ mode, α-tocopherol was increased in the organic fraction. The fatty acids were quantitated by using a UPLC-ESI-QTOFMS platform that is equipped with quantitative Quantof technology (Waters Corp), because it was not possible to perform MRM scans by UPLC–triple-quadrupole tandem MS for all of the fatty acids. Increases in liver fatty acids after 14 d of the vitamin E–enriched diet compared with after the vitamin E–deficient diet were confirmed for linoleic acid (1.3-fold, P = 0.0159) and linolenic acid (1.5-fold, P = 0.0159), and trends were seen for adrenic acid (1.23-fold, P = 0.063) and oleic acid (1.4-fold, P = 0.063), as shown in Figure 9. Arachidonic acid and DHA concentrations were consistent at the 14-d postdose time point, but variable predose concentrations were observed and were thus not significantly increased. Palmitic acid could not be quantitated because of a high background of these fatty acids on the liquid chromatographic system.
TABLE 2.
Endogenous mouse liver metabolites perturbed 14 d after α-tocopherol supplementation, observed by UPLC-ESI-QTOFMS1
| Metabolite | Biofluid | Retention time | Experimental ion mass | Mass error | Formula | Fragments |
| min | ppm | |||||
| Linoleic acid [M-H]− | Liver | 7.5 | 279.2313 | 3.93 | C18H32O2 | 261.2235 |
| Linolenic acid [M-H]− | Liver | 7.26 | 277.2178 | 3.60 | C18H30O2 | 233.2293, 205.1742, 147.0797 |
| Adrenic acid [M-H]− | Liver | 7.81 | 331.2619 | 5.49 | C22H36O2 | 287.2463, 233.2294 |
| Oleic acid [M-H]− | Liver | 7.77 | 281.2444 | 13.20 | C18H34O2 | No fragments |
| Palmitic acid [M-H]− | Liver | 7.43 | 255.2316 | 3.13 | C16H32O2 | No fragments |
| DHA [2M-H]− | Liver | 7.34 | 653.4550 | 3.06 | C22H32O2 | 327.2296, 283.2416, 229.1943 |
| Arachidonic acid [M-H]− | Liver | 7.38 | 303.2324 | 0.00 | C20H32O2 | 259.2418, 205.1953 |
UPLC-ESI-QTOFMS, ultraperformance liquid chromatography–electrospray ionization–quadrupole time-of-flight mass spectrometry.
FIGURE 9.
Mean (±SEM) concentrations of fatty acid metabolites [linoleic acid (A), linolenic acid (B), adrenic acid (C), oleic acid (D)] identified in mouse liver. Significance was determined with a Mann-Whitney U test between the vitamin E–deficient and vitamin E–enriched diets. Two-tailed P value: *P < 0.05.
qPCR analysis of gene expression
Urine, feces, and liver metabolomics indicated upregulation of genes involved in the metabolism and transport of α-tocopherol, fatty acid production, and the linoleic acid/arachidonic acid metabolism pathway. qPCR analysis was carried out to determine whether the expression of genes related to these pathways was changed. This can be seen in Figure 8C. Cyp3a11, which encodes an enzyme involved in ω-oxidation of α-tocopherol, increased 2.9-fold (P = 0.032), as previously reported in mouse and human cell models (9, 12–14). The Cyp4f family of genes was also analyzed (Cyp4f13, 14, 15, 16, and 18) because of previous reports of the involvement of cytochrome P450 4F2 in ω-oxidation of α-tocopherol (15, 16); however, no changes were seen before and after dosing. αTTP, Mdr1a, Mdr1b, and Mdr2, which encode α-tocopherol transporters, showed no changes in expression after α-tocopherol dosing. Hmgcr and Hmgcs, genes that encode enzymes involved in cholesterol production, were downregulated 3.9-fold (P = 0.029) and 2.4-fold (P = 0.016), respectively, and reflect the decrease in serum and liver cholesterol observed. However, Cyp7a1, which is involved in bile acid production from cholesterol, was not changed. Because of the increase in the linoleic acid/arachidonic acid metabolic pathway, genes involved in eicosanoid production were investigated. No change was seen in Alox, but Cox1 was downregulated 1.4-fold (P = 0.032) and Cox2 was upregulated 1.9-fold but was not significantly different between the groups. Fads2, which encodes a fatty acid desaturase in the linolenic acid pathway, was analyzed; however, no changes in expression were seen.
Urinary metabolomic analysis from mice dosed with alpha-CEHC
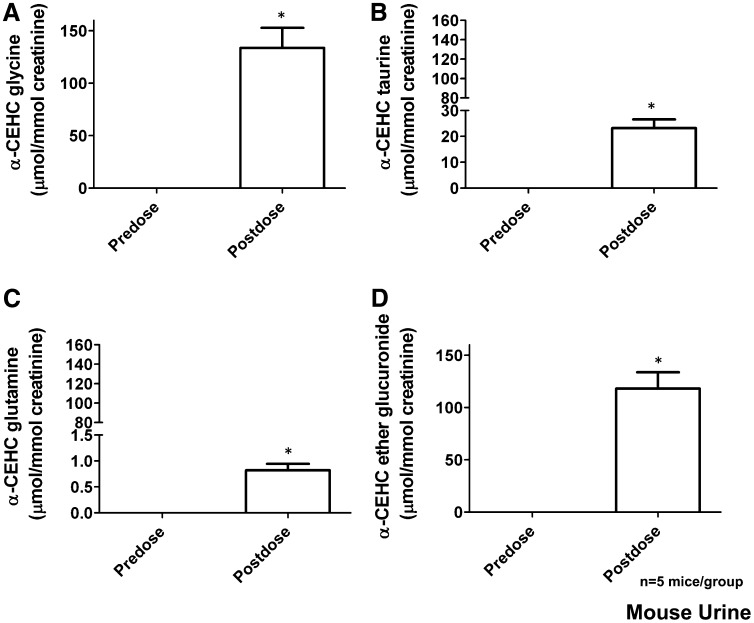
Mice were gavaged with 25 mg α-CEHC/kg to determine all of the possible conjugates of the final oxidized metabolite of α-tocopherol, α-CEHC. MDA was carried out, and models were constructed as for the α-tocopherol dosing studies. The upregulated metabolites related to α-CEHC dosing were confirmed by tandem MS to authentic standards. α-CEHC ether glucuronide, α-CEHC glycine, α-CEHC glycine glucuronide, and α-CEHC taurine were all confirmed as α-CEHC metabolites. A novel metabolite α-CEHC glutamine was also identified, and its fragmentation pattern and structure can be seen in Figure 3, EndashF. α-CMBHC ether glucuronide was not identified. α-CEHC ether glucuronide, α-CEHC glycine, α-CEHC taurine, and α-CEHC glutamine were quantitated by MRM (Figure 10). α-CEHC glycine glucuronide was not quantitated because no authentic standard was available.
FIGURE 10.
Mean (±SEM) concentrations of α-CEHC metabolites [α-CEHC glycine (A), α-CEHC taurine (B), α-CEHC glutamine (C), and α-CEHC ether glucuronide (D)] identified in mouse urine. Significance was determined with a Wilcoxon's matched-pairs signed-rank test between predose and postdose values. Two-tailed P value: *P < 0.05. α-CEHC, α-carboxyethylhydroxychroman.
DISCUSSION
MS-based metabolomics has enabled the discovery of 3 novel urinary metabolites of α-tocopherol in humans and mice—α-CEHC glycine, α-CEHC taurine, and α-CEHC glycine glucuronide—and showed a species difference in metabolism; α-CEHC sulfate and α-CEHC acyl glucuronide were present in human urine only. α-CEHC glutamine was also discovered and is a novel urinary metabolite seen in mice gavaged directly with α-CEHC. Glycine, taurine, and glutamine conjugation is common in humans and part of xenobiotic detoxication; however, glutamine conjugation in mice is very rare and has been reported only in humans, primates, ferrets, rats, rabbits, and hamsters (17, 18). It is possible that a large dose of α-CEHC received through direct gavage to the mice used glycine and taurine stores in the liver and thus required further detoxication by using an additional amino acid conjugate. More likely, however, is that exceptions may be found to the general paradigms of substrate- and species-dependency in amino acid conjugation, especially when ultrasensitive analytic and chemometric tools, such as those applied here, have been used. At the time when glutamine conjugation was first described in the ferret with phenylacetic acid and 4-chlorophenylacetic acid (19), the wisdom was that glutamine conjugation occurred only in humans and certain primates.
A large interindividual variability in α-tocopherol metabolism was observed between the human volunteers, and not all of the metabolites were produced in all of the subjects. This was evidenced by a lack of separation between pre- and postdose urine samples by PCA. α-CEHC taurine, α-CEHC glycine, and α-CEHC acyl glucuronide were present in 50–90% of individuals and had a lower correlation by OPLS-DA compared with α-CEHC ether glucuronide and sulfate, which were present in all individuals. These differences could have been attributed to polymorphisms in drug-metabolizing enzymes and transporters between the individuals and/or competitive cometabolism of endogenous metabolites with gut microflora (20). This high variation was not observed in mice.
Many PUFAs were upregulated in the livers of mice fed the vitamin E–enriched diet, some of which were involved in the linoleic acid/arachidonic acid synthesis pathway; arachidonic acid was previously shown to be increased in human megakaryocytes supplemented with vitamin E (21). Vitamin E is a peroxyl radical scavenger and is therefore an antioxidant. It can protect PUFAs located in membrane phospholipids and serum lipoproteins from reactions with peroxyl radicals, because the peroxyls react faster with vitamin E than with PUFAs. A diet that is supplemented with vitamin E can thus prevent the oxidation of fatty acids (22, 23). One reason for the increase in PUFAs seen with α-tocopherol dosing in this study could be due to protection from oxidation by peroxyl radicals; conversely, those mice fed the vitamin E–deficient diet had lower PUFAs, possibly because of increased oxidation from peroxyl radicals. Other reasons could include decreased mitochondrial fatty acid β-oxidation or decreased export of triglycerides. However, changes in triglyceride concentrations were not observed in serum or liver. An additional cause for increased fatty acids could be upregulation of fatty acid synthesis genes, such as fatty acid desaturases regulated by sterol response element binding protein-1c (24); however, the expression of these genes was not changed with the vitamin E–diet. An increased trend for arachidonic acid could be explained by the regulation of the cyclooxygenase (COX) enzymes. COX-2 expression was not significantly different between the mice fed the 2 different diets; however, COX-1, a constitutive enzyme, had a 1.4-fold higher expression in the mice fed the vitamin E–deficient diet. It is possible that the deficiency of vitamin E resulted in a need to synthesize prostaglandins for regulatory functions from arachidonic acid and thus used arachidonic acid stores in these mice.
Cholesterol concentrations were measured and were decreased in the serum and livers of mice fed the vitamin E–enriched diet. Downregulation of the cholesterol homeostatic genes Hmgcr and Hmgcs was also seen, which was previously shown in human hepatocytes supplemented with α-tocopherol (25). The mechanism of downregulation of these genes, and thus cholesterol production seen in human hepatocytes, was due to attenuation of the transcriptional response of the sterol response elements in the promoter of these genes mediated by sterol response element binding protein-2 (25). Vitamin E was previously shown to decrease steatosis and inflammation in patients with nonalcoholic steatohepatitis (26). In light of our findings, potentially disturbed fatty acid metabolites could be a cause. Indeed, the ratio of MUFAs to SFAs has been shown to be a causative factor in nonalcoholic fatty liver disease (27). Further investigation of this, however, was beyond the scope of this study.
The importance of understanding the exact metabolism of vitamin E should not be underestimated. Vitamin E is underconsumed at the Recommended Dietary Allowance of 15 mg/d by the American population (22); thus, supplements containing vitamin E are readily available in health and drug stores to fulfill this need, and an estimated 35 million Americans choose this option (19, 28). However, these supplements are available with high doses, which can be used in an unregulated manner. Tocopherol is metabolized though phase 1 and 2 cytochrome P450 enzymes to produce hydrophilic metabolites, which can be easily excreted. These enzymes also detoxicate xenobiotics from the body. Therefore, coadministration of xenobiotics with high doses of vitamin E could potentially affect xenobiotic metabolism and bioavailability. There is also the concern of endogenous effects to consider with high-dose vitamin E dietary supplements. Vitamin E has been used in many clinical trials in the hope that it might ameliorate diseases such as cancer and cardiovascular disease. Many contradictory effects have been seen. Here, we have shown that α-tocopherol can affect the regulation of genes and the metabolic pool of some important metabolites. Further studies are required to ascertain the long-term effect on the individuals administered high-dose vitamin E supplements. Mouse models are ideal for this purpose because it is possible to ascertain the molecular mechanisms of vitamin E interactions. Because humans are highly susceptible to biological changes resulting from genomic, environmental, and gut microfloral factors, studies in gnotobiotic, humanized, and gene knockout mice would be of considerable value.
Acknowledgments
The authors’ responsibilities were as follows—OS, JRI, and CHJ: designed the research; CHJ, KWK, and J-HK: conducted the metabolomic studies and gene expression research; OS: collected the human urine samples; DWK and HL: provided the essential materials; CHJ and ADP: analyzed the metabolomic data; CHJ, FJG, and JRI: wrote the manuscript; and JRI: had primary responsibility for the final content. None of the authors had a conflict of interest.
Footnotes
Abbreviations used: COX, cyclooxygenase; ESI, electrospray ionization; MDA, multivariate data analysis; MRM, multiple reaction monitoring; MS, mass spectrometry; NCI, National Cancer Institute; OPLS-DA, orthogonal projection to latent structures discriminant analysis; PCA, principal components analysis; PLS-DA, projection to latent structures discriminant analysis; qPCR, quantitative polymerase chain reaction; UPLC, ultraperformance liquid chromatography; UPLC-ESI-QTOFMS, ultraperformance liquid chromatography–electrospray ionization–time-of-flight mass spectrometry; α-CEHC, α-carboxyethylhydroxychroman; α-CMBHC, α-carboxymethylbutylhydroxychroman.
REFERENCES
- 1.Klein EA, Thompson IM, Jr, Tangen CM, Crowley JJ, Lucia MS, Goodman PJ, Minasian LM, Ford LG, Parnes HL, Gaziano JM, et al. Vitamin E and the risk of prostate cancer: the Selenium and Vitamin E Cancer Prevention Trial (SELECT). JAMA 2011;306(14):1549–56 [DOI] [PMC free article] [PubMed] [Google Scholar]
- 2.The Alpha-Tocopherol, Beta Carotene Cancer Prevention Study Group The effect of vitamin E and beta carotene on the incidence of lung cancer and other cancers in male smokers. N Engl J Med 1994;330:1029–35 [DOI] [PubMed] [Google Scholar]
- 3.Gaziano JM, Glynn RJ, Christen WG, Kurth T, Belanger C, MacFadyen J, Bubes V, Manson JE, Sesso HD, Buring JE. Vitamins E and C in the prevention of prostate and total cancer in men: the Physicians’ Health Study II randomized controlled trial. JAMA 2009;301(1):52–62 [DOI] [PMC free article] [PubMed] [Google Scholar]
- 4.Johnson CH, Patterson AD, Idle JR, Gonzalez FJ. Xenobiotic metabolomics: major impact on the metabolome. Annu Rev Pharmacol Toxicol 2012;52:37–56 [DOI] [PMC free article] [PubMed] [Google Scholar]
- 5.Cho JY, Kang DW, Ma X, Ahn SH, Krausz KW, Luecke H, Idle JR, Gonzalez FJ. Metabolomics reveals a novel vitamin E metabolite and attenuated vitamin E metabolism upon PXR activation. J Lipid Res 2009;50:924–37 [DOI] [PMC free article] [PubMed] [Google Scholar]
- 6.Eitenmiller RR, Lee J. Food composition—vitamin E. In: Vitamin E: food chemistry, composition, and analysis. New York, NY: Marcel Dekker, 2004:480.
- 7.Johnson CH, Patterson AD, Krausz KW, Lanz C, Kang DW, Luecke H, Gonzalez FJ, Idle JR. Radiation metabolomics. 4. UPLC-ESI-QTOFMS-based metabolomics for urinary biomarker discovery in gamma-irradiated rats. Radiat Res 2011;175(4):473–84 [DOI] [PMC free article] [PubMed] [Google Scholar]
- 8.Johnson CH, Patterson AD, Krausz KW, Kalinich JF, Tyburski JB, Kang DW, Luecke H, Gonzalez FJ, Blakely WF, Idle JR. Radiation metabolomics. 5. Identification of urinary biomarkers of ionizing radiation exposure in non-human primates by MS-based metabolomics. Radiat Res ( in press ) [DOI] [PMC free article] [PubMed] [Google Scholar]
- 9.Birringer M, Pfluger P, Kluth D, Landes N, Brigelius-Flohé R. Identities and differences in the metabolism of tocotrienols and tocopherols in HepG2 cells. J Nutr 2002;132:3113–8 [DOI] [PubMed] [Google Scholar]
- 10.Yu Z, Kastenmuller G, He Y, Belcredi P, Moller G, Prehn C, Mendes J, Wahl S, Roemisch-Margl W, Ceglarek U, et al. Differences between human plasma and serum metabolite profiles. PLoS One 2011;6(7):e21230. [DOI] [PMC free article] [PubMed] [Google Scholar]
- 11.Nowell SA, Leakey JE, Warren JF, Lang NP, Frame LT. Identification of enzymes responsible for the metabolism of heme in human platelets. J Biol Chem 1998;273:33342–6 [DOI] [PubMed] [Google Scholar]
- 12.Birringer M, Drogan D, Brigelius-Flohé R. Tocopherols are metabolized in HepG2 cells by side chain omega-oxidation and consecutive beta-oxidation. Free Radic Biol Med 2001;31(2):226–32 [DOI] [PubMed] [Google Scholar]
- 13.Mustacich DJ, Gohil K, Bruno RS, Yan M, Leonard SW, Ho E, Cross CE, Traber MG. Alpha-tocopherol modulates genes involved in hepatic xenobiotic pathways in mice. J Nutr Biochem 2009;20(6):469–76 [DOI] [PMC free article] [PubMed] [Google Scholar]
- 14.Traber MG, Siddens LK, Leonard SW, Schock B, Gohil K, Kruger SK, Cross CE, Williams DE. Alpha-tocopherol modulates Cyp3a expression, increases gamma-CEHC production, and limits tissue gamma-tocopherol accumulation in mice fed high gamma-tocopherol diets. Free Radic Biol Med 2005;38(6):773–85 [DOI] [PubMed] [Google Scholar]
- 15.Sontag TJ, Parker RS. Influence of major structural features of tocopherols and tocotrienols on their omega-oxidation by tocopherol-omega-hydroxylase. J Lipid Res 2007;48(5):1090–8 [DOI] [PubMed] [Google Scholar]
- 16.Sontag TJ, Parker RS. Cytochrome P450 omega-hydroxylase pathway of tocopherol catabolism. Novel mechanism of regulation of vitamin E status. J Biol Chem 2002;277:25290–6 [DOI] [PubMed] [Google Scholar]
- 17.Knights KM, Sykes MJ, Miners JO. Amino acid conjugation: contribution to the metabolism and toxicity of xenobiotic carboxylic acids. Expert Opin Drug Metab Toxicol 2007;3:159–68 [DOI] [PubMed] [Google Scholar]
- 18.Hirom PC, Idle JR, Millburn P, Williams RT. Glutamine conjugation of phenylacetic acid in the ferret. Biochem Soc Trans 1977;5:1033–5 [DOI] [PubMed] [Google Scholar]
- 19.Idle JR, Millburn P, Williams RT. Taurine conjugates as metabolites of arylacetic acids in the ferret. Xenobiotica 1978;8:253–64 [DOI] [PubMed] [Google Scholar]
- 20.Clayton TA, Baker D, Lindon JC, Everett JR, Nicholson JK. Pharmacometabonomic identification of a significant host-microbiome metabolic interaction affecting human drug metabolism. Proc Natl Acad Sci USA 2009;106:14728–33 [DOI] [PMC free article] [PubMed] [Google Scholar]
- 21.Chan AC, Wagner M, Kennedy C, Chen E, Lanuville O, Mezl VA, Tran K, Choy PC. Vitamin E up-regulates arachidonic acid release and phospholipase A2 in megakaryocytes. Mol Cell Biochem 1998;189:153–9 [DOI] [PubMed] [Google Scholar]
- 22.Traber MG. Vitamin E regulatory mechanisms. Annu Rev Nutr 2007;27:347–62 [DOI] [PubMed] [Google Scholar]
- 23.Institute of Medicine Dietary Reference Intakes for vitamin C, vitamin E, selenium, and carotenoids. Washington, DC: National Academy Press, 2000 [PubMed] [Google Scholar]
- 24.Horton JD, Goldstein JL, Brown MS. SREBPs: activators of the complete program of cholesterol and fatty acid synthesis in the liver. J Clin Invest 2002;109:1125–31 [DOI] [PMC free article] [PubMed] [Google Scholar]
- 25.Valastyan S, Thakur V, Johnson A, Kumar K, Manor D. Novel transcriptional activities of vitamin E: inhibition of cholesterol biosynthesis. Biochemistry 2008;47:744–52 [DOI] [PMC free article] [PubMed] [Google Scholar]
- 26.Sanyal AJ, Chalasani N, Kowdley KV, McCullough A, Diehl AM, Bass NM, Neuschwander-Tetri BA, Lavine JE, Tonascia J, Unalp A, et al. Pioglitazone, vitamin E, or placebo for nonalcoholic steatohepatitis. N Engl J Med 2010;362(18):1675–85 [DOI] [PMC free article] [PubMed] [Google Scholar]
- 27.Li ZZ, Berk M, McIntyre TM, Feldstein AE. Hepatic lipid partitioning and liver damage in nonalcoholic fatty liver disease: role of stearoyl-CoA desaturase. J Biol Chem 2009;284(9):5637–44 [DOI] [PMC free article] [PubMed] [Google Scholar]
- 28.Ford E, Ajani U, Mokdad A. Brief communication: the prevalence of high intake of vitamin E from the use of supplements among U.S. adults. Ann Intern Med 2005;143(2):116–20 [DOI] [PubMed] [Google Scholar]


