Abstract
Previous cochlear implant studies using isolated electrical stimulus pulses in animal models have reported that intracochlear monopolar stimulus configurations elicit broad extents of neuronal activation within the central auditory system—much broader than the activation patterns produced by bipolar electrode pairs or acoustic tones. However, psychophysical and speech reception studies that use sustained pulse trains do not show clear performance differences for monopolar versus bipolar configurations. To test whether monopolar intracochlear stimulation can produce selective activation of the inferior colliculus, we measured activation widths along the tonotopic axis of the inferior colliculus for acoustic tones and 1,000-pulse/s electrical pulse trains in guinea pigs and cats. Electrical pulse trains were presented using an array of 6–12 stimulating electrodes distributed longitudinally on a space-filling silicone carrier positioned in the scala tympani of the cochlea. We found that for monopolar, bipolar, and acoustic stimuli, activation widths were significantly narrower for sustained responses than for the transient response to the stimulus onset. Furthermore, monopolar and bipolar stimuli elicited similar activation widths when compared at stimulus levels that produced similar peak spike rates. Surprisingly, we found that in guinea pigs, monopolar and bipolar stimuli produced narrower sustained activation than 60 dB sound pressure level acoustic tones when compared at stimulus levels that produced similar peak spike rates. Therefore, we conclude that intracochlear electrical stimulation using monopolar pulse trains can produce activation patterns that are at least as selective as bipolar or acoustic stimulation.
Keywords: cochlear implant, auditory midbrain, neurophysiology, electrical stimulation
Introduction
Monopolar electrical stimulation (one intracochlear stimulating contact and an extracochlear return contact) delivered by a cochlear implant has been reported to elicit neuronal activation that is broadly distributed across the tonotopic frequency organization of the auditory system. In comparison, acoustic stimulation has been shown to produce relatively narrow, selective distributions of neuronal activity. This has been demonstrated in animal studies in which neuronal responses to acoustic and monopolar electrical stimulation were recorded in the auditory nerve (Kral et al. 1998) and inferior colliculus (IC; Snyder et al. 1990, 2004, 2008; Middlebrooks and Snyder 2007). Comparisons of neuronal responses to monopolar electrical stimulation and bipolar electrical stimulation (one intracochlear stimulating contact and a second intracochlear return contact) have shown mixed results. The majority of studies have shown more broadly distributed neuronal activation for monopolar than for bipolar intracochlear stimulation, including studies in the auditory nerve (van den Honert and Stypulkowski 1987; Kral et al. 1998), inferior colliculus (Merzenich and White 1977; Snyder et al. 1990, 2004, 2008; Middlebrooks and Snyder 2007), and auditory cortex (Bierer and Middlebrooks 2002); but a few studies have shown similar neuronal activation patterns for monopolar and bipolar stimulation at low to moderate stimulus intensities (Liang et al. 1999; Rebscher et al. 2001; Smith and Delgutte 2007).
In contrast, studies of human cochlear implant users have shown that they perform at least as well with monopolar stimulation as with bipolar stimulation on speech reception tasks (Zwolan et al. 1996; Kileny et al. 1998; Pfingst et al. 2001). Furthermore, many cochlear implant users can pitch-rank monopolar electrodes (Boex et al. 2006), suggesting relatively selective neuronal activation using monopolar stimulation.
These apparent discrepancies between studies of speech reception in humans and the extent of neuronal activation in animals could be caused by differences in the applied stimuli. Specifically, one potentially important difference is that human studies have used electrical pulse trains delivered at medium to high pulse rates (250 pulses/s, 1,000 pulses/s or higher; Zwolan et al. 1996; Kileny et al. 1998; Pfingst et al. 2001; Friesen et al. 2005), whereas animal studies typically have used single electrical pulses delivered at low repetition rates (due to difficulties with overlapping of responses and stimulus artifacts at higher repetition rates). It is known that the extent of IC responses to sustained acoustic tones narrows after the initial, broader “onset” response (Harris et al. 1997). We hypothesized that, in a similar fashion, electrical pulse trains delivered to the auditory nerve by a cochlear implant would elicit broad onset responses followed by narrower sustained responses (Snyder and Bonham 2007).
Another difference in stimuli is that human cochlear implant studies have used comfortable or loudness-balanced levels (Shannon 1983a; Morris and Pfingst 2000), whereas animal studies of neuronal activation have typically compared responses at equal decibel levels above threshold (Snyder et al. 2008). It has been shown that monopolar stimulation elicits selective neural activation at lower current levels and over a narrower dynamic range than bipolar stimulation (Ryan et al. 1990; Snyder et al. 2008). Furthermore, it is not clear that comparing responses to monopolar and bipolar stimuli at equal levels above threshold is equivalent to comparing them at equal loudness. Perceptual loudness is not simply related to physiological spike rate, even in the auditory nerve (Relkin and Doucet 1997), and at more central stations factors such as adaptation can influence the neuronal representation of sound level (Dean et al. 2005). Though it is a subject of ongoing investigation (Chen et al. 2011), the relationship of perceptual loudness to physiological measures is unknown. Consequently, instead of attempting to balance loudness in our studies of anesthetized animals, we compared the selectivity of stimuli by using levels that produced similar peak spike rates. We hypothesized that comparing responses to monopolar and bipolar stimuli that elicit similar peak spike rates would show that they elicit similarly selective activation widths—results that would better correspond to the human psychophysical findings.
By recording neuronal responses to acoustic tones and 1,000-pulse/s electrical pulse trains in guinea pigs and cats, the present study sought to determine whether sustained monopolar intracochlear stimulation can produce selective activation of the inferior colliculus. First, we asked whether the tonotopic extent of inferior colliculus activation produced by 1,000-pulse/s monopolar electrical stimuli is narrower for the sustained response than for the onset response. Second, for levels that produce similar peak spike rates, do sustained periods of monopolar, bipolar, and acoustic stimulation produce similar extents of inferior colliculus activation?
Methods
In these experiments, we recorded neuronal activity in the central nucleus of the inferior colliculus in response to acoustic and intracochlear electrical stimuli in three adult guinea pigs and eight adult cats. All procedures were approved by the University of California, San Francisco Institutional Animal Care and Use Committee.
Anesthesia and surgery: acute neurophysiology experiments
Guinea pigs
Procedures for positioning a multisite recording probe in the inferior colliculus and recording responses to acoustic and electrical stimuli in guinea pigs were similar to those described in a previous study (Snyder et al. 2004). In brief, guinea pigs were anesthetized with a mixture of ketamine and xylazine while the heart rate, respiratory rate, and core body temperature were monitored. An intratracheal canula was placed via a tracheostomy to ensure a clear airway. The skin over the calvarium was incised and the head was held stationary by a bar affixed to the calvarium with bone screws and dental acrylic. The right ear was deafened by puncturing the tympanic membrane and mechanical dislocation of the ossicular chain. After reflecting the right temporalis muscle, a portion of the skull about 1 cm in diameter was thinned with a dental burr and elevated. The underlying cortex was then aspirated to expose the right inferior colliculus.
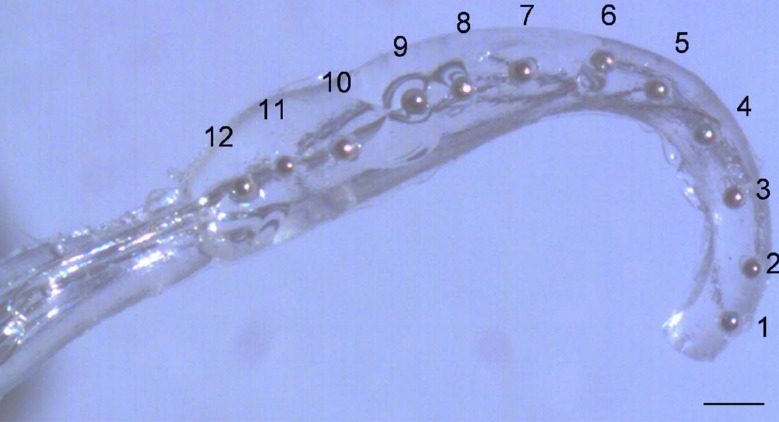
Each guinea pig was transferred to a sound-proof recording booth, and a silicon recording probe (NeuroNexus Technologies, Ann Arbor, MI, USA) with 32 linearly spaced recording sites was inserted along the tonotopic axis of the IC central nucleus at an angle of approximately 40° from vertical in the coronal plane using a micromanipulator. Calibrated acoustic stimuli were delivered to the left ear canal near the tympanic membrane through a sealed interface. Responses to acoustic tones from 500 Hz to 32 kHz were recorded, and the depth of the recording probe was increased until all but the deepest recording sites showed responses to the acoustic stimuli. Multiple IC penetrations were sometimes necessary to find a location with robust sustained responses. Once such a location was found, the cortical deficit was filled with agar and the recording probe was fixed to the skull with dental acrylic and sticky wax. Responses to acoustic tones were recorded, then the animal was rotated to allow access to the left ear. The left round window was exposed and the left cochlea was deafened by intracochlear infusion of two to three drops of 10 % neomycin sulfate in saline. A space-filling intracochlear stimulating electrode carrier with a linear array of 10–12 hemispherical platinum–iridium (90:10) contacts with diameters of about 150 μm (Fig. 1; Rebscher et al. 2007) was inserted into the scala tympani through the round window, and responses to electrical stimuli were recorded.
FIG. 1.
Guinea pig intracochlear stimulating electrode. Monopolar (MP) channel numbering convention is MP 1–12 from apical to basal. Bipolar (BP) numbering convention is BP 2,1 where 2 is the stimulating contact and 1 is the return contact. Contact spacing is 0.5 mm for guinea pigs and 1 mm for cats (cat array has six to eight contacts). Scale bar 0.5 mm.
Cats
Surgical procedures for the IC exposure, deafening, implantation, and adjustment of the depth of the recording probe in the IC were identical to those used for guinea pigs with the following exceptions. Cats were pre-anesthetized with inhaled isoflurane, and a surgical plane of anesthesia was induced with intravenous sodium pentobarbital in lactated Ringer’s solution delivered by an infusion pump. Cat intracochlear stimulating arrays were comparable to those used in guinea pigs, except that they had a linear array of six to eight hemispherical contacts (diameter, 250–350 μm) and were specifically designed for the cat cochlea (Rebscher et al. 2007). That is, the silicone rubber carriers were molded to be relatively space filling within the basal turn of the cat scala tympani. The stimulating contacts were positioned at 1-mm intervals (roughly one critical band distance in the cat cochlea). Of the eight cats studied, two had normal hearing prior to the experiment (referred to hereafter as normal cats), and six were deafened prior to the onset of hearing (by administration of an ototoxic drug) and chronically implanted with intracochlear stimulating electrode arrays (with varying electrical stimulation regimens and drug treatments, see “Appendix” section). In the six chronically deafened cats, the depth of the IC recording probe was determined by presenting electrical pulses on the most basal channel of the stimulating array and increasing the depth of the recording probe until there were responses on all but the deepest and most superficial recording sites. This method of placing the recording probe made it likely that the recording sites were primarily or exclusively in the central nucleus of the IC.
Stimulus generation
Calibration methods and apparatus for generating acoustic and electrical stimuli were similar to those described previously (Snyder et al. 2004). In brief, stimuli were generated under the control of a personal computer and synthesized digitally by a dedicated digital signal processor (Multi I/O Processor RX8, Tucker Davis Technologies, Alachua, FL, USA) with 100 kilosample/s time resolution and 16-bit precision. The level of acoustic stimuli was controlled using a programmable digital attenuator (PA5, Tucker Davis Technologies). These stimuli were amplified by an audio amplifier (Servo 170, Samsung Electronics, Ridgefield Park, NJ, USA), and delivered to the animals via a speaker and an ear bar through a sealed interface. Calibration of the acoustic level at each frequency was performed using a probe microphone (type 4182, B&K, Buffalo, NY, USA) with the probe positioned in the ear bar. Electrical stimuli were delivered via an eight-channel optically isolated voltage-to-current converter under the control of the RX8 digital signal processor. The specific acoustic and electrical stimuli used in the present study are described below.
Acoustic stimuli
Tones from 500 Hz to 32 kHz with 50 ms duration and 2–3 ms cosine on/off ramps (levels 0 dB sound pressure level (SPL) to 70 dB SPL, frequencies and levels in pseudorandomized order) were presented in the guinea pigs and normal cats to determine at each IC recording site its characteristic frequency (CF, that frequency which elicits a response at the lowest stimulus level). Next, tones from 5 kHz to at least 20 kHz (1/4 octave spacing) were presented with a duration of 200 ms. In guinea pigs, tones were presented at a single intensity of 60 dB SPL; in cats, they were presented at 40, 60, and 80 dB SPL.
Electrical stimuli
Electrical pulse trains were presented in either a monopolar or bipolar stimulus configuration. Numbering convention for monopolar and bipolar channels are described in Figure 1. Pulse trains were delivered at 1,000 pulses/s with 200 ms duration, and each pulse was charge-balanced biphasic with the cathodic phase first (40 μs per phase and 20 μs interphase gaps). Stimulus levels were from −2 dB SL (sensation level or level relative to the lowest response threshold in the IC) to at least 6 dB SL with 2-dB steps in guinea pigs and 1-dB steps in cats (in one cat, 2-dB steps were used). Channels that could not deliver stimuli at 6 dB SL without causing stimulation of the facial nerve were excluded.
Multisite recording
Probes used for IC recording had 32 linearly spaced recording sites with areas of 413 or 177 μm2 (NeuroNexus Technologies). Intersite distances of 50 μm were used for guinea pigs and 100 μm for cats. These intersite distances were chosen to place at least one recording site in each IC frequency band lamina (Schreiner and Langner 1997), while spanning the relevant portion of the IC frequency axis. Neuronal signals were acquired with a custom-designed amplification and data acquisition system (Schoenecker and Bonham 2008). Stimulus artifacts were removed offline in software by blanking the artifacts during stimulus times (Schoenecker and Bonham 2008). Responses to acoustic and electrical stimuli were processed identically to facilitate comparisons between them. On most recording sites, spikes from several undiscriminated neurons (multi unit clusters) were detected by setting a voltage threshold at 3.5 times the root-mean-squared prestimulus voltage on each recording site (this threshold criterion was chosen empirically to limit the number of threshold crossings due to thermal noise). When the recorded voltage crossed this threshold, a spike time was registered. On some recording sites, spikes from one or a small number of neurons could be isolated based on their large spike amplitudes by empirically selecting a higher detection threshold.
Data analysis
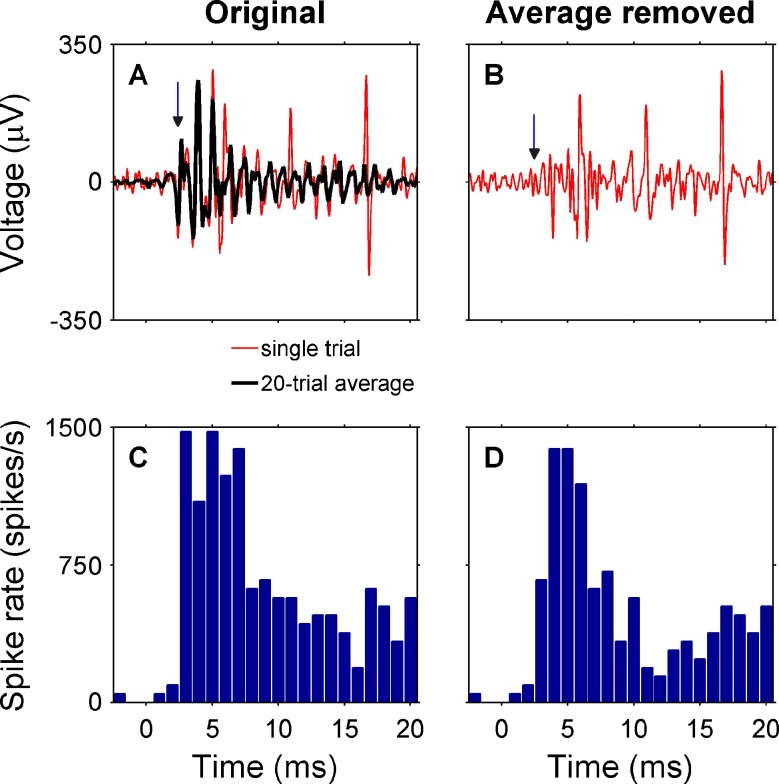
To remove nonspike, stimulus-evoked activity from the recorded waveforms, we used a template subtraction technique (Fig. 2) that has been used in previous studies of IC responses to cochlear implant stimulation in cats (JC Middlebrooks, personal communication, 2010). A template was formed by averaging the responses to all the trials for a given stimulus condition, and this template was subtracted from each single trial waveform.
FIG. 2.
Template subtraction procedure. For each stimulus condition, a template of the across-trial average was subtracted from each single-trial waveform. A Initial response at one IC recording site to a 200-ms intracochlear pulse train in a cat (monopolar channel 4, 350 μA, 2 dB SL). At 3 ms, there is a small peak (indicated by the vertical arrow) that is very consistent from trial to trial. It has shorter than 4-ms latency, very little trial-to-trial jitter, and variable amplitude with stimulus level (not shown), all characteristics that make it unlikely to be an inferior colliculus spike. B After subtracting the average template from the single-trial waveform, the peak at 3-ms (arrow) has been eliminated. C A PSTH (20 trials) of the original responses shows a prominent peak at 3 ms. D After subtracting the average template, the PSTH peak at 3-ms has been attenuated.
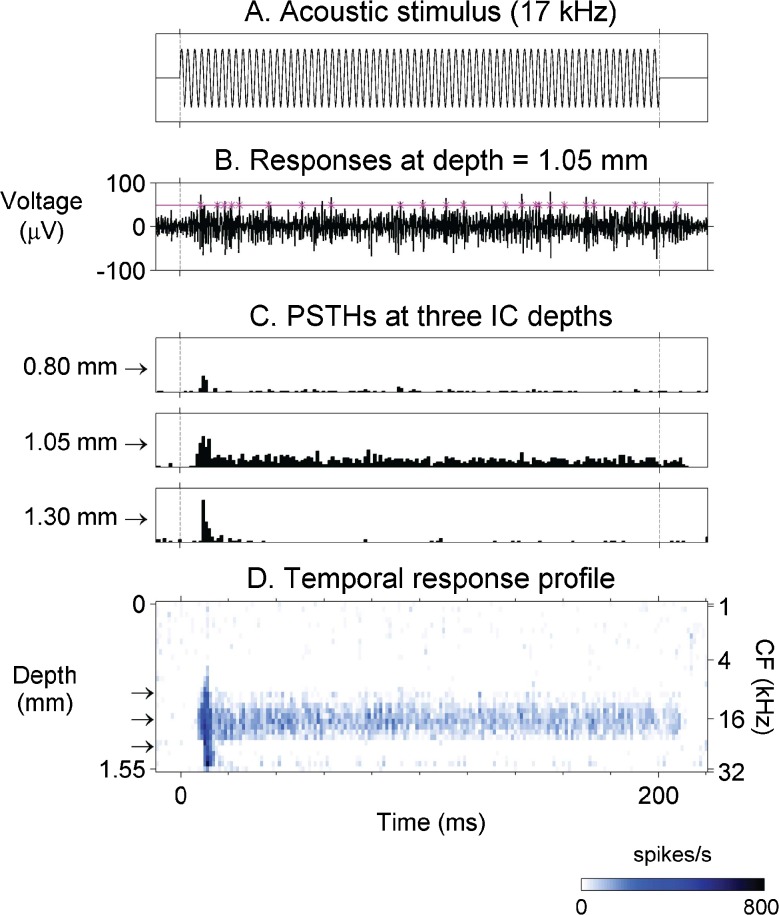
Temporal response profiles were constructed for each stimulus condition (Fig. 3) in order to visualize both the spatial distribution of neuronal activity across the tonotopic axis of the IC and changes in this activity over the duration of the stimulus. First, poststimulus time histograms (PSTHs) were constructed for responses at each recording site. Next, the mean spontaneous spike rate was subtracted from the PSTH bins (to emphasize driven activity). Then, for damaged recording sites with open or short circuits on the recording probe (two out of 32 sites on average) PSTHs were interpolated from recordings on adjacent sites. Finally, the PSTHs for the 32 recording sites were arranged in depth order to form a temporal response profile.
FIG. 3.
Construction of temporal response profiles. A Stimulus was a 60 dB SPL pure tone at 17 kHz; dotted vertical lines indicate stimulus on and off times. B Multi-unit activity elicited by stimulus in (A) recorded on one of 32 linearly spaced recording sites positioned along the tonotopic axis (depth) of the IC. Horizontal line indicates spike detection threshold and asterisks indicate threshold crossings. C PSTHs were computed from spike times at each recording site depth (three examples of the 32 site PSTHs are shown here). Depths at the left of each panel are relative to the most superficial recording site. D The 32 PSTHs were assembled in depth order to form a temporal response profile. Each row in the profile shows a PSTH at a given depth, with response strength indicated by color. Arrows indicate depths of the PSTHs shown in (C). CF (right axis) is the frequency that elicits a response at the lowest stimulus level for a given IC recording depth (IC inferior colliculus, PSTH post-stimulus time histogram, CF characteristic frequency).
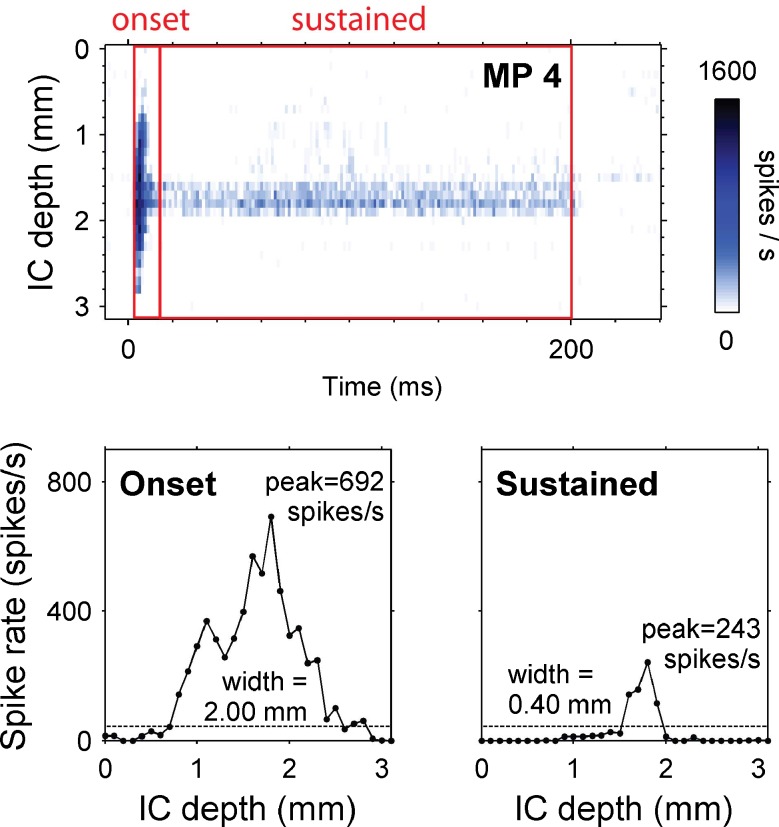
To provide a quantitative characterization of onset and sustained responses, peak spike rates and activation widths were computed for each stimulus condition. Onset time windows (10 ms in duration) began 7 ms after stimulus onset for acoustic stimuli and 4 ms after electrical stimulus onset. Sustained time windows (200 ms in duration) began 17 ms after acoustic stimulus onset and 14 ms after electrical stimulus onset. Peak spike rate for each time window was defined as the highest spike rate on any IC recording site (Figs. 4 and 5). To determine activation width, first we defined a spike rate criterion, chosen to be five times the mean spontaneous spike rate (after deafening), averaged across all recording sites. Various other criteria have been proposed in previous studies including normalized spike rate (Snyder et al. 2004), audiovisual threshold (Rebscher et al. 2001), and a d’ measure (Middlebrooks and Snyder 2008). Our criterion was chosen empirically by examining sustained responses to acoustic tones. We chose five times the mean spontaneous rate because it was consistently above the spontaneous rate of all the recording sites yet below the peak sustained firing rate for a 60 dB SPL acoustic tone. Using a separate spike rate criterion for each recording site based on its spontaneous firing rate did not change our findings; therefore, we used the mean spontaneous rate across recording sites for simplicity of presentation. The activation width for each time window was calculated by counting the number of recording sites with responses exceeding the spike rate criterion and multiplying this count by the intersite spacing (Fig. 4). A few stimulus channels elicited neuronal activation that was centered near the edge of the IC recording array. For these channels, it was not possible to measure accurate activation widths so they were excluded from the analysis.
FIG. 4.
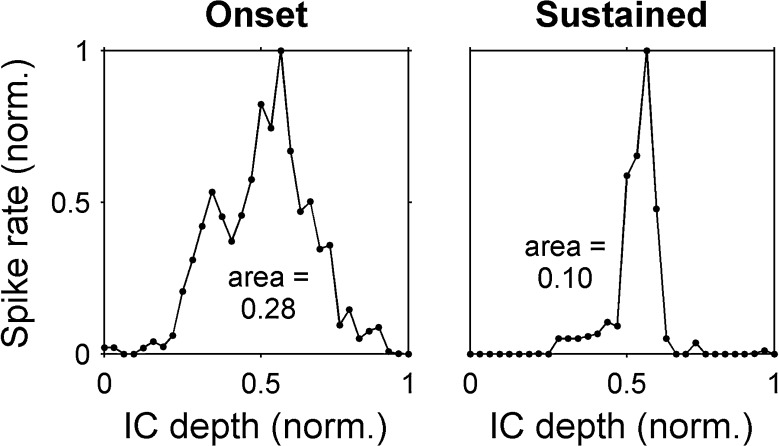
Activation width and peak spike rate calculations. Top panel: temporal response profile for a 200-ms pulse train on monopolar channel 4 in a cat (level = 500 μA, 6 dB SL, stimulus begins at 0 ms). Onset and sustained time windows are 4–14 and 14–200 ms, respectively. Bottom panels spike rate versus IC depth averaged over the onset time window (left) and sustained time window (right). Each data point shows the spike rate from one IC recording site. Activation width is calculated by counting the number of recording sites with spike rates above the spike rate criterion (dotted line five times the mean spontaneous rate averaged across all recording sites) and multiplying this count by the recording site spacing (50 μm in guinea pigs and 100 μm in cats).
FIG. 5.
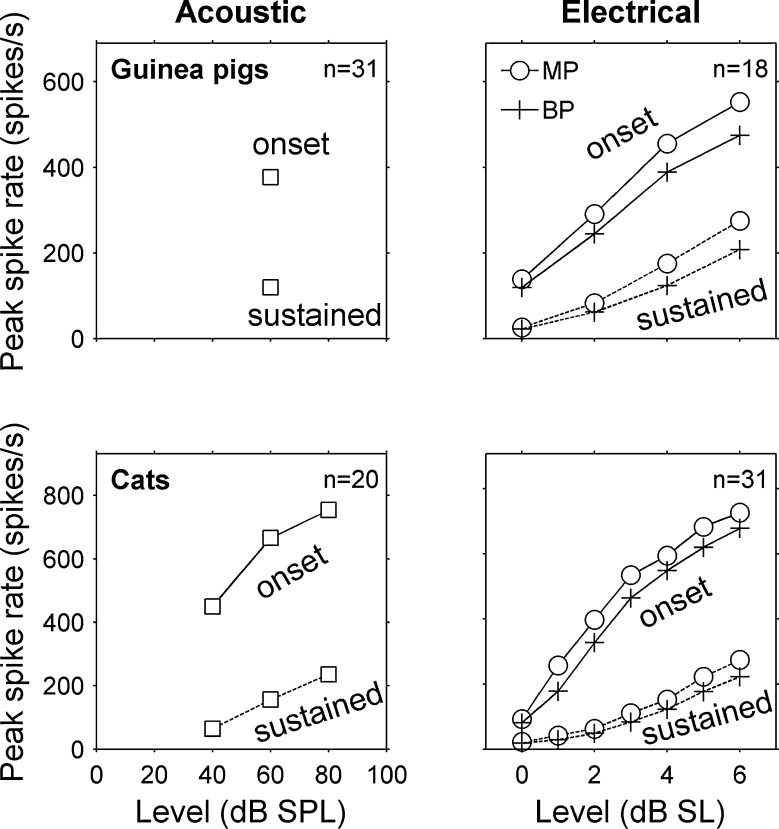
Peak spike rate increased with stimulus level in guinea pigs and cats. Acoustic data are means from 31 stimulus frequencies at one level (60 dB SPL) in three guinea pigs and 20 stimulus frequencies at three levels (40, 60, and 80 dB SPL) in two cats. Monopolar and bipolar data are means from 18 stimulus channels in three guinea pigs and 31 stimulus channels in eight cats. Individual rate-level functions that contributed to the means were consistently monotonic as well (not shown).
Activation widths for both acoustic and electrical stimuli were expressed also in octaves. To calculate the number of octaves per millimeter of IC depth, a regression slope was computed for characteristic frequency versus depth in the IC central nucleus of the guinea pigs and normal hearing cats. The mean slopes of the regression lines were 2.8 octaves per millimeter in guinea pigs and 2 octaves per millimeter in cats. The mean slope for the normal hearing cats was also used as an estimate of the slope for the chronically deafened cats. Activation widths in millimeters were multiplied by these mean slopes to obtain widths in octaves.
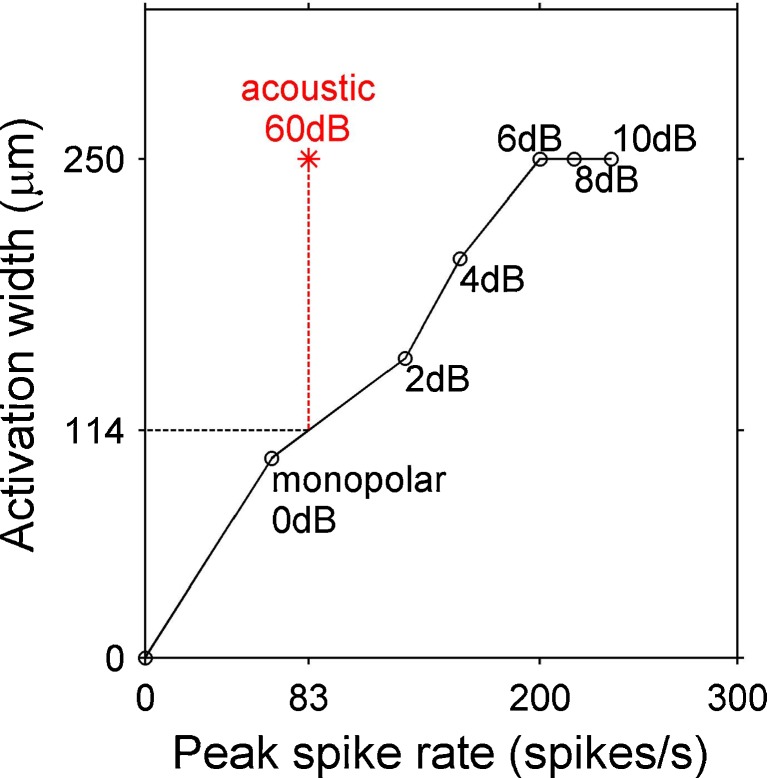
Activation widths for electrical and acoustic stimuli were compared at equal peak spike rates by interpolating responses to increasing electrical stimulus levels (Fig. 6). First, for each monopolar stimulus channel, an acoustic frequency was chosen that elicited activation at a similar location in the inferior colliculus. Then, the activation width and peak spike rate for this acoustic tone frequency at 60 dB SPL were calculated. Because it was not clear whether peak spike rates from the onset or sustained time window were more appropriate for level matching, we used the onset peak rates when comparing onset activation widths and the sustained peak rates when comparing sustained activation widths. Next, the activation width and peak spike rate for the monopolar stimulus channel were calculated at various stimulus levels and plotted with the activation width on the ordinate and the peak spike rate on the abscissa. Finally, the monopolar activation width versus peak spike rate plot was interpolated to find the monopolar activation width that corresponded to the peak spike rate evoked by the 60-dB tone. This procedure was also used to compare each bipolar stimulus channel with a matching 60-dB acoustic tone. Comparisons between electrical and acoustic stimuli were not made in one of the two normal cats because connecting the electrical current stimulator to this cat raised the background noise levels markedly. This increase in noise did not occur in any of the other cats or in the guinea pigs.
FIG. 6.
Comparison of activation widths for equal peak spike rates. Sustained activation widths versus peak spike rates are plotted for a monopolar stimulus channel (MP 5) at levels from 0 to 10 dB SL and for a 60 dB SPL, 8.5-kHz acoustic tone, which produced a peak excitation at roughly the same inferior colliculus depth. The acoustic tone evoked a peak spike rate of 83 spikes/s and an activation width of 250 μm. The monopolar activation width (114 μm) at that same peak spike rate was found by interpolating between the points at 0 dB SL and 2 dB SL. This procedure was also used for comparing acoustic to bipolar stimuli, and for comparing monopolar to bipolar stimuli at equal peak spike rates.
In addition to the electrical vs. acoustic comparisons, monopolar vs. bipolar comparisons were made at equal stimulus levels (in decibel SL) and at equal peak spike rates. Only monopolar and bipolar channels that had the same stimulating contacts were paired (e.g., MP 2 was paired with BP 2,1). Monopolar vs. bipolar comparisons for a given bipolar stimulus level and corresponding peak spike rate were made in the same manner as the electrical vs. acoustic comparisons (Fig. 6).
Within each stimulus type (acoustic, monopolar, or bipolar), onset responses were also compared to sustained responses by calculating normalized activation areas (Fig. 7). This was done to investigate the possibility that onset and sustained responses had different activation widths but the same overall shape (i.e., that spike rate adapted by a uniform factor across the recording array from onset to sustained response). First, onset and sustained peak spike rates and IC depths were normalized to a maximum value of one. Then, the normalized activation area was calculated for each time window as the area under the normalized spike rate versus IC depth curve. In this analysis, a large area indicated a broad response shape and nonselective activation, whereas a small area indicated a narrow shape and selective activation. If the onset and sustained areas were equal, it would indicate that the sustained response could be a uniformly-scaled version of the onset response.
FIG. 7.
Normalized activation area calculation. Spike rate versus IC depth is shown for the same responses as in Figure 4, but with vertical and horizonal axes normalized to one. The area under each curve is taken as an indicator of how narrowly-tuned the responses are, independent of absolute spike rate (smaller area = narrower tuning). norm normalized.
Statistical analyses
We compared onset activation widths to sustained activation widths for acoustic, monopolar electrical, and bipolar electrical stimulation. We also compared activation widths for monopolar electrical stimulation to corresponding activation widths for bipolar electrical stimulation and acoustic stimulation that elicited similar peak spike rates in the inferior colliculus central nucleus. Data from cats and guinea pigs were analyzed separately.
First, onset and sustained activation widths for acoustic stimuli were compared using a two-way repeated measures analysis of variance (ANOVA) in the SPSS software package (“general linear model” command). For this analysis, activation–width measurements were pooled across stimulus frequencies (nine to 11 frequencies studied per animal) and compared within each animal separately. Within-subject factors were time window (onset or sustained) and stimulus level (decibel SPL). Subsequently, activation widths were pooled across animals and the same two-way ANOVA was performed using stimulus frequency as a treatment factor.
Next, onset and sustained activation widths for electrical stimuli were compared using a three-way repeated measures ANOVA. Activation widths were first compared within each animal, pooling measurements across stimulus channels (guinea pigs gp147, gp148, and gp151 had five, five, and eight stimulus channels studied, respectively; see Table 2 for the number of stimulus channels studied in cats). Within-subject factors were time window (onset or sustained), stimulus level (decibel SPL), and stimulus configuration (monopolar and bipolar). Activation widths then were pooled across animals, and the three-way ANOVA was performed using stimulus channel number as a treatment factor. There was no significant effect of channel number on activation widths in either cats (p > 0.789, F(4,22) = 0.404) or guinea pigs (p > 0.915, F(7,10) = 0.345) so this factor was ignored in further tests.
TABLE 2.
Electrical stimulation and drug treatment histories for eight cats
| Cat no. | Age at implantation, weeks | Age at stimulation, weeks | Stimulation period, weeks | Stimulus | Drug treatment | Age at study, weeks | No. of acoustic freqs. studied | No. of electrical channels studied |
|---|---|---|---|---|---|---|---|---|
| K335 | 7.5 | 9 | 17 | BP 1,2 and 5,6—speech processor, 1,100 pps | None | 26 | – | 4 |
| K327a | 6 | 7 | 23 | BP 1,3b and 5,6—speech processor, 1,100 pps | Rasagiline, systemic, 10 weeks | 30 | – | 4 |
| K336a | 5.5 | Not stimulated | – | – | Artificial perilymph, infusion pump, 10 weeks | 16 | – | 5 |
| K313 | 5 | 10 | 13 | BP 1,2 and 5,6—speech processor, 1,100 pps | BDNF, infusion pump, 11 weeks | 23 | – | 4 |
| K319 | 5 | 8 | 20 | BP 1,2 and 5,6—speech processor, 1,100 pps | BDNF, infusion pump, 11 weeks | 28 | – | 1 |
| K329 | 4 | 7 | 22 | BP 1,2 and 5,6: 300 pps/30 Hz; | BDNF, infusion pump, 10 weeks | 29 | – | 5 |
| K328 | Normal hearing cat | – | – | – | – | 26 | 11 | 4 |
| K338 | Normal hearing cat | – | – | – | – | 31 | 9 | 4 |
BP bipolar, pps pulses per second
aCats that received dexamethasone through the osmotic pump during the first several days after cochlear implantation
bK327 had 1,3 bipolar pair stimulated for most of the stimulation period due to the failure of wire # 2
The ANOVA tests with data pooled across animals were then repeated for the dependent variables of peak spike rate and normalized activation area. For each ANOVA in cats, drug treatment was also tested separately as a treatment factor (see “Appendix” section for treatment group details). No statistically significant effect of drug treatment was found in any of these tests (p > 0.09). Therefore, data from all the cats were pooled.
Finally, activation widths for acoustic and electrical stimulation were compared for stimulus levels that produced equivalent peak spike rates. Prior to comparing activation widths, it was necessary to confirm that peak spike rates increased monotonically with stimulus level. ANOVA results showed that peak spike rate increased significantly with acoustic and electrical stimulus level (partial eta squared > 0.71 for a linear contrast, p < 0.001; Fig. 5). For monopolar and bipolar stimuli in cats, the linear relationship between peak spike rate and stimulus level was particularly strong (partial eta squared = 0.93, p < 0.001). In addition, individual peak spike rate versus stimulus level functions were consistently monotonic (not shown). After confirming monotonicity of peak spike rates, activation widths for stimulus levels that elicited peak spike rates equivalent to 60-dB SPL acoustic tones were compared among acoustic, monopolar, and bipolar stimuli. Activation widths first were compared in individual animals, pooling data across stimulus frequencies or channels using a two-way repeated measures ANOVA. Within-subject factors were time window (onset or sustained) and stimulus configuration (acoustic or monopolar). Data then were then pooled across animals and comparisons were made among acoustic, monopolar, and bipolar stimulus configurations using a one-way nonparametric ANOVA (repeated measures Friedman’s test). Separate tests were performed for the onset and sustained time windows using a Bonferroni correction for two comparisons.
To test for interactions between time window and stimulus configuration in the activation width comparisons, the aforementioned ANOVAs were repeated with peak spike rates matched in a different way. In these tests, peak spike rates were matched for the sustained time period, and the level that produced the best match for the sustained time period was also used for the onset time period. This allowed us to explore whether for a given stimulus level, there was a greater effect of time period for any of the three stimulus conditions: acoustic, monopolar or bipolar.
Because the assumption of normality was not always met in the parametric ANOVA tests, significant main effects of time window on activation width and normalized activation area were confirmed separately for each stimulus type (acoustic, monopolar, and bipolar) using a two-way nonparametric ANOVA (Friedman’s test in the Matlab software package) with main effects of time window (onset or sustained) and stimulus level (decibel SL). The higher p value resulting from the parametric or nonparametric test is given. For the monopolar-to-bipolar comparisons, means and 95 % confidence intervals from the parametric ANOVA are given in the text, but medians and interquartile ranges are shown in the figures to provide a nonparametric description of the data.
Results
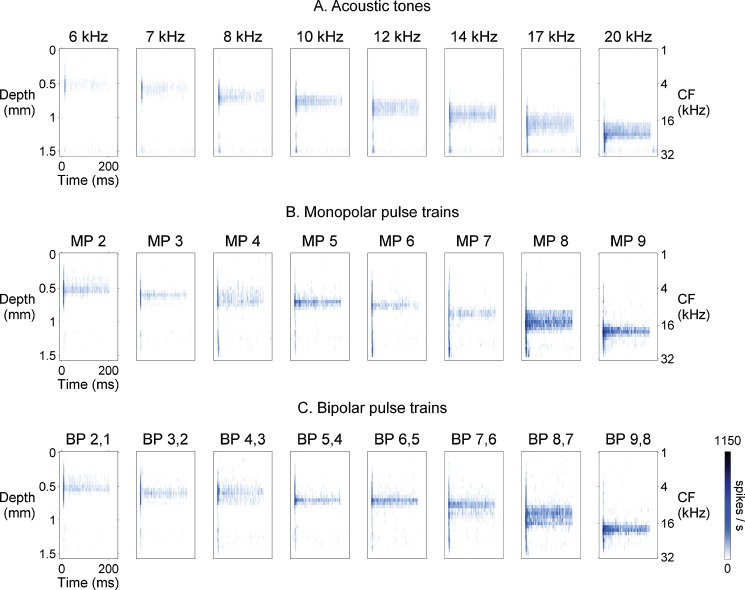
Exemplary raw data are illustrated in Figure 8 comparing responses in the IC elicited by stimulation with acoustic tones or 1,000-pulse/s electrical pulse trains delivered in monopolar or bipolar configurations. For acoustic pure tones, a systematic shift in IC depth occurs with increasing frequency (from 6 to 20 kHz), reflecting the frequency organization of the IC, with lower frequency CF neurons located more superficially and progressively higher frequency CF neurons at deeper recording sites (Fig. 8A). Similarly, the responses to 1,000-pulse/s monopolar (Fig. 8B) and bipolar (Fig. 8C) pulse trains showed a systematic shift in IC depth with stimulation of intracochlear electrodes located at different cochlear locations. The most apical electrodes elicited responses superficially in the IC and progressively more basal electrodes produced responses at deeper recording sites. This systematic relationship between IC depth and cochlear place of stimulation was characteristic of recordings in all animals (guinea pigs and cats; normal and deafened subjects); we never saw a reversal in the systematic progression of IC depth with increasing CF or basal-to-apical intracochlear electrode sequence.
FIG. 8.
Examples of temporal response profiles for acoustic, monopolar, and bipolar stimulation in one guinea pig. Response profiles to 200-ms long stimuli are constructed as in Figure 3 (0 ms indicates beginning of stimulus). A Acoustic pure tones at 60 dB SPL elicit responses at progressively deeper locations in the inferior colliculus as stimulus frequency increases, showing the stereotypical tonotopic (frequency) organization of the inferior colliculus. Initial “onset” responses to tones are broadly distributed across the inferior colliculus, whereas sustained responses are more narrowly distributed, indicating that sustained responses are more selectively tuned to stimulus frequency. B Like acoustic responses, responses to monopolar pulse trains (4 dB SL) shift to deeper locations in the inferior colliculus with increasingly basal intracochlear stimulation (stimulus channel shown above each panel). Also, monopolar onset responses are more broadly distributed across the inferior colliculus than subsequent sustained responses, indicating more selective sustained tuning to electrical stimulus channel. Note that the distributions of responses to monopolar pulse trains and acoustic tones appear to be similar. C Responses to bipolar pulse trains (4 dB SL) follow the same trends as seen for monopolar pulse trains.
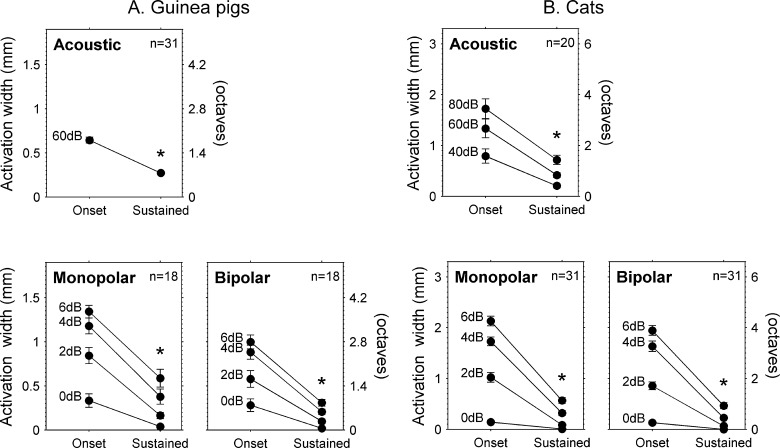
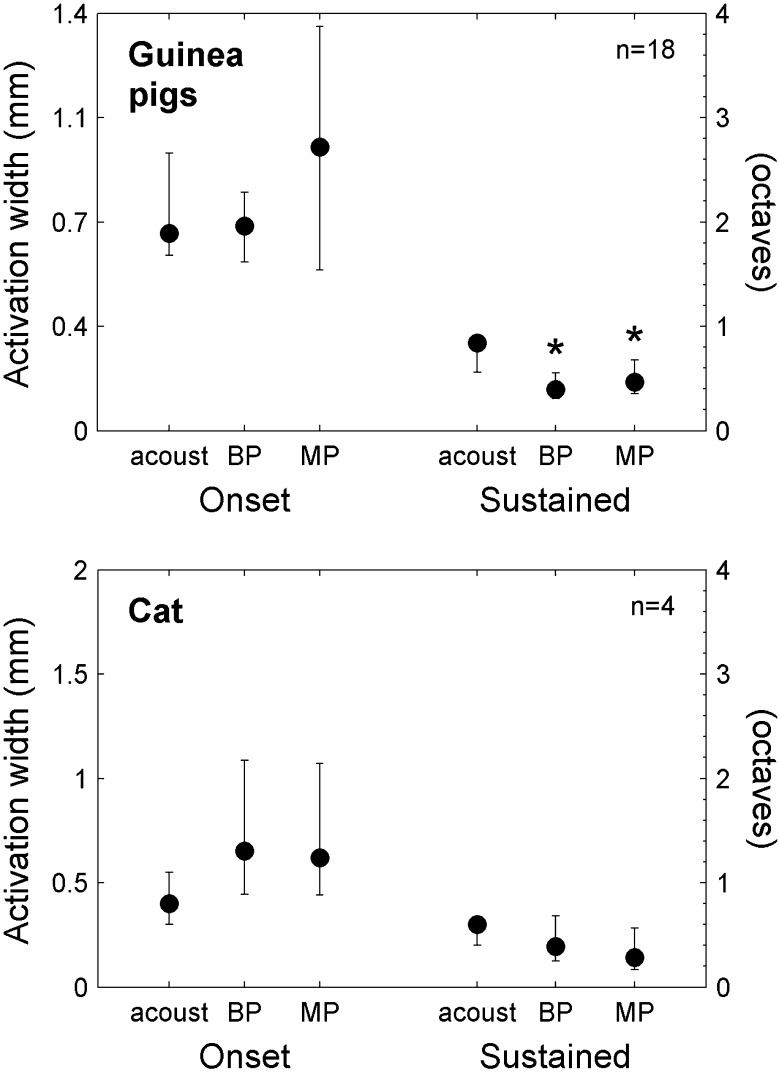
The data shown in Figure 8 also demonstrate the finding that the extent of IC activation was usually quite broad for onset responses and much narrower for the subsequent sustained responses. This was true for responses to acoustic stimuli, as well as responses to monopolar and bipolar electrical pulse trains. Quantitative analyses of IC activation widths demonstrated that onset responses were significantly broader than sustained responses for all three types of auditory nerve stimulation in both guinea pigs and cats (Table 1 and Fig. 9). In addition, activation widths increased significantly with level (p < 0.001), and there was a significant interaction between the effects of time window (onset vs. sustained) and level (p < 0.05) for all three stimulus configurations. This interaction generally manifested itself as a larger difference between onset and sustained activation widths with increasing stimulus level. For acoustic tones at 60 dB SL, sustained activation widths in guinea pigs were on average 58 % (95 % confidence interval of 49–67 %) narrower than onset activation widths and 66 % (27–105 %) narrower in cats. Monopolar and bipolar pulse trains in guinea pigs at 6 dB SL elicited sustained activation widths that were 56 % (38–73 %) and 68 % (53–84 %) narrower, than their respective onset activation widths and 74 % (61–86 %) and 77 % (61–93 %) narrower in cats.
TABLE 1.
Number of individual animals with significant effects of time window or stimulus configuration on activation width
| Acoustic stimulation | Time window: onset > sustained | Stimulus configuration: monopolar > acoustic |
| Guinea pigs | 3/3 | 0/3 |
| Cats | 2/2 | 0/1a |
| Electrical stimulation | Onset > sustained | Monopolar > bipolar |
| Guinea pigs | 3/3 | 1/3b |
| Cats | 7/7 | 0/7 |
Fractions reported are the numbers of individual animals with significant effects of time window (onset activation widths greater than sustained activation widths) or stimulus configuration (monopolar activation widths greater than acoustic or bipolar activation widths). Comparisons of stimulus configurations were made for levels that produced equal peak spike rates. For these comparisons, activation width measurements in individual animals were pooled across stimulus frequencies/channels. One of the eight cats (K329) was not tested individually because it had only one valid stimulus channel. The significance criterion was set at p < 0.05
aThis comparison could only be made in one of the two cats
bIn one guinea pig where monopolar activation widths were significantly greater than bipolar activation widths (gp147), they were only greater for the onset time window and not for the sustained time window (significant interaction between time window and stimulus configuration in this animal)
FIG. 9.
Sustained activation widths were narrower than onset activation widths in guinea pigs and cats. The left vertical axes show the extent of activation along the tonotopic axis of the inferior colliculus. The right vertical axes show this extent in units of octaves. A Means and standard errors of the means are shown for a total of 31 acoustic tone frequencies and 18 monopolar and bipolar electrical stimulus channels in three guinea pigs. B Results for 20 acoustic tone frequencies in two normal cats and 31 monopolar and bipolar electrical stimulus channels in two normal and six chronically deafened cats. Acoustic level is dB SPL and electrical levels are dB SL. *p < 0.01 for main effect of onset vs. sustained time window.
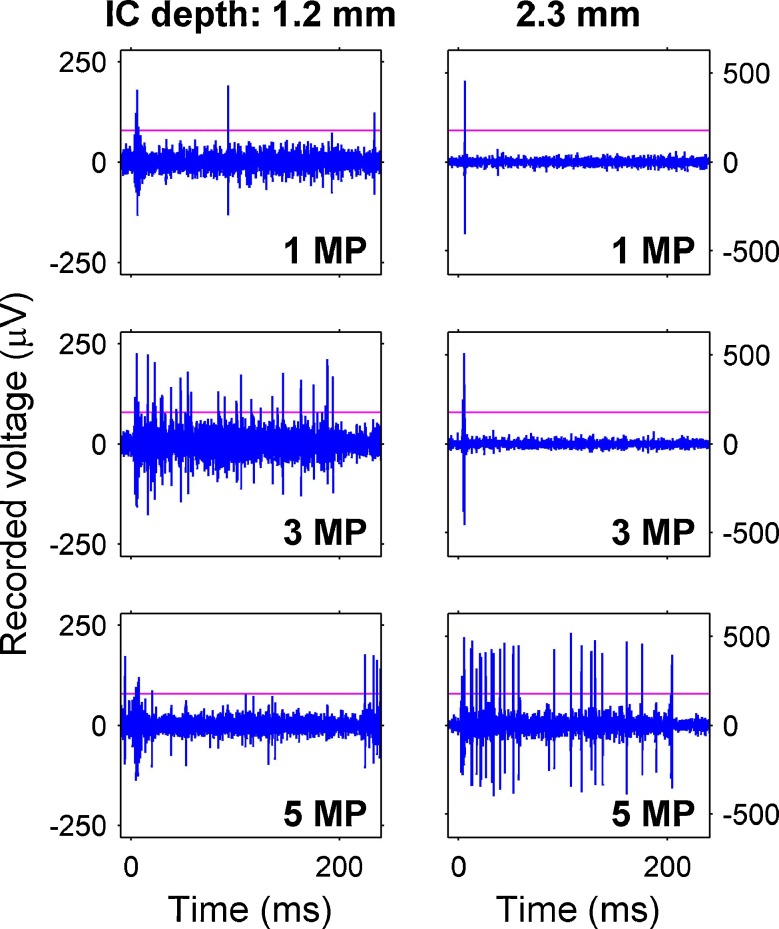
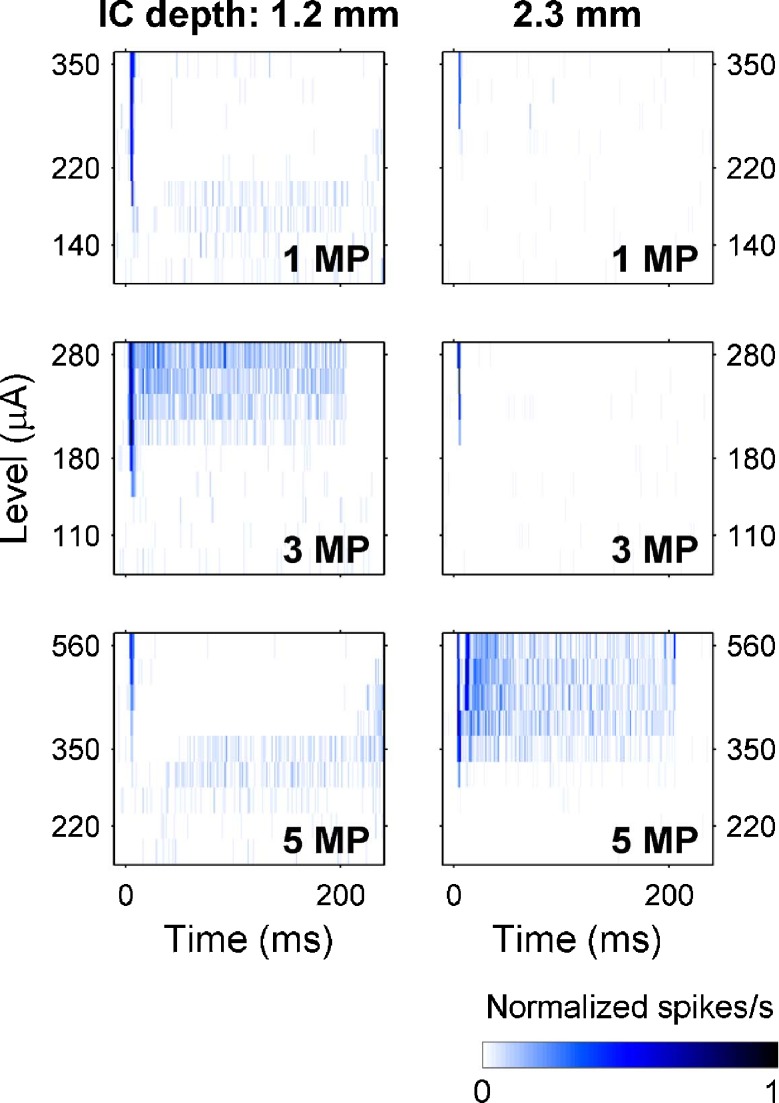
When spike detection thresholds were raised to limit our analysis to one or a small number of large-spiking units on several recording sites, we found that these units also had broad onset and narrow sustained tuning to monopolar electrical pulse trains at 1,000 pulses/s (Fig. 10). Recording sites distant from the site of peak activation often seemed to show inhibition of spontaneous activity (informal observation, see Fig. 11). In addition, direct comparisons of PSTHs for the unit responses (Fig. 11) and multi-unit responses (not shown) on the same recording sites revealed similar patterns of neuronal excitation and suppression.
FIG. 10.
Examples of selective monopolar tuning for units at two inferior colliculus depths in a cat. Each column shows recorded waveforms at a given IC depth in response to three stimulating channels (inset bottom right channel number). A threshold (horizontal line) was empirically chosen to detect only one to several large-spiking units. Recordings from the 1.2 mm deep recording site (left) show sustained responses to channel 3 MP but not to 1 or 5 MP. In contrast, the recording site at 2.3 mm (right), shows sustained responses to 5 MP but not to 1 or 3 MP. Both recording sites show onset responses to all three stimulating channels. Current levels were 1 MP, 280 μA; 3 MP, 250 μA; and 5 MP, 450 μA. Pulse trains began at 0 ms and ended at 200 ms.
FIG. 11.
Post-stimulus time histograms for the unit responses from Figure 10 at various stimulus levels. In each image, the rows represent PSTHs at different stimulus levels with response strengths indicated by color. For the 1.2-mm deep recording site, at higher levels 3 MP produced sustained responses whereas 1 and 5 MP inhibited spontaneous activity (after a brief onset response). In contrast, for the 2.3-mm site 5 MP produced sustained responses, but 1 and 3 MP produced only onset responses.
For comparisons in individual animals, monopolar activation widths were not broader than acoustic activation widths in any of the cats or guinea pigs (Table 1). Monopolar activation widths also were not broader than bipolar activation widths, with the exception of a single guinea pig (gp147, p < 0.035, F(1,4) = 9.83). In this animal, there was a significant interaction between time window and stimulus configuration (p < 0.001, F(1,4)v = 324), and activation widths were broader for monopolar stimulation than for bipolar stimulation during the onset time window (p < 0.007), but not during the sustained time window (p > 0.481).
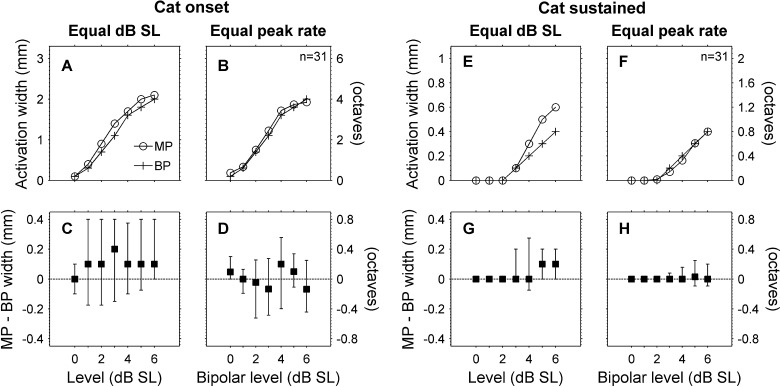
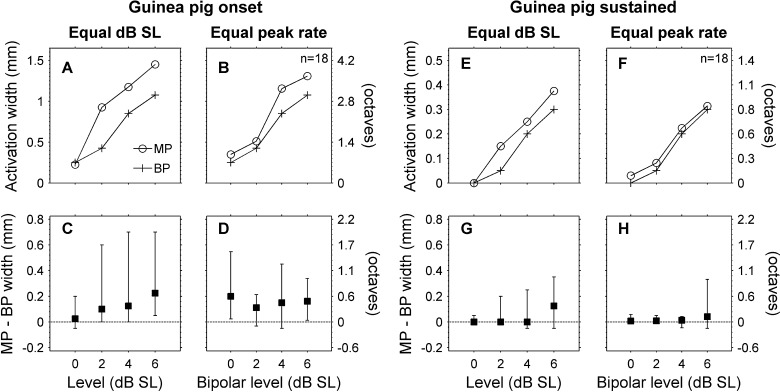
When data were pooled across animals, we found that for stimuli delivered at equal decibel SL, monopolar stimuli produced somewhat broader (multi-unit) activation widths than bipolar stimuli, whereas for stimuli eliciting equivalent spike rates, monopolar and bipolar stimuli produced nearly identical onset and sustained activation widths in cats and similar sustained activation widths in guinea pigs. At equal decibel SL levels, monopolar activation widths were significantly broader than bipolar activation widths for onset and sustained time windows in both cats (p < 0.025, F(1,22) = 5.76, Fig. 12) and guinea pigs (p < 0.009, F(1,10) = 10.4). For equal peak spike rates in cats, monopolar and bipolar activation widths were not significantly different for the onset or sustained time windows (p > 0.167, F(1,22) = 2.04), and there was no significant interaction between time window and electrical stimulus configuration (p > 0.609, F(1,22) = 0.269). For a bipolar level of 6 dB SL, the differences between monopolar and bipolar activation widths were −2 % (−9 to 5 %) for the onset time window and 4 % (−13 to 21 %) for the sustained time window (the mean monopolar sustained activation width was 440 μm (0.89 octaves) so 4 % corresponds to a difference of only 18 μm (0.035 octaves)).
FIG. 12.
Monopolar and bipolar activation widths were comparable for equal peak spike rates in cats. A At equal dB SL, monopolar stimuli produced broader onset activation widths than bipolar stimuli (medians shown for 31 total stimulus channels in eight cats). B When compared at equal peak spike rates, monopolar, and bipolar stimuli produced nearly equal onset activation widths. C and D Paired differences (medians and interquartile ranges) for the monopolar and bipolar onset activation widths shown in A and B. E–F Activation widths and paired differences for the sustained time window. When compared at equal dB SL sustained activation widths were slightly broader for monopolar than for bipolar stimulation (E and G). At equal peak spike rates, sustained monopolar and bipolar activation widths were nearly identical (F and H).
For equal peak spike rates in guinea pigs (Fig. 13), there was a main effect of stimulus configuration on activation width (p < 0.006, F(1,10) = 12.2), but there was also a significant interaction between stimulus configuration and time window (p < 0.016, F(1,10) = 8.33). When each time window was analyzed separately, the monopolar configuration produced significantly broader activation than the bipolar configuration during the onset time window (p < 0.003) but not during the sustained time window (p > 0.111). For a bipolar level of 6 dB SL the differences between monopolar and bipolar activation widths were 19 % (3 to 35 %) for the onset time window and 33 % (−11 to 77 %) for the sustained time window. Also, median monopolar and bipolar sustained activation widths were very similar (Fig. 13F and H).
FIG. 13.
Monopolar and bipolar activation widths in guinea pigs. (Figure layout as in Fig. 12). A–D Both at equal dB SL and at equal peak spike rates, onset activation widths were broader for monopolar than for bipolar stimuli. E–F Sustained activation widths were broader for monopolar stimuli than for bipolar stimuli for equal dB SL (E and G). However, for equal peak spike rates monopolar and bipolar sustained activation widths were nearly identical at levels up to 4 dB SL (F and H). At 6 dB SL, some monopolar channels produced broader sustained activation (large positive interquartile range), but the median difference was near zero.
When peak spike rates were matched to those of 60-dB SPL acoustic tones, both monopolar and bipolar stimuli produced narrower sustained activation widths than acoustic stimuli (Fig. 14). In guinea pigs, this difference was significant, and both electrical and acoustic stimuli showed relatively small variability in sustained activation widths. Monopolar onset activation, on the other hand, had high variability and median onset widths were broader for monopolar than for acoustic stimuli (difference not significant). The change in activation width from the onset time window to the sustained time window was greater for monopolar stimulation than for acoustic stimulation; this interaction between stimulus configuration and time window for the monopolar vs. acoustic comparison was significant (p < 0.033, F(1,17) = 5.40). Data from one of the two normal cats also showed a trend toward narrower sustained activation for monopolar and bipolar stimulation than for acoustic stimulation, and a greater change in activation width from the onset to the sustained time window for monopolar stimulation than for acoustic stimulation.
FIG. 14.
Sustained activation widths were narrower for electrical than for acoustic stimuli when peak spike rates were matched to 60-dB SPL acoustic tones. In three guinea pigs, sustained activation widths were significantly narrower for monopolar and bipolar stimuli than for acoustic stimuli (medians and interquartile ranges shown for 18 total electrical stimulus channels and 18 matched acoustic tone frequencies). Bipolar onset activation widths were similar to acoustic. Monopolar onset activation widths, however, had large variability and a trend towards broader activation than acoustic (not significant). For the one normal cat in which acoustic-to-electrical comparisons could be made, trends were similar to those seen in guinea pigs except that bipolar onset activation was more similar to monopolar activation than to acoustic activation. *p < 0.05 relative to acoustic tones. (acoust acoustic tones).
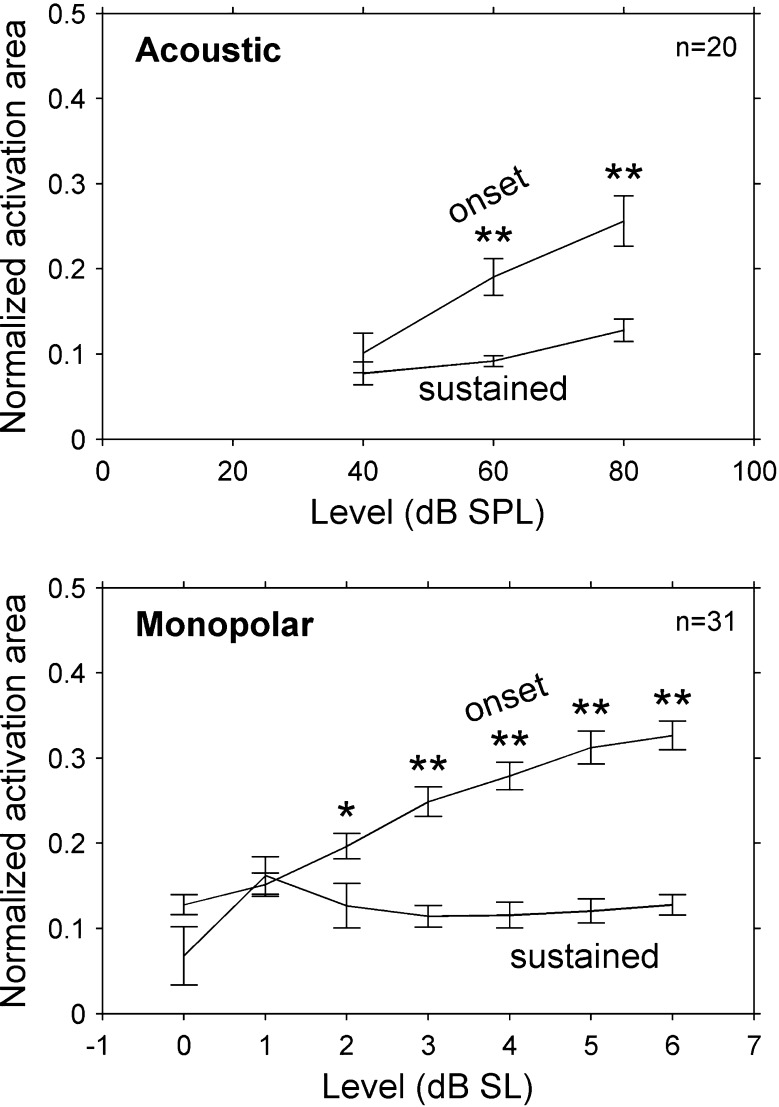
Similar to our finding for sustained and onset activation widths, we found that normalized activation areas were significantly smaller for the sustained response than for the onset response to acoustic, monopolar, and bipolar stimuli in guinea pigs and cats (p < 0.01, see Fig. 15). The difference between onset and sustained areas generally increased with increasing stimulus level (significant interaction between time window and stimulus level, p < 0.01, partial eta squared > 0.4 for a linear interaction contrast). For acoustic tones at 60 dB SL, sustained activation areas were 50 % (45–55 %) narrower than onset activation areas in guinea pigs and 50 % (19–81 %) narrower in cats. Sustained activation areas were also narrower than onset activation areas for 6-dB SL pulse trains in monopolar and bipolar configurations (respectively) by 46 % (25–66 %) and 36 % (29–44 %) in guinea pigs and 63 % (48–78 %) and 62 % (44–80 %) in cats.
FIG. 15.
Normalized activation area was smaller for the sustained time window than for the onset time window in cats. This effect increased with stimulus level, indicating that at higher levels the shape of the sustained response was narrower than that of the onset response (even for normalized peak spike rates). Values are means and error bars are standard errors of the means. Acoustic data are from 20 stimulus frequencies in two cats. Monopolar data are from 31 stimulus channels in eight cats. *p < 0.05, **p < 0.001 relative to sustained area.
Discussion
Our study conducted in both guinea pigs and cats has demonstrated that sustained (200-ms duration) monopolar intracochlear stimulation can elicit selective activation of the inferior colliculus. Specifically, we found that the extent of inferior colliculus activation produced by 1,000-pulse/s monopolar electrical pulse-train stimuli is narrower for the sustained response than for the onset response. Surprisingly, we also found that for similar peak spike rates, monopolar stimulation actually produces narrower extents of sustained activation than acoustic stimulation. Also somewhat surprisingly, we found that for similar peak spike rates monopolar and bipolar stimulation produce comparable extents of activation.
There are two lines of evidence that support our conclusion that monopolar pulse trains at 1,000 pulses/s produce narrower extents of IC activation during the sustained response than during the onset response. First, for monopolar stimuli, sustained activation widths were narrower than onset activation widths in guinea pigs and in cats (Fig. 9). This same pattern also held true for bipolar and acoustic stimulation and is consistent with previous studies of IC responses to acoustic tones (Rose et al. 1963; Aitkin et al. 1994; Harris et al. 1997; Seshagiri and Delgutte 2007) and electrical pulse trains (Bierer et al. 2010). Interestingly, in the present study, onset responses to acoustic and electrical stimuli could be quite broad, extending over several millimeters (or several octaves) of the IC tonotopic axis at higher levels, whereas sustained responses covered a much narrower extent (for acoustic stimuli at 60 dB SPL the extent was roughly 0.85 octaves—much closer to a neural critical band (Egorova and Ehret 2008)).
The second line of evidence is that at higher levels normalized activation areas were smaller for the sustained response than for the onset response (Fig. 15). This finding rules out the possibility that onset activation adapted uniformly across IC depths to produce sustained activation that was smaller but had the same shape. Instead, it implies that the pattern of sustained activation narrowed relative to onset activation. The mechanism for this narrowing is unclear. Across the recording array, the proportional decrease in spike rate from onset to sustained response was smaller for higher initial driven rates (Fig. 7). This is the opposite of what would be expected from neuronal adaptation. One possible mechanism that is consistent with this narrowing of sustained responses could be lateral inhibition, which has been shown to be present at multiple levels of central auditory processing (Shamma et al. 1993; Ramachandran et al. 1999; Young 2003). One implication of this narrowing of sustained responses is that comparisons of psychophysical and electrophysiological measures (for example, ECAPs) in CI users should ideally be made using similar pulse rates.
The unexpected finding that for levels that produce similar peak spike rates, monopolar stimulation produces narrower extents of sustained activation than acoustic stimulation is supported particularly by data in guinea pigs. Median sustained activation widths were narrower for monopolar stimulation than for acoustic stimulation in guinea pigs (and in the one cat in which this comparison was possible, Fig. 14). Raw data from eight stimulus channels in one guinea pig qualitatively shows the high degree of similarity between sustained response patterns to monopolar and acoustic stimuli (Fig. 8).
The other somewhat unexpected finding—that for levels that produce similar peak spike rates, monopolar and bipolar stimulation produce similar extents of IC activation—is also supported by data from both cats and guinea pigs. In cats, monopolar and bipolar stimulation produced quite comparable onset activation widths and almost identical sustained activation widths (Fig. 12B, D, F, and H). In guinea pigs, onset activation widths were broader for monopolar stimulation than for bipolar stimulation, but sustained activation widths were similar at levels up to 4 dB SL (Fig. 13B, D, F, and H). One possible reason for the greater similarity between monopolar and bipolar activation widths in cats than in guinea pigs is the difference in stimulating contact spacing for the two species. Contact spacing was 1 mm in cats and 0.5 mm in guinea pigs, whereas mean basilar membrane lengths are around 25 mm in cats (Liberman 1982) and 20 mm in guinea pigs (Lee et al. 2010). The closer contact spacing in guinea pigs could have led to relatively narrower bipolar excitation patterns. We speculate that using larger bipolar electrode spacing in the guinea pigs would have resulted in a closer match between bipolar and monopolar onset activation widths. It is interesting to note that the 1-mm contact spacing used in cats is closer to the contact spacing used in human clinical devices.
The reliability of these findings does not appear to be diminished by the two main methodological limitations of the present study. First, activation widths for equal peak spike rates were not measured directly during experiments, but instead were interpolated from among the electrical stimulus levels tested (Fig. 6). It should be noted, however, that peak spike rates and activation widths increased monotonically with increasing stimulus level (Figs. 5 and 9), suggesting that interpolation between levels was reasonable. This monotonic increase in spike rate with increasing stimulus level contrasts with results from several previous studies that showed nonmonotonic rate–level functions in many single-units in the inferior colliculus (Rose et al. 1963; Ehret and Merzenich 1988; Nuding et al. 1999). One possible explanation for this discrepancy is that the present study recorded primarily multi-unit responses. Neurons with monotonic and nonmonotonic rate–level functions are frequently adjacent to one another in the inferior colliculus (Seshagiri and Delgutte 2007); therefore, recording from multiple neurons simultaneously could yield aggregate rate–level functions that are monotonic.
The second limitation, as mentioned above, was that the multisite recording probes used recorded primarily multi-unit data and allowed isolation of single neurons on only a limited number of recording sites per animal. Because our goal was to examine the relative selectivity of monopolar, bipolar, and acoustic stimulation in activating a population of auditory neurons distributed along the IC tonotopic axis, our findings do not rely upon the isolation of single units. However, the exemplary data presented suggest that the tuning of isolatable units to electrical stimuli is similar to the tuning of multi-unit data and, specifically, that this tuning is narrower for the sustained response than for the onset response (Figs. 10 and 11).
Having argued that our findings are reliable despite methodological limitations, we also offer several explanations for apparent discrepancies between the findings of the present study and previously published studies. First, we will consider studies that have compared IC responses to monopolar and acoustic stimulation. Our finding that for similar peak spike rates monopolar stimulation produces narrower extents of sustained activation than acoustic stimulation seems to contradict previous studies that showed much broader IC activation for monopolar stimulation than for acoustic stimulation (Snyder et al. 2004; Middlebrooks and Snyder 2007). There are at least three possible explanations for this discrepancy. First, in the present study, extents of activation for monopolar pulse trains and acoustic tones were decomposed into onset and sustained components before comparing them. In the previous studies, extents of activation were calculated for the response to isolated monopolar pulses (similar to our monopolar onset response) and for the entire acoustic response (a combination of onset and sustained response). Because onset responses are generally much broader than sustained responses for all stimuli, it is not surprising that a comparison between monopolar onset responses and a combination of acoustic onset and sustained responses would indicate that the monopolar response is much broader. A second possible explanation is that the present study compared extents of activation for monopolar and acoustic stimuli that produced similar peak spike rates, whereas the previous studies compared stimuli at a fixed number of decibels above threshold. Because it is not clear how the loudness of acoustic and electrical stimuli are related on a decibel level scale, it is problematic to choose fixed decibel levels at which to compare these two types of stimuli. Comparing extents of activation at levels that produced similar peak spike rates enabled us to match intensities of monopolar and acoustic responses in a way that seemed more appropriate. The third possible explanation for the discrepancy is that the present study used space-filling intracochlear electrode carriers, specifically designed for guinea pigs and cats to position stimulating contacts close to the neural targets, whereas the previous studies used conventional, non space-filling carriers. It has been shown that electrodes in non space-filling carriers are able to selectively activate the auditory nerve, but not reliably (Liang et al. 1999). Electrodes in the space-filling carriers used in the present study, on the other hand, have been shown to produce significantly narrower extents of IC activation than electrodes in non space-filling carriers (Snyder et al. 2008).
There are two points to bear in mind when interpreting our finding that sustained activation widths were similar between acoustic and monopolar stimuli. First, the decrease in activation width from the onset to the sustained time window was often greater for electrical stimulation than for acoustic stimulation, especially at higher electrical stimulus levels. (Note that at higher levels, the slopes of the lines are steeper for electrical stimulation than for acoustic stimulation in Fig. 9, also there was a significant interaction between stimulus configuration and time window in guinea pigs). It seems that, relative to acoustic responses, at high levels, the electrical onset responses become quite broad whereas the electrical sustained responses remain narrow. Broad onset activation widths for electrical stimuli could have important implications for the processing of speech and other amplitude-modulated stimuli delivered through a cochlear implant.
Second, some studies suggest that there may be little sustained firing of auditory cortex neurons in response to a sustained electrical pulse train (at least in an anesthetized animal (Schreiner and Raggio 1996; Middlebrooks 2004, 2008)). However, it has been shown that neurons in the auditory cortex of awake animals often have robust sustained responses to sustained acoustic stimuli when driven by their “preferred” stimuli (Wang et al. 2005). Additional studies are needed to address the question of whether a subset of neurons exhibit sustained responses to a given electrical pulse train while others exhibit an onset only response.
Additional interesting discrepancies are seen when we compare the present study to previous studies that characterized IC responses to monopolar and bipolar stimulation. Our finding in cats that monopolar and bipolar stimuli produce similar extents of onset activation in the IC contrast with those of a previous study (Middlebrooks and Snyder 2007). The present study showed similar extents of onset activation for monopolar and bipolar stimuli for equal peak spike rates and equal dB levels above threshold. The previous study showed monopolar stimulation producing broader extents of onset activation than bipolar stimulation for an equal d’ measure and for equal dB above threshold. One explanation for this discrepancy could be the fact that the present study used using space-filling electrode carriers, whereas the previous used conventional electrode carriers. However, a different study using conventional electrode carriers reported findings that were consistent with ours, namely that monopolar and bipolar stimulation produced similar extents of IC activation for equal peak evoked-potential amplitudes and for equal dB levels above threshold (up to 5 dB; Smith and Delgutte 2007). The reason(s) for these discrepancies remain unclear, but it seems likely that the close matching between monopolar and bipolar extents of activation seen in the present study cannot be attributed exclusively to the use of a space-filling electrode (although that may have been one factor).
Finally, our finding that monopolar and bipolar stimuli produce similar extents of IC activation at suprathreshold levels is in apparent contradiction with the findings of several psychophysical studies that suggest monopolar stimulation produces broader neuronal activation and electrical field interactions than bipolar stimulation at near-threshold levels (Boex et al. 2003b; Stickney et al. 2006; Bierer 2007). A possible explanation for this discrepancy is that near-threshold electrical field interactions may not accurately predict the extent of neuronal activation at suprathreshold levels. Evidence supporting this explanation may be found in the fact that psychophysical studies at suprathreshold levels have shown mixed results for comparisons of monopolar and bipolar stimulation. An early study showed that loudness summation for simultaneous two-channel stimulation was greater for monopolar stimulation in one subject and for bipolar stimulation in another subject (Shannon 1983b). Psychophysical forward masking using suprathreshold stimuli also shows conflicting results with bipolar stimulation producing narrower masking than monopolar stimulation in some studies (Shannon 1983b; Boex et al. 2003a; Nelson et al. 2008) but no difference between the two stimulus configurations in others (Cohen et al. 2001; Kwon and van den Honert 2006). It seems fair to conclude that psychophysical studies at suprathreshold levels have not definitively shown less channel interaction for bipolar stimulation than for monopolar stimulation (Bonham and Litvak 2008).
Another possible explanation for the disparities between the findings of the present study and those of psychophysical studies is the potential difference in location of stimulating contacts in the cochlea. It has been shown that the placement of intracochlear electrode contacts can account for a significant portion of the performance variability among cochlear implant users; for example, electrodes entering the scala vestibuli are associated with poorer performance (Finley et al. 2008). Although the final location of stimulating electrodes was not verified in our study, three factors reduced the likelihood of our electrodes being placed in the scala vestibuli: the electrode carriers were specially molded to fit within the first turn of the cochlea, insertion of the electrodes was through the round window (i.e., precluding direct insertion into the scala vestibuli, as reported in some human subjects (Finley et al. 2008)), and the large auditory bullae of the cat and guinea pig allowed relatively straightforward insertion of electrodes at an optimum angle. As mentioned previously, the space-filling electrode carrier was also designed to place electrode stimulation sites close to spiral ganglion neurons and or peripheral/processes. These factors make it possible that our results could be representative of better-performing cochlear implant users, with stimulating contacts placed in the scala tympani close to neural elements, rather than cochlear implant users as a whole.
Thus, our findings that the extent of IC activation for 1,000-pulse/s electrical stimuli is narrower for the sustained response than for the onset response, and that for levels that produce similar peak spike rates, monopolar and bipolar stimulation elicit similar extents of IC activation may help explain the observation that cochlear implant users generally do not perform better with bipolar stimulation than with monopolar stimulation. The unexpected finding that electrodes in a space-filling carrier activated with monopolar pulse trains actually produce more selective sustained activation than acoustic tones also suggests that it may indeed be worthwhile to design intracochlear arrays with higher densities of stimulating contacts that lie as close as possible to their target neural elements. With such arrays, it may be possible to provide cochlear implant users with much finer spectral resolution, improving their ability to appreciate music and to understand speech, especially in noisy environments.
Acknowledgments
The authors thank Alex Hetherington and Steve Rebscher for construction of intracochlear electrodes and for assisting with data collection. This work was funded by NIH Predoctoral Fellowship 1 F31 DC008940-01A1, NIH/NIDCD HHS-N-263-2007-00054-C, the Epstein Fund, and Hearing Research, Inc.
Appendix: chronically deafened cats
Six of the eight cats in this study were deafened as neonates by daily subcutaneous injections of neomycin sulfate (60 mg/kg; Leake et al. 1999) and received varying electrical stimulation regimes and drug treatments (Table 2). For all six animals, neomycin injections were started at day 1 after birth; click-evoked auditory brainstem responses were used to monitor hearing loss beginning after 16 days of treatment, at 2–3 days intervals. Neomycin treatment was discontinued after 16–21 injections when absence of responses to clicks at 90 dB SPL indicated a profound hearing loss. All six cats were implanted unilaterally at 4–7 weeks of age with an intracochlear electrode with six to eight stimulating contacts. Four cats also received a subcutaneous mini osmotic pump (Rebscher et al. 2007) for direct infusion of brain-derived neurotrophic factor (BDNF, 94 μg/ml, three animals) or artificial perilymph (one animal) into the inner ear. One animal received systemic treatment with rasagiline (1 mg/kg daily). Five cats also chronic electrical stimulation for 4 h per day, 5 days a week, for a period of 13–23 weeks. Four of these five animals received electrical stimulation with biphasic pulse trains (90 μs/phase) delivered by a Clarion™ CII speech processor. Levels of stimulation were controlled by the loudness of environmental sounds with maximum stimulation levels set at 6 dB above electrically evoked ABR thresholds, but no more than 500 μA. The remaining animal was stimulated with continuous trains of charge-balanced biphasic pulses (200 μs/phase) delivered at 300 pulses/s with 30-Hz sinusoidal amplitude modulation (100 % modulation depth). In this animal peak stimulation levels were set at 2 dB above electrically evoked ABR thresholds. Chronically deafened cats were studied in acute physiological experiments immediately following completion of the electrical stimulation and drug treatment protocols. Because the effect of treatment group was not significant for any of the tests performed (p > 0.09), data from all the cats were pooled.
Contributor Information
Matthew C. Schoenecker, Phone: +1-510-2958734, FAX: +1-323-9395064, Email: mcschoenecker@gmail.com
Ben H. Bonham, Email: ben@phy.ucsf.edu
Olga A. Stakhovskaya, Email: ostakhov@umd.edu
Russell L. Snyder, Email: rsnyder@ohns.ucsf.edu
Patricia A. Leake, Email: pleake@ohns.ucsf.edu
References
- Aitkin L, Tran L, Syka J. The responses of neurons in subdivisions of the inferior colliculus of cats to tonal, noise and vocal stimuli. Exp Brain Res. 1994;98:53–64. doi: 10.1007/BF00229109. [DOI] [PubMed] [Google Scholar]
- Bierer JA. Threshold and channel interaction in cochlear implant users: evaluation of the tripolar electrode configuration. J Acoust Soc Am. 2007;121:1642–1653. doi: 10.1121/1.2436712. [DOI] [PubMed] [Google Scholar]
- Bierer JA, Middlebrooks JC. Auditory cortical images of cochlear-implant stimuli: dependence on electrode configuration. J Neurophysiol. 2002;87:478–492. doi: 10.1152/jn.00212.2001. [DOI] [PubMed] [Google Scholar]
- Bierer JA, Bierer SM, Middlebrooks JC. Partial tripolar cochlear implant stimulation: spread of excitation and forward masking in the inferior colliculus. Hear Res. 2010;270:134–142. doi: 10.1016/j.heares.2010.08.006. [DOI] [PMC free article] [PubMed] [Google Scholar]
- Boex C, Kos MI, Pelizzone M. Forward masking in different cochlear implant systems. J Acoust Soc Am. 2003;114:2058–2065. doi: 10.1121/1.1610452. [DOI] [PubMed] [Google Scholar]
- Boex C, Balthasar C, Kos MI, Pelizzone M. Electrical field interactions in different cochlear implant systems. J Acoust Soc Am. 2003;114:2049–2057. doi: 10.1121/1.1610451. [DOI] [PubMed] [Google Scholar]
- Boex C, Baud L, Cosendai G, Sigrist A, Kos MI, Pelizzone M. Acoustic to electric pitch comparisons in cochlear implant subjects with residual hearing. J Assoc Res Otolaryngol. 2006;7:110–124. doi: 10.1007/s10162-005-0027-2. [DOI] [PMC free article] [PubMed] [Google Scholar]
- Bonham BH, Litvak LM. Current focusing and steering: modeling, physiology, and psychophysics. Hear Res. 2008;242:141–153. doi: 10.1016/j.heares.2008.03.006. [DOI] [PMC free article] [PubMed] [Google Scholar]
- Chen Z, Hu G, Glasberg BR, Moore BC. A new method of calculating auditory excitation patterns and loudness for steady sounds. Hear Res. 2011;2011:10. doi: 10.1016/j.heares.2011.08.001. [DOI] [PubMed] [Google Scholar]
- Cohen LT, Saunders E, Clark GM. Psychophysics of a prototype peri-modiolar cochlear implant electrode array. Hear Res. 2001;155:63–81. doi: 10.1016/S0378-5955(01)00248-9. [DOI] [PubMed] [Google Scholar]
- Dean I, Harper NS, McAlpine D. Neural population coding of sound level adapts to stimulus statistics. Nat Neurosci. 2005;8:1684–1689. doi: 10.1038/nn1541. [DOI] [PubMed] [Google Scholar]
- Egorova M, Ehret G. Tonotopy and inhibition in the midbrain inferior colliculus shape spectral resolution of sounds in neural critical bands. Eur J Neurosci. 2008;28:675–692. doi: 10.1111/j.1460-9568.2008.06376.x. [DOI] [PubMed] [Google Scholar]
- Ehret G, Merzenich MM. Neuronal discharge rate is unsuitable for encoding sound intensity at the inferior-colliculus level. Hear Res. 1988;35:1–7. doi: 10.1016/0378-5955(88)90035-4. [DOI] [PubMed] [Google Scholar]
- Finley CC, Holden TA, Holden LK, Whiting BR, Chole RA, Neely GJ, Hullar TE, Skinner MW. Role of electrode placement as a contributor to variability in cochlear implant outcomes. Otol Neurotol. 2008;29:920–928. doi: 10.1097/MAO.0b013e318184f492. [DOI] [PMC free article] [PubMed] [Google Scholar]
- Friesen LM, Shannon RV, Cruz RJ. Effects of stimulation rate on speech recognition with cochlear implants. Audiol Neurootol. 2005;10:169–184. doi: 10.1159/000084027. [DOI] [PubMed] [Google Scholar]
- Harris DM, Shannon RV, Snyder R, Carney E. Multi-unit mapping of acoustic stimuli in gerbil inferior colliculus. Hear Res. 1997;108:145–156. doi: 10.1016/S0378-5955(97)00047-6. [DOI] [PubMed] [Google Scholar]
- Kileny PR, Zwolan TA, Telian SA, Boerst A. Performance with the 20 + 2 L lateral wall cochlear implant. Am J Otol. 1998;19:313–319. [PubMed] [Google Scholar]
- Kral A, Hartmann R, Mortazavi D, Klinke R. Spatial resolution of cochlear implants: the electrical field and excitation of auditory afferents. Hear Res. 1998;121:11–28. doi: 10.1016/S0378-5955(98)00061-6. [DOI] [PubMed] [Google Scholar]
- Kwon BJ, Honert C. Effect of electrode configuration on psychophysical forward masking in cochlear implant listeners. J Acoust Soc Am. 2006;119:2994–3002. doi: 10.1121/1.2184128. [DOI] [PubMed] [Google Scholar]
- Leake PA, Hradek GT, Snyder RL. Chronic electrical stimulation by a cochlear implant promotes survival of spiral ganglion neurons after neonatal deafness. J Comp Neurol. 1999;412:543–562. doi: 10.1002/(SICI)1096-9861(19991004)412:4<543::AID-CNE1>3.0.CO;2-3. [DOI] [PubMed] [Google Scholar]
- Lee CF, Li GJ, Wan SY, Lee WJ, Tzen KY, Chen CH, Song YL, Chou YF, Chen YS, Liu TC. Registration of micro-computed tomography and histological images of the guinea pig cochlea to construct an ear model using an iterative closest point algorithm. Ann Biomed Eng. 2010;38:1719–1727. doi: 10.1007/s10439-010-9961-1. [DOI] [PubMed] [Google Scholar]
- Liang DH, Lusted HS, White RL. The nerve-electrode interface of the cochlear implant: current spread. IEEE Trans Biomed Eng. 1999;46:35–43. doi: 10.1109/10.736751. [DOI] [PubMed] [Google Scholar]
- Liberman MC. The cochlear frequency map for the cat: labeling auditory-nerve fibers of known characteristic frequency. J Acoust Soc Am. 1982;72:1441–1449. doi: 10.1121/1.388677. [DOI] [PubMed] [Google Scholar]
- Merzenich MM, White MW. Cochlear implant: the interface problem. In: Hambrecht FT, Reswich JB, editors. Functional electrical stimulation: applications in neural prosthesis. New York: Dekker; 1977. pp. 321–340. [Google Scholar]
- Middlebrooks JC. Effects of cochlear-implant pulse rate and inter-channel timing on channel interactions and thresholds. J Acoust Soc Am. 2004;116:452–468. doi: 10.1121/1.1760795. [DOI] [PubMed] [Google Scholar]
- Middlebrooks JC. Auditory cortex phase locking to amplitude-modulated cochlear implant pulse trains. J Neurophysiol. 2008;100:76–91. doi: 10.1152/jn.01109.2007. [DOI] [PMC free article] [PubMed] [Google Scholar]
- Middlebrooks JC, Snyder RL. Auditory prosthesis with a penetrating nerve array. J Assoc Res Otolaryngol. 2007;8(2):258–279. doi: 10.1007/s10162-007-0070-2. [DOI] [PMC free article] [PubMed] [Google Scholar]
- Middlebrooks JC, Snyder RL. Intraneural stimulation for auditory prosthesis: modiolar trunk and intracranial stimulation sites. Hear Res. 2008;242:52–63. doi: 10.1016/j.heares.2008.04.001. [DOI] [PubMed] [Google Scholar]
- Morris DJ, Pfingst BE. Effects of electrode configuration and stimulus level on rate and level discrimination with cochlear implants. J Assoc Res Otolaryngol. 2000;1:211–223. doi: 10.1007/s101620010022. [DOI] [PMC free article] [PubMed] [Google Scholar]
- Nelson DA, Donaldson GS, Kreft H. Forward-masked spatial tuning curves in cochlear implant users. J Acoust Soc Am. 2008;123:1522–1543. doi: 10.1121/1.2836786. [DOI] [PMC free article] [PubMed] [Google Scholar]
- Nuding SC, Chen GD, Sinex DG. Monaural response properties of single neurons in the chinchilla inferior colliculus. Hear Res. 1999;131:89–106. doi: 10.1016/S0378-5955(99)00023-4. [DOI] [PubMed] [Google Scholar]
- Pfingst BE, Franck KH, Xu L, Bauer EM, Zwolan TA. Effects of electrode configuration and place of stimulation on speech perception with cochlear prostheses. J Assoc Res Otolaryngol. 2001;2:87–103. doi: 10.1007/s101620010065. [DOI] [PMC free article] [PubMed] [Google Scholar]
- Ramachandran R, Davis KA, May BJ. Single-unit responses in the inferior colliculus of decerebrate cats. I. Classification based on frequency response maps. J Neurophysiol. 1999;82:152–163. doi: 10.1152/jn.1999.82.1.152. [DOI] [PubMed] [Google Scholar]
- Rebscher SJ, Snyder RL, Leake PA. The effect of electrode configuration and duration of deafness on threshold and selectivity of responses to intracochlear electrical stimulation. J Acoust Soc Am. 2001;109:2035–2048. doi: 10.1121/1.1365115. [DOI] [PubMed] [Google Scholar]
- Rebscher SJ, Hetherington AM, Snyder RL, Leake PA, Bonham BH. Design and fabrication of multichannel cochlear implants for animal research. J Neurosci Methods. 2007;166:1–12. doi: 10.1016/j.jneumeth.2007.05.013. [DOI] [PMC free article] [PubMed] [Google Scholar]
- Relkin EM, Doucet JR. Is loudness simply proportional to the auditory nerve spike count? J Acoust Soc Am. 1997;101:2735–2740. doi: 10.1121/1.418561. [DOI] [PubMed] [Google Scholar]
- Rose JE, Greenwood DD, Goldberg JM, Hind JE. Some discharge characteristics of single neurons in the inferior colliculus of the cat. I. Tonotopical organization, relation of spike counts to tone intensity and firing patterns of single elements. J Neurophysiol. 1963;26:294–320. doi: 10.1152/jn.1963.26.2.321. [DOI] [PubMed] [Google Scholar]
- Ryan AF, Miller JM, Wang ZX, Woolf NK. Spatial distribution of neural activity evoked by electrical stimulation of the cochlea. Hear Res. 1990;50:57–70. doi: 10.1016/0378-5955(90)90033-L. [DOI] [PubMed] [Google Scholar]
- Schoenecker MC, Bonham BH (2008) Fast stimulus artifact recovery in a multichannel neural recording system. In: Proceedings of the IEEE Biomedical Circuits and Systems Conference, pp 253–256. [DOI] [PMC free article] [PubMed]
- Schreiner CE, Langner G. Laminar fine structure of frequency organization in auditory midbrain. Nature. 1997;388:383–386. doi: 10.1038/41106. [DOI] [PubMed] [Google Scholar]
- Schreiner CE, Raggio MW. Neuronal responses in cat primary auditory cortex to electrical cochlear stimulation. II. Repetition rate coding. J Neurophysiol. 1996;75:1283–1300. doi: 10.1152/jn.1996.75.3.1283. [DOI] [PubMed] [Google Scholar]
- Seshagiri CV, Delgutte B. Response properties of neighboring neurons in the auditory midbrain for pure-tone stimulation: a tetrode study. J Neurophysiol. 2007;98:2058–2073. doi: 10.1152/jn.01317.2006. [DOI] [PMC free article] [PubMed] [Google Scholar]
- Shamma SA, Fleshman JW, Wiser PR, Versnel H. Organization of response areas in ferret primary auditory cortex. J Neurophysiol. 1993;69:367–383. doi: 10.1152/jn.1993.69.2.367. [DOI] [PubMed] [Google Scholar]
- Shannon RV. Multichannel electrical stimulation of the auditory nerve in man. I. Basic psychophysics. Hear Res. 1983;11:157–189. doi: 10.1016/0378-5955(83)90077-1. [DOI] [PubMed] [Google Scholar]
- Shannon RV. Multichannel electrical stimulation of the auditory nerve in man. II. Channel interaction. Hear Res. 1983;12:1–16. doi: 10.1016/0378-5955(83)90115-6. [DOI] [PubMed] [Google Scholar]
- Smith ZM, Delgutte B. Using evoked potentials to match interaural electrode pairs with bilateral cochlear implants. J Assoc Res Otolaryngol. 2007;8:134–151. doi: 10.1007/s10162-006-0069-0. [DOI] [PMC free article] [PubMed] [Google Scholar]
- Snyder RL, Bonham BH (2007) Responses of Inferior Colliculus Neurons to SAM Tones and Electrical Pulse Trains. In: Thirtieth Annual Midwinter Research Meeting of the Association for Research in Otolaryngology (Santi PA, ed), p 219. Denver, Colorado, USA
- Snyder RL, Rebscher SJ, Cao KL, Leake PA, Kelly K. Chronic intracochlear electrical stimulation in the neonatally deafened cat. I: Expansion of central representation. Hear Res. 1990;50:7–33. doi: 10.1016/0378-5955(90)90030-S. [DOI] [PubMed] [Google Scholar]
- Snyder RL, Bierer JA, Middlebrooks JC. Topographic spread of inferior colliculus activation in response to acoustic and intracochlear electric stimulation. J Assoc Res Otolaryngol. 2004;5:305–322. doi: 10.1007/s10162-004-4026-5. [DOI] [PMC free article] [PubMed] [Google Scholar]
- Snyder RL, Middlebrooks JC, Bonham BH. Cochlear implant electrode configuration effects on activation threshold and tonotopic selectivity. Hear Res. 2008;235:23–38. doi: 10.1016/j.heares.2007.09.013. [DOI] [PMC free article] [PubMed] [Google Scholar]
- Stickney GS, Loizou PC, Mishra LN, Assmann PF, Shannon RV, Opie JM. Effects of electrode design and configuration on channel interactions. Hear Res. 2006;211:33–45. doi: 10.1016/j.heares.2005.08.008. [DOI] [PubMed] [Google Scholar]
- Honert C, Stypulkowski PH. Single fiber mapping of spatial excitation patterns in the electrically stimulated auditory nerve. Hear Res. 1987;29:195–206. doi: 10.1016/0378-5955(87)90167-5. [DOI] [PubMed] [Google Scholar]
- Wang X, Lu T, Snider RK, Liang L. Sustained firing in auditory cortex evoked by preferred stimuli. Nature. 2005;435:341–346. doi: 10.1038/nature03565. [DOI] [PubMed] [Google Scholar]
- Young ED. Cochlear nucleus. In: Shepherd GM, editor. The synaptic organization of the brain. 5. New York: Oxford University Press; 2003. [Google Scholar]
- Zwolan TA, Kileny PR, Ashbaugh C, Telian SA. Patient performance with the Cochlear Corporation "20 + 2" implant: bipolar versus monopolar activation. Am J Otol. 1996;17:717–723. [PubMed] [Google Scholar]


