Abstract
Fluorescence emission spectroscopy was used to investigate interactions between two effectors and BenM, a transcriptional regulator of benzoate catabolism. BenM had a higher affinity for cis,cis-muconate than for benzoate as the sole effector. However, the presence of benzoate increased the apparent dissociation constant (reduced the affinity) of the protein for cis,cis-muconate. Similar results were obtained with truncated BenM lacking the DNA-binding domain. High-level transcriptional activation may require that some monomers within a BenM tetramer bind benzoate and others bind cis,cis-muconate.
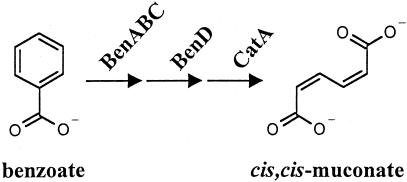
BenM, a member of the large and diverse family of LysR-type transcriptional regulators, controls benzoate degradation by the soil bacterium Acinetobacter sp. strain ADP1 (7, 20). BenM belongs to a LysR-type subfamily controlling the bacterial catabolism of aromatic compounds, including pollutants (6, 8, 12, 17-19, 22, 23). Many regulators in this subfamily bind cis,cis-muconate (hereafter designated muconate) or halogen-substituted muconates as effectors. BenM additionally responds to benzoate, a compound that generates muconate during its catabolism (depicted in Fig. 1). Furthermore, benzoate and muconate together have a synergistic effect on transcriptional activation (1). Thus, it seems likely that both compounds bind simultaneously to a BenM tetramer. Effector-dependent transcription and DNA-binding properties have been characterized for several muconate-responsive proteins (1, 3, 14, 15, 18). However, there have been no direct studies of their interactions with effectors. Here, fluorescence emission spectroscopy was used to investigate the interactions of BenM with benzoate and muconate. These studies raise the possibility that effector-dependent conformational changes in the tetrameric form of BenM provide the basis for transcriptional synergism.
FIG. 1.
BenM responds to benzoate and its catabolite cis,cis-muconate. BenM activates the expression of genes coding for BenABC, BenD, and CatA, the enzymes that convert benzoate to muconate. The degradation of muconate to tricarboxylic acid cycle intermediates enables benzoate to serve as a sole carbon source for strain ADP1 (7).
To confirm the function of the region postulated to interact with effectors, a truncated BenM derivative was generated that lacks 80 N-terminal amino acids. The removal of this N-terminal region may facilitate structural studies in a fashion similar to that observed for OxyR and CysB, two distantly related LysR-type regulators (2, 21). As reported here, we determined the affinities of muconate and benzoate for BenM and the engineered protein, which was designated BenM-EBD after proving to encompass the effector-binding domain of the regulator.
BenM-EBD lacks the putative DNA-binding domain.
Residues 18 to 37 of BenM are predicted to form a DNA-binding helix-turn-helix structure (10, 16, 20). To remove this region, a benM segment was amplified with two PCR primers, 5′-TCAATTCATATGACCAAGCGCATTGCC-3′ (BenM-81) and 5′-TCAATTCTCGAGCCAGTTTGGCGGCTCAGTAAA-3′ (BenM-3-Xho), and inserted into vector pET21b (Novagen) by using the engineered (underlined) restriction sites NdeI and XhoI. The benM segment was subsequently expressed from plasmid pBAC435 to produce a protein in Escherichia coli missing 80 amino acids at the N terminus of BenM. This BenM-EBD protein contained a six-histidine tag at the C terminus to facilitate protein purification. Two amino acids, leucine and glutamate, were also added between the native C terminus and the histidine tag. The methods used to generate and purify this protein were similar to those used for the histidine-tagged full-length BenM protein (1, 4). BenM-EBD was obtained at greater than 95% purity, as assessed by sodium dodecyl sulfate-polyacrylamide gel electrophoresis. Gel filtration and liquid chromatography-mass spectrometry methods indicated that BenM-EBD is a dimer in solution (5) while the full-length protein is a tetramer in solution (1).
Similarity between BenM and BenM-EBD in interactions with benzoate.
BenM-EBD was compared to the full-length regulator by fluorescence emission spectroscopy, a sensitive technique for detecting interactions that directly or indirectly alter the environment of tryptophan residues (11). BenM and BenM-EBD each have a single tryptophan that precedes a histidine purification tag. This tryptophan constitutes the C terminus of the 304-amino-acid native regulator. The histidine tag of the full-length protein does not alter the regulatory function in vitro or in vivo (1), and the designation BenM here refers to the histidine-tagged full-length protein used in these studies.
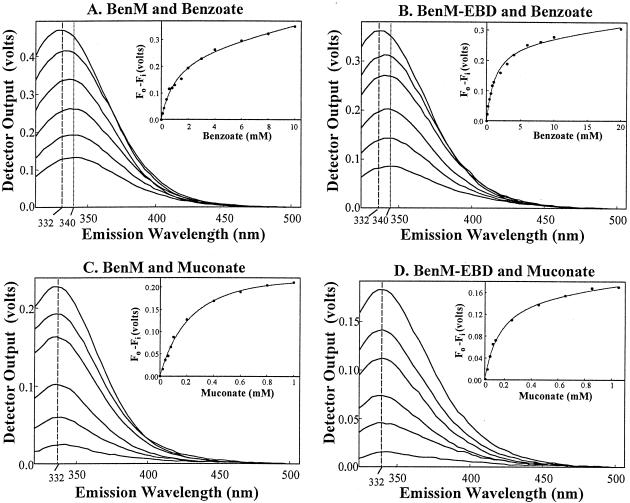
The effects of benzoate on the fluorescence emission spectra of the proteins were determined with an excitation wavelength of 280 nm (Fig. 2A and B). The spectrofluorimeter used (RSM-1000; OLIS, Inc.) has a 450-W Xe lamp with an 8-nm band pass for the exit slit, on the excitation monochromator. The band passes for the entrance and scan disk slits, respectively, of the emission monochromator are 4 and 6 nm. Samples of BenM or BenM-EBD were diluted to a final monomeric concentration of 2 μM with buffer (20 mM Tris-HCl [pH 7.9], 500 mM NaCl, 10% glycerol). Effectors (2 to 10 μl) were added to the protein solutions to achieve final concentrations in the range of 10 μM to 10 mM in a total reaction volume of 2 ml. The fluorescence emission was scanned at 25°C for 30 s with 31 scans/s over a wavelength range of 300 to 900 nm. Data were analyzed by curve fitting to a single species by using global analysis software provided by OLIS (13).
FIG. 2.
Fluorescence emission spectra of BenM and BenM-EBD. Emission intensities were assessed by using voltage measurements from the spectrofluorimeter (y axes). Vertical lines indicate the wavelengths corresponding to the maximum intensities of the spectra. From the top to the bottom of panels A and B, the spectra correspond to protein samples with 0, 0.2, 0.6, 2, 4, and 8 mM benzoate with an excitation wavelength of 280 nm. From the top to the bottom of panels C and D, the spectra correspond to protein samples with 0, 0.04, 0.08, 0.2, 0.4, and 0.8 mM muconate with an excitation wavelength of 295 nm. Each spectrum was compiled from the average values of at least three separate experiments. The standard deviations of the averages were less than 20% of the corresponding values. In the insets, the change in spectrum intensity, measured at 340 nm (panels A and B) or at 332 nm (panels C and D), was plotted versus the amount of effector. This change was determined as the initial fluorescence (Fo) minus the fluorescence at concentration i of the effector (Fi). In these plots, the curves were fitted to a hyperbolic binding isotherm (Table 1).
The top spectrum in each panel corresponds to the emission of the protein without effectors (Fig. 2). Addition of benzoate to BenM or BenM-EBD caused a concentration-dependent decrease in the intensity of the spectrum (panels A and B). This result suggests that the sole tryptophan residue is in or near the effector-binding site or that benzoate causes a conformational change in the protein. The intensity change versus the benzoate concentration was plotted (panel insets), and the data matched well with curves fitted to a hyperbolic regression function (for the equation used, see Table 1, footnote a). The shape of the curves indicated that different protein monomers had the same affinity for benzoate. There was no indication of cooperative binding of benzoate to either the BenM tetramer or the BenM-EBD dimer. The affinity of each protein for benzoate was determined (11). With BenM or BenM-EBD, half-maximal fluorescence quenching was achieved with approximately 1 mM benzoate, a value that represents the dissociation constant for this effector (Table 1).
TABLE 1.
Effector dissociation constantsa for BenM and BenM-EBD
| Effector |
Kd (mM)b
|
|
|---|---|---|
| BenM | BenM-EBD | |
| Benzoate | 1.2 ± 0.2 | 1.1 ± 0.1 |
| Muconate | 0.28 ± 0.05 | 0.12 ± 0.02 |
| Muconate + 1 mM benzoate | 0.49 ± 0.09 | 0.20 ± 0.03 |
The dissociation constants for the protein-effector complexes were determined with the following equation and the Sigmaplot 2000 software hyperbolic regression function (SPSS Inc.): ΔVoltsobs = (ΔVoltsmax [E]/Kd[E]) + c[E]. In this equation, ΔVoltsobs is the observed change in voltage, [E] is the effector concentration, Kd is the dissociation constant for the effector, and c accounts for the inner-filter effect of the effector on the fluorescence signal.
The values shown are averages of at least three experiments.
The maximum fluorescence emission intensity occurred at approximately 332 nm for each protein in the absence of effectors. This maximum shifted to higher wavelengths as the concentration of benzoate increased (vertical lines in Fig. 2). This red shift is indicative of the tryptophan residue being exposed to a more hydrophilic environment in the presence of benzoate (9). Thus, benzoate appears to alter the local conformation of the tryptophan in both BenM and BenM-EBD and may indicate that more substantial structural changes occur.
Differences between the effects of muconate and benzoate on BenM and BenM-EBD.
The strong absorbance of muconate at 280 nm precluded the use of this excitation wavelength; hence, an excitation wavelength of 295 nm was used to study muconate-protein interactions (Fig. 2C and D). Muconate, like benzoate, quenched the fluorescence in a concentration-dependent fashion consistent with muconate binding to BenM and BenM-EBD. As was found for benzoate, the data fit hyperbolic curves (insets) well, indicating the absence of cooperativity in the binding of muconate to different protein subunits. It required less muconate than benzoate to achieve a comparable reduction in fluorescence intensity, indicating that BenM and BenM-EBD have higher affinities for muconate than for benzoate (Table 1).
Unlike benzoate, muconate failed to shift the wavelength maximum of the emission spectrum from 332 nm, regardless of the muconate concentration (vertical lines in Fig. 1C and D). The absence of a shift suggests that muconate binding does not significantly alter the polarity of the tryptophan environment. Thus, the benzoate-induced alteration of the protein conformation appears distinct from muconate-induced effects on BenM and BenM-EBD. Furthermore, while both proteins had similar affinities for benzoate, BenM-EBD had approximately twice the affinity for muconate that the full-length regulator did (Table 1). While the basis for the higher affinity of BenM-EBD for muconate is not evident, the truncated protein clearly interacts with both effectors.
Binding of muconate to BenM in the presence of benzoate.
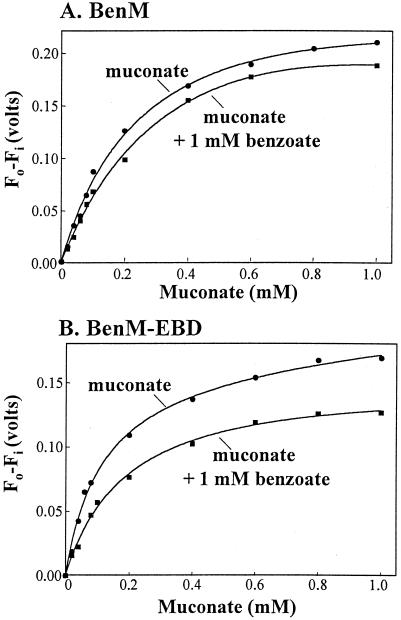
To investigate simultaneous interactions between the two effectors and a regulatory protein, the affinity of BenM (or BenM-EBD) for muconate was assayed in the presence of 1 mM benzoate (approximately equal to the dissociation constant for this effector). The ability of benzoate to increase the affinity of BenM for muconate would be indicative of cooperativity. Instead, benzoate decreased the apparent affinity of BenM and BenM-EBD for muconate by a factor of 2 (Fig. 3 and Table 1). This result is consistent with competitive binding of the two effectors, although the data do not rule out the possibility that the two compounds bind to different sites on the regulatory protein. Previous studies failed to detect any cooperative effects of the two compounds on transcription in vitro (1). A small amount of one compound does not boost the activation abilities of the other. Rather, maximal transcriptional activation occurs with approximately equimolar amounts of both compounds (1).
FIG. 3.
Benzoate caused the apparent binding affinity of BenM and BenM-EBD for muconate to decrease. Graphs were plotted from spectral data as described for Fig. 2. Spectral changes were measured at 332 nm for muconate alone or at 340 nm when benzoate was present. Dissociation constants derived from these data are shown in Table 1.
Regulatory model.
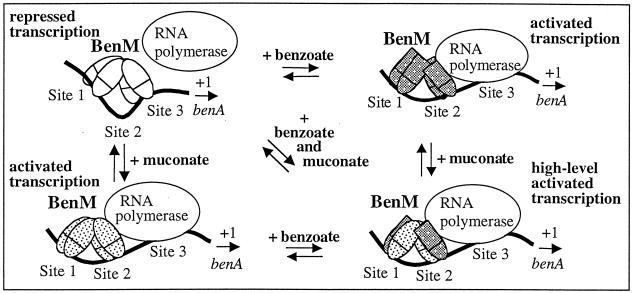
A previous regulatory model based on DNase I footprinting and in vitro transcription studies (1) was modified in accordance with the results of fluorescence emission spectroscopy. As depicted in Fig. 4, a BenM tetramer bound solely to muconate (lower left corner) has a different conformation than when interacting solely with benzoate (upper right corner). Consistent with this model, benzoate, but not muconate, altered the wavelength of the fluorescence emission maximum of BenM (Fig. 2). The different conformations of the tetramer could affect contacts with RNA polymerase and account for the ability of muconate to activate BenM-dependent benA transcription to a higher maximal level than benzoate does (1).
FIG. 4.
Model of BenM-regulated expression of benA. The levels of transcriptional repression or activation and the positions of BenM dimers on three DNA-binding sites (sites 1, 2, and 3) were determined by DNase I footprinting and in vitro transcription assays (1). A previous regulatory model was modified here to indicate that high-level transcription might require a BenM tetramer composed of some subunits bound to benzoate and others bound to muconate. The cartoon depicts one possible oligomeric configuration for high-level transcription. However, whether benzoate and muconate bind exclusively to a subunit remains to be investigated, as does the stoichiometry of effector binding. Dotted or gray patterns indicate the binding of muconate or benzoate, respectively, to the BenM protein. Conformational changes in the protein caused by benzoate may be different from those caused by muconate, as indicated by different shapes in the effector-binding regions of the BenM monomers (ovals or rectangles).
The synergistic effect on transcription may involve some subunits in the BenM tetramer being bound to benzoate and others being bound to muconate. The stoichiometry of effector binding within the subunits and the tetramer remains to be investigated, and the model is meant solely to represent the idea that a “mixed” oligomer could have a unique conformation only attainable in the presence of both compounds. This conformation could be required for the highest-level transcriptional activation. This regulatory modulation in response to two effectors provides physiological benefits, since BenM regulates a complex catabolic pathway in which the accumulation of intermediary metabolites is toxic. Benzoate initiates increased gene expression, but maximal transcription would not occur unless muconate signals that degradation is proceeding appropriately. Gene expression would be reduced as benzoate availability decreases, yet the signal from muconate would allow sufficient transcription to complete substrate consumption. While synergistic response of BenM to two distinct compounds is novel, further studies are needed to reveal whether similar mechanisms apply to other transcriptional systems.
Acknowledgments
This research was supported by National Science Foundation grant MCB-0212604 to E.L.N.
We thank Juergen Wiegel for helpful discussions.
REFERENCES
- 1.Bundy, B. M., L. S. Collier, T. R. Hoover, and E. L. Neidle. 2002. Synergistic transcriptional activation by one regulatory protein in response to two metabolites. Proc. Natl. Acad. Sci. USA 99:7693-7698. [DOI] [PMC free article] [PubMed] [Google Scholar]
- 2.Choi, H., S. Kim, P. Mukhopadhyay, S. Cho, J. Woo, G. Storz, and S. Ryu. 2001. Structural basis of the redox switch in the OxyR transcription factor. Cell 105:103-113. [DOI] [PubMed] [Google Scholar]
- 3.Chugani, S. A., M. R. Parsek, C. D. Hershberger, K. Murakami, A. Ishihama, and A. M. Chakrabarty. 1997. Activation of the catBCA promoter: probing the interaction of CatR and RNA polymerase through in vitro transcription. J. Bacteriol. 179:2221-2227. [DOI] [PMC free article] [PubMed] [Google Scholar]
- 4.Clark, T. J. 2002. Structure and function of BenM, a transcriptional activator from Acinetobacter sp. strain ADP1. Ph.D. dissertation. University of Georgia, Athens.
- 5.Clark, T. J., S. Haddad, E. L. Neidle, and C. Momany. 2004. Crystallization of BenM and CatM effector binding domains. Acta Crystallogr. Sect. D 60:105-108. [DOI] [PubMed]
- 6.Coco, W. M., R. K. Rothmel, S. Henikoff, and A. M. Chakrabarty. 1993. Nucleotide sequence and initial functional characterization of the clcR gene encoding a LysR family activator of the clcABD chlorocatechol operon in Pseudomonas putida. J. Bacteriol. 175:417-427. [DOI] [PMC free article] [PubMed] [Google Scholar]
- 7.Collier, L. S., G. L. Gaines III, and E. L. Neidle. 1998. Regulation of benzoate degradation in Acinetobacter sp. strain ADP1 by BenM, a LysR-type transcriptional activator. J. Bacteriol. 180:2493-2501. [DOI] [PMC free article] [PubMed] [Google Scholar]
- 8.Francisco, P., Jr., N. Ogawa, K. Suzuki, and K. Miyashita. 2001. The chlorobenzoate dioxygenase genes of Burkholderia sp. strain NK8 involved in the catabolism of chlorobenzoates. Microbiology 147:121-133. [DOI] [PubMed] [Google Scholar]
- 9.Freifelder, D. 1982. Physical biochemistry: applications to biochemistry and molecular biology, second ed. W. H. Freeman, New York, N.Y.
- 10.Harrison, S. C., and A. K. Aggarwal. 1990. DNA recognition by proteins with the helix-turn-helix motif. Annu. Rev. Biochem. 59:933-969. [DOI] [PubMed] [Google Scholar]
- 11.Lakowicz, J. 1999. Principles of fluorescence spectroscopy, second ed. Kluver Academic, New York, N.Y.
- 12.Liu, S., N. Ogawa, and K. Miyashita. 2001. The chlorocatechol degradative genes, tfdT-CDEF, of Burkholderia sp. strain NK8 are involved in chlorobenzoate degradation and induced by chlorobenzoates and chlorocatechols. Gene 268:207-214. [DOI] [PubMed] [Google Scholar]
- 13.Matheson, I. B. C. 1990. A critical comparison of least absolute deviation fitting (robust) and least-squares fitting—the importance of error distribution. Comput. Chem. 14:49-57. [Google Scholar]
- 14.McFall, S. M., S. A. Chugani, and A. M. Chakrabarty. 1998. Transcriptional activation of the catechol and chlorocatechol operons: variations on a theme. Gene 223:257-267. [DOI] [PubMed] [Google Scholar]
- 15.McFall, S. M., T. J. Klem, N. Fujita, A. Ishihama, and A. M. Chakrabarty. 1997. DNase I footprinting, DNA bending and in vitro transcription analyses of ClcR and CatR interactions with the clcABD promoter: evidence of a conserved transcriptional activation mechanism. Mol. Microbiol. 24:965-976. [DOI] [PubMed] [Google Scholar]
- 16.Muraoka, S., R. Okumura, N. Ogawa, T. Nonaka, K. Miyashita, and T. Senda. 2003. Crystal structure of a full-length LysR-type transcriptional regulator, CbnR: unusual combination of two subunit forms and molecular bases for causing and changing DNA bend. J. Mol. Biol. 328:555-566. [DOI] [PubMed] [Google Scholar]
- 17.Ogawa, N., S. M. McFall, T. J. Klem, K. Miyashita, and A. M. Chakrabarty. 1999. Transcriptional activation of the chlorocatechol degradative genes of Ralstonia eutropha NH9. J. Bacteriol. 181:6697-6705. [DOI] [PMC free article] [PubMed] [Google Scholar]
- 18.Romero-Arroyo, C. E., M. A. Schell, G. L. Gaines III, and E. L. Neidle. 1995. catM encodes a LysR-type transcriptional activator regulating catechol degradation in Acinetobacter calcoaceticus. J. Bacteriol. 177:5891-5898. [DOI] [PMC free article] [PubMed] [Google Scholar]
- 19.Rothmel, R. K., T. L. Aldrich, J. E. Houghton, W. M. Coco, L. N. Ornston, and A. M. Chakrabarty. 1990. Nucleotide sequencing and characterization of Pseudomonas putida catR: a positive regulator of the catBC operon is a member of the LysR family. J. Bacteriol. 172:922-931. [DOI] [PMC free article] [PubMed] [Google Scholar]
- 20.Schell, M. A. 1993. Molecular biology of the LysR family of transcriptional regulators. Annu. Rev. Microbiol. 47:597-626. [DOI] [PubMed] [Google Scholar]
- 21.Tyrrell, R., K. H. Verschueren, E. J. Dodson, G. N. Murshudov, C. Addy, and A. J. Wilkinson. 1997. The structure of the cofactor-binding fragment of the LysR family member, CysB: a familiar fold with a surprising subunit arrangement. Structure 5:1017-1032. [DOI] [PubMed] [Google Scholar]
- 22.van der Meer, J. R., A. C. Frijters, J. H. Leveau, R. I. Eggen, A. J. Zehnder, and W. M. de Vos. 1991. Characterization of the Pseudomonas sp. strain P51 gene tcbR, a LysR-type transcriptional activator of the tcbCDEF chlorocatechol oxidative operon, and analysis of the regulatory region. J. Bacteriol. 173:3700-3708. [DOI] [PMC free article] [PubMed] [Google Scholar]
- 23.You, I. S., and D. Ghosal. 1995. Genetic and molecular analysis of a regulatory region of the herbicide 2,4-dichlorophenoxyacetate catabolic plasmid pJP4. Mol. Microbiol. 16:321-331. [DOI] [PubMed] [Google Scholar]


