

Abstract
AIM
The study aims were to characterize risperidone and (±)-9-hydroxyrisperidone pharmacokinetic variability in children and adolescents and to evaluate covariate effects on pharmacokinetic parameters.
METHODS
Steady-state samples were drawn at pre-dose, 1, 2, 4, and 7 hours post-dose; CYP2D6 genotypes were available for 28 subjects. A non-linear mixed-effects model (NONMEM®) modeled the pharmacokinetics of risperidone and (±)-9-hydroxyrisperidone; covariates included age, weight, sex, and CYP2D6 phenotype. The model included 497 observations [risperidone (n=163), (+) and (−) 9-hydroxyrisperidone (n=334)] from 45 subjects aged 3–18.3 (mean 9.6±3.7) years, weighing 16.8–110 (43±20.2) kg.
RESULTS
A one-compartment mixture model described risperidone and (±)-9-hydroxyrisperidone clearances for three CYP2D6 metabolizer subpopulations: extensive (EM), intermediate (IM), and poor (PM). Weight significantly affected (±)-9-hydroxyrisperidone clearance. Clearance estimates in the mixture model were PM 9.38 L/h, IM 29.2 L/h, and EM 37.4 L/h.
CONCLUSION
Active moiety [risperidone plus (±)-9-hydroxyrisperidone] pharmacokinetic variability and the covariate effects were better explained with addition of metabolite pharmacokinetic parameters. This model may aid development of individualized risperidone dosing regimens in children and adolescents.
Keywords: Risperidone, pharmacokinetics, NONMEM, children, adolescent, CYP2D6
INTRODUCTION
Risperidone is a preferred treatment for children and adolescents with bipolar disorder, irritability associated with autistic disorder, disruptive behavior disorders, and schizophrenia, based on published guidelines and recommendations1–6. Although effective in these populations, risperidone use is not without risks, such as excessive weight gain, insulin resistance, dyslipidemia, hyperprolactinemia, involuntary movements, and sedation, most of which are exaggerated in children7 and often result in non-adherence. Thus, adequate dosing to avoid over- and under-treatment is imperative. Clinical studies in adults suggest plasma risperidone concentrations correlate with clinical response, namely adverse drug reactions (ADRs)8. However, current recommendations do not differentiate among therapeutic disease targets or provide a therapeutic window to avoid side effects. Furthermore, they lack precise dosing recommendations that are allometrically scaled for pediatrics.
Risperidone is an active compound, biotransformed by the enzymes CYP3A4 and CYP2D6, in the liver to the principal active metabolites, (−)- and (+)-9-hydroxyrisperidone ((±)9-OH-risperidone)9–14. Risperidone and the 9-hydroxy metabolites exhibit similar pharmacologic activities15. Genetic variability in the CYP2D6 gene results in variable enzyme function. CYP2D6 genotypes may be used to predict four metabolizer phenotypes, with increasing activities: poor metabolizer (PM), intermediate (IM), extensive (EM), and ultra-rapid metabolizer (UM). Among Caucasian populations, 5–10% of individuals16 have a genotype predictive of a PM phenotype 17.
It is widely accepted that risperidone pharmacokinetic (PK) and response (desired therapeutic effect and occurrence of adverse reactions) variability are not completely predicted by dose18,19. Risperidone and (±)9-OH risperidone concentrations may be influenced by age20, renal function16, and factors affecting metabolism, including genetic polymorphisms, which vary among races/ethnicities, and drug interactions, namely CYP2D6- dependent and -inhibiting co-medications21. The potency and pharmacological profile (ratio of serotonin 2 (5-HT2) receptor: dopamine 2 (D2) receptor antagonism) of (±)9-OH risperidone is similar to that of risperidone22 Risperidone and (±)9-OH-risperidone bind to 5-HT2 and D2 receptors with similar affinities23, yielding comparable therapeutic and toxic responses, hence “active moiety” refers to these compounds collectively. Exposure to the “active moiety” is measured by the sum of the area under the plasma concentration-time curves (AUC) of risperidone and (±) 9-OH risperidone. A study of adults assessed PK parameters to characterize sources of variability in risperidone and metabolite exposure and concluded age affected 9-OH risperidone (but not risperidone) clearance; older patients may have greater active metabolite exposure, increasing risk for adverse drug reactions24. Aichhorn reported females had significantly higher plasma risperidone concentrations than males in adolescents 10–18 years of age25, which agrees with their adult findings20. Aichhorn suggested the differences were explained by differences in mean body weight in adults. This was not consistent with findings of de Leon, who noted a similar effect, not explained by body weight after analysing sex, adjusted for weight26.
Developmental differences between children and adults suggest weight, sex, and age warrant further study to understand the variability in exposure in the context of typical treatment in children and adolescents, as the few published studies do not include children or adolescents. In this study, we applied nonlinear mixed-effect modeling to characterize the PK of risperidone and (±) 9-OH risperidone individually as well as collectively (collectively termed the active moiety), in a pediatric cohort. To identify potential factors contributing to PK variability, we aimed to investigate covariates including age, weight, height, and sex. The resulting study population was mostly male (88.9%). Hence, these covariates were incorporated in the model, but we did not anticipate an apparent signal would be detected, with respect to sex. In a subset of subjects (28/45) for whom genotypes were available, the effect of differing CYP2D6 phenotypes was also studied.
MATERIALS AND METHODS
This study was approved by the Cincinnati Children’s Hospital Medical Center (CCHMC), The Ohio State University Biomedical Human Subjects, and Rainbow Babies and Children’s Hospital Institutional Review Boards; subjects were enrolled between June 2001 and May 2003. Criteria for inclusion were age less than 18 years at the time of risperidone initiation, and active treatment with risperidone for a neuropsychiatric disorder. Females who had a positive pregnancy test were excluded.
Forty-one of the 45 subjects participated in one of two previous open-label risperidone PK investigations27,28 at CCHMC, The Ohio State University (Columbus, Ohio) and Rainbow Babies and Children’s Hospital (Cleveland, Ohio). These studies employed one of two sampling strategies: D-optimal, in which four or five blood samples were obtained for plasma concentrations, or sparse, in which two blood samples were obtained. Nineteen of the 41 subjects in these investigations were also genotyped for common CYP2D6 single nucleotide polymorphisms (SNPs; *3, *4, *5, deletion, and duplication). Of these 19 subjects, 17 were extensive metabolizers (EMs), one was an intermediate metabolizer (IM), one was a poor metabolizer (PM); and there were no ultra-rapid metabolizers. Consequently, to have a larger sample of CYP2D6 PMs in the cohort, an enrichment protocol was initiated with the aims of contacting previous subjects for genotyping, and prospectively enrolling additional subjects who were known CYP2D6 PMs on stable risperidone. Subjects were enrolled between December 2008 and June 2010. D-optimal sampling schedules were employed for all prospectively enrolled subjects. Blood samples were taken at steady-state after at least 4 weeks of treatment at the same dose level. Samples were drawn prior to the dose (t=0) and at the D-optimal time points (± 20%) as calculated with the SAMPLE module using ADAPT II (Release 4, Biomedical Simulations Resource, University of Southern California)29,30 by using preliminary pediatric risperidone PK estimates (Dr. D. Svinarov, personal communication)31: pre-dose, 0.29, 1.38 and 8.2 h after an oral dose during maintenance treatment.
Data collection included demographics, risperidone dose and schedule, diagnoses, disease states, and concomitant medications in the three days prior to and on the day of the study visit. Subjects fasted for at least two hours prior to their dose. Blood samples were obtained 0–30 minutes prior to, and 60–120 minutes and 4–7 hours after the oral risperidone dose. Plasma concentrations of risperidone and (±)9-hydroxyrisperidone were quantified using a validated, enantioselective, liquid-liquid extraction liquid chromatography-mass spectrometry (LC-MS/MS) assay, using published methods32. Nineteen of the 41 subjects in these investigations were also genotyped for common CYP2D6 SNPs. In the enrichment protocol, previous subjects were contacted to provide samples for genotyping. Six new subjects and 23 prior subjects who provided new samples were genotyped using an expanded CYP2D6 SNP panel, which included *2A, *3, *4, *5, *6, *7, *8, *9, *10, *11, *14, *15, *17, *18, *19, *20, *40, *41, *42, deletion, and duplication. DNA extraction and CYP2D6 genotyping were performed in the Molecular Genetics Laboratory at CCHMC using published methods33,34. CYP2D6 genotypes were available for 62% (28/45) of subjects, and none had a genotype predicting an ultra-rapid metabolizer phenotype. The 38% (17/45) of subjects who were not genotyped may have had any CYP2D6 genotype (and phenotype), though poor and ultra-rapid metabolizer genotypes are uncommon in this population, based on the distribution in the initial cohort (5.25% PM, 5.25% IM, 89.5% EM, and 0% UM) and ~2000 patients genotyped in the CCHMC Molecular Genetics Lab (6% PM, 32% IM, 57% EM, 3% UM, and ~3% unknown).
Pharmacokinetic Modeling
The population PK analysis of risperidone and (±)-9-OH risperidone was performed using nonlinear mixed effect modeling (NONMEM, version VI, ICON Dev. Soln., Ellicott City, MD) with PDx-Pop® (version 3.0, 2007 ICON Dev. Soln., Ellicott City, MD) interfaced with Xpose® (version 4.0, release 6, update 1). The PK parameters investigated included time to peak risperidone concentration (Tmax); peak risperidone concentration (Cmax); area under the curve (AUC) and apparent oral clearance (CL/F). The analysis included the development of a base model defining the PK parameters and a final covariate model describing the impact of patient characteristics, with all statistical and graphical analysis generated from NONMEM output. First order conditional estimation (FOCE) with interaction methods were used in development of one compartment, two compartment, and mixture structural models. FOCE with interaction method was used for development of the final models.
During model development, all compartment models were parameterized in terms of values of oral clearance (CL/F), volume of distribution (Vd/F) and absorption rate constant (Ka). The models described the disposition of risperidone and (±)-9-OH risperidone following oral administration. Models were evaluated and selected based on goodness of fit and a variety of criteria including physiological plausibility and stability. Stability was tested by using the nonparametric bootstrap approach to asses if repeated fitting of the model resulted in similar parameter estimates. Standard errors were assessed for all parameters. Further assessment and comparison used the likelihood ratio test and reviewed changes in the objective function value (OFV, −2 log likelihood) between models. Improvement in model fit was determined using chi-squared distribution with one degree of freedom (ΔOFV <3.84 = p <0.05).
Models were also compared using the Akaike information criterion (AIC) and Schwarz Bayesian criterion to discriminate between non-hierarchical models in the selection of a structural model35.During model development the following diagnostic plots were used to visually assess model fit: observed vs. population predicted (PRED) or individual predicted (IPRED) values. Plots of residuals and conditional weighted residuals (CWRES) vs. time or PRED were also examined. The final PK models were further evaluated by generating visual predictive checks.
The modeling determined random effects for the PK parameters to account for differences and similarities between individuals and observations. The terms for variability in the model included inter-individual variability and residual (unexplained) variability (RUV). Estimations of inter-individual and residual variability were assessed for evidence of model over-parameterization36. Due to the use of a mixture model, which included multiple parameters for CL for the different metabolizer phenotypes, over-parameterization was assessed as part of the routine model diagnostics to determine if inclusion of these parameters was appropriate for the proposed model.”
Inter-individual variability was assumed to be log-normally distributed as has been reported previously in the literature24 and assessed using exponential (equation 1) variability models.
| [1] |
Where Pi represents the value of the PK parameter for the ith individual, θpop represents the population mean for P and η 37 represents between-subject random effect with a mean of zero and variance of ω2.
A residual error model estimating variability related to the two sampling strategies (D-optimal and sparse) used in the studies was evaluated during model development. The model was found not to improve the OFV significantly, compared with an error model estimating variability for risperidone and (±)-9-OH risperidone. A combined residual error model estimating residual variability related to the sampling strategies and risperidone and (±)-9-OH risperidone was found to be highly correlated and did not improve the OFV. The RUV error models evaluated used a combined additive and constant coefficient of variation error model for risperidone and (±)-9-OH risperidone (equation 2).
| [2] |
Where yij is the observed concentration in individual i at time j, ymij is the corresponding model prediction, and εij is a normally distributed random error with a mean of zero and a variance of σ2.
Covariate analysis
Patient characteristics investigated included age, sex, race and body weight. Age was also investigated as a covariate with two sub-populations (children, 2–12 years and adolescents 12–19 years). Various methods were tested in the model for inclusion of weight, these included, a priori, standardizing body weight to 70 kg and applying a power calculation using the population mean38. Allometric scaling was used to allow for standardization of body weight between the parameter estimates determined for a pediatric population with those reported for adults (70 kg) by fixing the exponents in the allometric model to 0.75 for CL/F (equation 3) and to 1 for Vd/F39.
| [3] |
Where CLi the individual CL in the ith individual, CLpop is the estimate of the population CL, ηcl is the random between subject variability (BSV), θ shift parameter describing the systematic dependence of CL on individual body weight, BW is body weight of the ith individual.
An exploratory analysis was used to look for relationships between the PK parameters and covariates by visually inspecting plots of the empirical Bayesian estimates and posthocs, of individual parameters from the base model against covariate values.
Individual parameter estimates and the normalized eta deviations were investigated as appropriate to determine relationships between the PK parameters and covariates. Allometric scaling was applied to CL/F and Vd/F, also investigated a priori, and standardized to a body weight of 70 kg38. Following the initial analysis, covariates were included into the model using a forward stepwise inclusion approach and added into the model until there was no further decrease in OFV. Covariates were subsequently removed from the model using a backward stepwise approach. Change of the OFV approximates the chi-squared distribution (χ2), with one degree of freedom; a change > 3.84 in OFV was considered significant.
Model evaluation
Bootstrapping was used to assess uncertainty in the parameter estimates. The final PK models were evaluated using a non-parametric sampling with replacement40. PDx-Pop® was used to generate 1000 bootstrap runs by random sampling using the original dataset. Standard errors for the estimated population parameters and random effects error models were also assessed. Bootstrap techniques were one of the standard diagnostics used to assess the model along with assessment of goodness-of-fit plots and a visual predictive check.
RESULTS
Subjects had a mean ±SD age of 9.6 ± 3.7 years and weight of 43 ± 20.2 kg. The majority of the subjects were white (n=42), male (n=40), and all reported they were non-Hispanic (Table 1). One subject was removed from the dataset following the model building as an outlier, as inclusion of the subject caused a significantly increase in the OFV of more than 50 (p<0.001); this was not explained by any covariate in the study, in the base or final models. When graphed the data from the subject significantly skewed the line of identity. Autistic disorder was the predominant neuropsychiatric diagnosis, for which the subjects were treated with risperidone at an average daily dose of 2.0 ± 1.5 mg (0.25–6). Subjects received risperidone in tablet form (n=34) or in liquid form (n=6) and were dosed by their personal clinicians, not based on study participation. Most (n=39) subjects received risperidone twice a day and many (n=33) reported taking concomitant medications.
Table 1.
Subject characteristics
| Demographics | n (%) |
|---|---|
|
| |
| Subjects | 45 |
| Children (2–12 years) | 32 (71.1%) |
| Adolescent (12–21 years) | 13 (28.8%) |
| Number of observations | |
| Risperidone | 168 |
| (−)-9-hydroxyrisperidone | 172 |
| (+)-9-hydroxyrisperidone | 172 |
| Sex | |
| Male | 40 (88.9%) |
| Female | 5 (11.1%) |
| Race | |
| White | 42 (93.3%) |
| White + Black (mixed) | 3 (6.7%) |
| Ethnicity | |
| Non-Hispanic | 45 (100%) |
| Age (years) | 9.6 ±3.7 (3–18.3) |
| Weight (kg) | 43 ±20.2 (16.8–110) |
| Mean ±SD (range) | |
| Dose range (total daily dose, mg) | (0.25–6.00) |
| Risperidone concentration (ng/mL) | 6.5 ±6.4 (0.14–30.1) |
| (−)-9-hydroxyrisperidone (ng/mL) | 8.4 ±7.6 (0.5–44.0) |
| (+)-9-hydroxyrisperidone (ng/mL) | 3.84 ±2.97 (0.4–12.6) |
| CYP2D6 | n = 28 |
| Phenotype | 15 extensive metabolizer |
| 6 intermediate metabolizer | |
| 7 poor metabolizer | |
| Genotype | 5(*1/*1); 8(*1/*2A); 2(*1/*2); 2(*1/*41); 1(*1/*4); 1(*1/*5); 1(*1/*6); 1(*1/*9); 1(*4/*4DUP); 5(*4/*4); 1(*4/*5) |
SD = standard deviation; ng = nanograms; mL = millilitres; mg = milligrams; kg = kilograms; CYP2D6 = cytochrome P450 2D6; DUP = duplication.
Pharmacokinetic Data
A total of 172 blood samples were drawn and available for risperidone and (±) 9-OH risperidone PK analysis. Sparse sampling data were available for 18 subjects and D-optimal sampling for 27 subjects. From the 27 subjects with D-optimal sampling, 19 subjects provided five blood samples, and 9 subjects provided four blood samples. There were 163 risperidone and 334 metabolite [167 (+) - and 167 (−)-9 OH risperidone] plasma concentrations. Because the assay is enantioselective, each enantiomer of the metabolite, (−) and (+), had a plasma concentration, totalling 334; there were four more metabolite concentration available than parent drug (risperidone) concentrations. The missing plasma concentrations of risperidone were due to undetectable plasma concentrations or plasma concentrations beneath the lower limit of quantification (0.2 ng/mL for risperidone and 9-OH risperidone enantiomers) of the drug assay and were treated as missing data. Given the small number of samples to which this applied, it is unlikely this would have any impact on the models developed41. Individual concentration-time profiles for risperidone were plotted for each subject and analyzed visually.
Population Pharmacokinetic models
Varying structural models were explored to determine the model which would provide the best fit. The different structural model approaches used to investigate the PK parameters of risperidone and (±) 9-OH risperidone included: 1) a one-compartment model only including the parent compound, risperidone; 2) risperidone and (±) 9-OH risperidone were tested in the same one compartment model, using identifiers within the data labels to separate them out.; and 3) a mixture model (with risperidone and 9-OH risperidone) to investigate the contribution of CYP2D6 phenotype to risperidone metabolism. CYP2D6 metabolizer subpopulations (PM, IM, EM) were estimated in the mixture model for clearance and fraction of risperidone metabolized to (±) 9-OH risperidone.
A one-compartment model was used to describe the plasma concentrations of risperidone and (±) 9-OH risperidone. The base model for risperidone and (±) 9-OH risperidone was a one-compartment model with first-order absorption and first-order elimination. The model included estimates for the fraction of risperidone metabolized to (±) 9-OH risperidone, CL/F for (±) 9-OH risperidone and Vd/F for (±) 9-OH risperidone. The model was similar in structure to that previously outlined by Feng et al24. Parameter estimates for risperidone included CL/F 16.8 L/h (11.8–21.8, 95% CI), Vd/F 62.4 L (42–82.8, 95% CI) and Ka was fixed to 2.6 h−1. The final parameter estimate for (±) 9-OH risperidone clearance (CLM/F, L/h) was 4.9 (2.4–7.4, 95% CI), and (±) 9-OH risperidone volume of distribution (VdM/F, L) was set to equal risperidone Vd/F. The fraction of risperidone converted to (±) 9-OH risperidone was estimated as 0.13 (0.1–0.16 95% CI). Univariate analysis determined age (p<0.05) and body weight (p<0.001) to affect clearance of risperidone and of (±) 9-OH risperidone significantly. Following multivariate analysis, the final covariate model determined (±) 9-OH risperidone clearance increased with increasing weight.
Mixture Model
A mixture model using a one compartment model structure was used to investigate the contribution of CYP2D6 phenotype on risperidone metabolism. Initial model development defined two subpopulations: CYP2D6 EMs and CYP2D6 reduced metabolizers (RMs; individuals with one or more reduced function CYP2D6 alleles). Clearances in EMs and RMs were estimated as 70 and 9.9 L/h, respectively. The percentages of subjects in each subpopulation were estimated at 42.7% (EMs) and 32.8% (RMs). Body weight significantly affected 9-OH risperidone clearance, 4.05 L/h/70 kg. No other tested covariates were found to have a significant effect on the parameter estimates.
Subsequently, a one-compartment mixture model was used to describe risperidone and (±) 9-OH risperidone concentration data and to distinguish CYP2D6 in three subpopulations, EMs, IM, and PMs. The model with estimation of all three parameters was unstable; therefore, the fraction of risperidone to (±) 9-OH risperidone for IMs was fixed to help stabilize the model. When this fraction was unfixed, there was poor model fit and the estimated relative clearances for CYP2D6 IMs were unrealistically high. This then allowed for the estimation of the fraction of risperidone to and (±) 9-OH risperidone to be determined for the PM and EM populations. The percentages of subjects in each subpopulation were estimated at 37.2% PMs and 46.9% EMs.
A covariate analysis was undertaken and each covariate was added to the model; allometrically scaled weight was found to be the only covariate to have an influence on the model. The inclusion of allometric scaling as a factor on body weight into the model, significantly improved the OFV (p<0.001) over no allometric scaling. 9-OH risperidone clearance was estimated to be 9.0 L/h/70 kg. Parameter estimates and BSV for CL/F in the PM, IM, and EM populations are presented in Table 4. Residual error was estimated for risperidone and (±) 9-OH risperidone, using a combined additive and constant coefficient of variation error model, and results are in Table 2. The mixture model with two subpopulations performed well; however, the OFV was 533.3 (AIC 614.3) compared to the 472.5 OFV (AIC 506.5) in the mixture model with three subpopulations. Therefore, the mixture model with the three subpopulations was chosen as the final model. Population parameter estimates determined following the bootstrap (n=1000) are presented in Table 2.
Table 2.
Final pharmacokinetic parameter estimates for one compartment mixture model
| Parameters | Parameter estimates | SE% | CV% | Bootstrap (n = 1000) Mean | 95% CI |
|---|---|---|---|---|---|
|
| |||||
| Ka (h−1) | 2.5b | - | - | - | - |
| Vd/F & VdM/F (L)a | 77.3 | 12.6 | - | 74.1 | 55.3–101 |
| CLM/F (L/h/70kg) | 9.0 | 41.3 | - | 9.02 | 9–9.2 |
| CL/F in PM (L/h) | 9.38 | 9.2 | - | 8.9 | 7.3–10.3 |
| CL/F in EM (L/h) | 37.4 | 5.02 | - | 34.5 | 20.4–42.7 |
| CL/F in IM (L/h) | 29.2 | 10.1 | 30.0 | 0.46–68.9 | |
| KF-PM | 0.16 | 17.7 | - | 0.19 | 0.01–0.5 |
| KF-EM | 0.13 | 36.1 | - | 0.4 | 0.03–0.5 |
| KF-IM | 1b | - | - | - | |
| P1 (PM) | 37.2 | 11.7 | - | 37.7 | 0.4–149 |
| P2 (EM) | 46.9 | 15.9 | - | 52.4 | 0.5–90 |
| BSV (ω)-Vd | 0.2 | 7.9 | 44.5 | 0.19 | 0.03–2.1 |
| BSV (ω)-CL PM | 0.07 | 9.6 | 26.5 | 0.07 | −0.05–0.19 |
| BSV (ω)-CL EM | 0.06 | 21.1 | 25.5 | 0.65 | 0.5–0.7 |
| BSV (ω)-CL IM | 0.03 | 9.1 | 18.7 | 0.03 | 0.001–0.13 |
| BSV (ω)-CLM | 0.5 | 25.6 | 70.7 | 0.5 | 0.07–6.6 |
| RUV (σ)-CV RISP (%) | 0.08 | 36.1 | 29.4 | 0.21 | 0.01–0.46 |
| RUV (σ)-CV 9-OH (%) | 0.47 | 56.3 | 68.6 | 0.07 | −0.18–0.3 |
| RUV (σ)-SD RISP (ng/mL) | 0.5 | 84.6 | 0.71 | 0.08 | −0.1–0.26 |
| RUV (σ)-SD 9-OH (ng/mL) | 0.44 | 61.3 | 0.67 | 0.5 | 0.4–0.54 |
Vd/F = VdM/F.
Fixed.
SE = standard error; CV = coefficient of variation; h = hours; L = litres; kg = kilograms; CL/F = clearance; Vd/F = volume of distribution; Ka = absorption rate constant; VdM/F = volume of distribution of 9-hydroxyrisperidone; KF = fraction of risperidone to 9-hydroxyrisperidone; BSV = between subject variability; ω = coefficient of variation of interindividual variability; σ = coefficient of variation of residual variability; PM = poor metabolizers; EM = extensive metabolizers; IM = intermediate metabolizers; P1 = percent of subjects who were poor metabolizers; P2 = percent of subjects who were extensive metabolizers; RUV = residual unexplained variability; RISP = risperidone; 9-OH = 9-hydroxyrisperidone; ng = nanograms; mL = millilitres.
Diagnostic plots were generated for risperidone and (±) 9-OH risperidone individually and included dependent (observed) variable (DV) vs. population predicted (PRED) or individual predicted (IPRED) values (Figures 1A and 2A). Plots of residuals and conditional weighted residuals (CWRES) vs. time after dose (h) or PRED were also examined (Figures 1B–C and 2B). Figure 1A, risperidone DV vs. PRED showed some discrepancy between the predicted and observed concentrations. However, overall, there was indication of improved fit in comparison to the base model. The plot of risperidone DV vs. IPRED showed good fit of the data along the lower portion of the line of identity. (±) 9-OH risperidone DV vs. PRED (figure 2A) and DV vs. IPRED showed a similar trend as seen in the plots for risperidone.
Fig 1.


Fig. 1A Final model observed versus population predicted risperidone concentrations (Line of identity shown for clarity)
Fig 1B Final model risperidone conditional weighted residuals (CWRES) versus population predicted risperidone concentrations (Regression line shown as dashed line)
Fig 1C Final model risperidone conditional weighted residuals (CWRES) versus time after dose (h) (Regression line shown as dashed line)
Fig 2.


Fig. 2A Final model observed versus population predicted 9-OH risperidone concentrations (Line of identity shown for clarity)
Fig 2B Final model 9-OH risperidone conditional weighted residuals (CWRES) versus population predicted risperidone concentrations (Regression line shown as dashed line)
The mean estimates obtained from the 1000 bootstrap runs were similar to the population estimates determined from the final covariate model. Based on the bootstrap runs, there was a 98.2% success rate, defined by PDx-Pop® running the model successfully. In relation to the estimates for fixed and random effects, the final covariate mixture model displayed reasonable stability and accuracy. The final model was evaluated using visual predictive checks (VPCs), Figures 3 and 4. Figure 3 shows simulations from the VPC using the risperidone observed data, this compared the 5th and 95th quantiles, along with the 10th and 90th quantiles, with the dotted line representing the 50th percentile obtained from the simulations, with 3633 simulated observations. The VPC plot displays the 90% confidence intervals of simulated concentrations and it is plotted together with observed concentrations. If a majority of the observed values judged by visual inspection, lies within the intervals, the final model is said to be predictive. In Figure 3, there were no observations outside the 90% CI.
Fig 3.
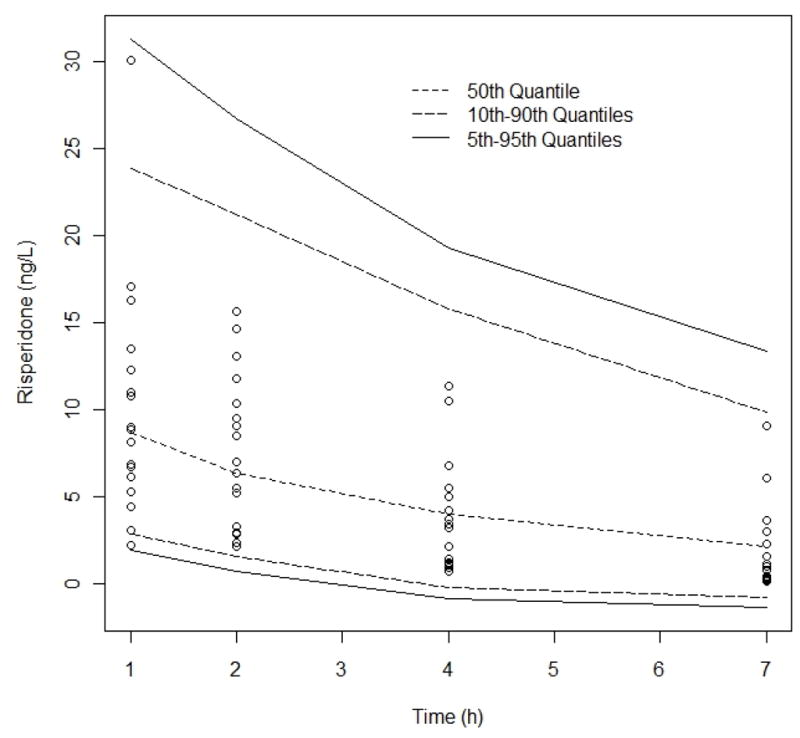
Visual Predictive Check, risperidone observed data compared to the 95th, 50th, and 5th percentiles for 100 simulated data sets. No of simulated observations = 3633, % observations outside 90% CI = 0%. Observed data binned according to “ideal” sampling times after dose 1, 2, 4 and 7 h. Comparison of median (dashed line) and 5–95th percentile interval (solid black lines)
Fig 4.
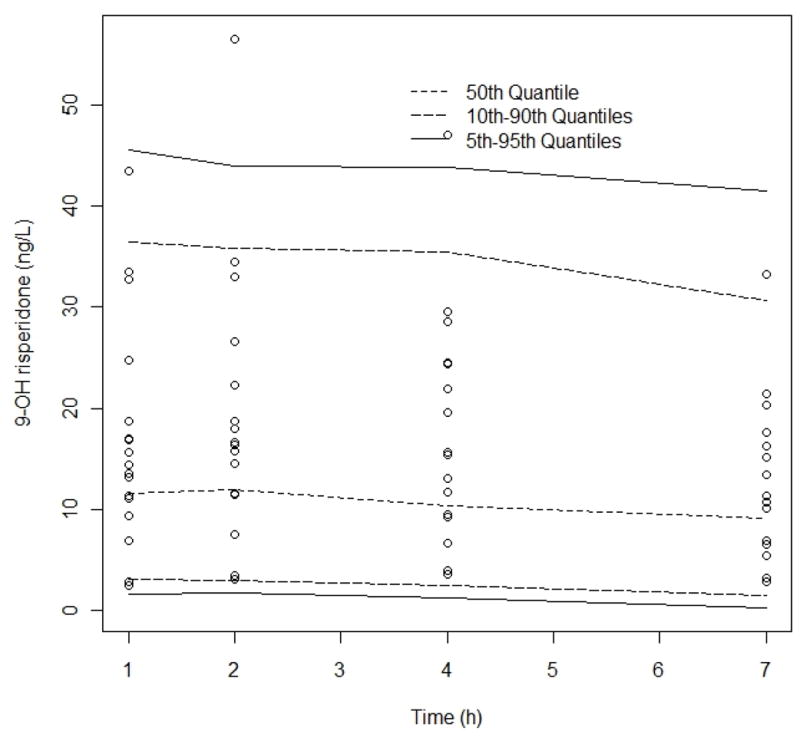
Visual Predictive Check, 9-OH risperidone observed data compared to the 95th, 50th, and 5th percentiles for 100 simulated data sets. No of simulated observations = 3794, % observations outside 90% CI = 3%. Observed data binned according to “ideal” sampling times after dose 1, 2, 4 and 7 h. Comparison of median (dashed line) and 5–95th percentile interval (solid black lines)
Figure 4 depicts the 9-OH risperidone observed data compared to the 95th, 50th, and 5th percentiles and 3794 simulated observations with 3% of the observations outside 90%. Overall, there was reasonable agreement between the observed data and the simulated data in the VPCs for the model.
DISCUSSION
The literature and discussion demonstrate that establishing the influence of clinical factors on risperidone and (±) 9-OH risperidone PK variability is essential for developing tailored pediatric risperidone dosing strategies. Consequently, this study aimed to characterize risperidone pharmacokinetic variability and determine the influence of age, sex, weight, and CYP2D6 phenotype on pharmacokinetic parameters in a pediatric population.
Studies have characterized and modeled risperidone and (±) 9-OH risperidone in adults24,42. Vermeulen et al. developed a PK model in risperidone-treated adults with bipolar disorder with two-compartment submodels for drug and metabolite disposition and a sequential zero- and first-order absorption pathway which used samples from intensively sampled individuals. In sparsely sampled individuals a much more simplified model was proposed. A mixture model was incorporated due to genetically variable CYP2D6 conversion of risperidone to (±) 9-OH risperidone. The final model described the plasma concentration-time profiles for risperidone and (±) 9-OH risperidone and predicted each subject’s CYP2D6 phenotype (PM, EM, or IM). The subpopulations of clearance (CL/F) were described as being analogous to unmeasured CYP2D6 metabolizer genotype42. Feng et al. developed a one-compartment mixture model with first-order absorption which adequately described risperidone and (±) 9-OH risperidone concentrations24. This study did not have CYP2D6 genotype data but analyzed CYP2D6 phenotypes and used a mixture model to estimate phenotypic clearance with the assumption that this corresponded to the PM, IM and EMs. Pharmacokinetic parameter estimates were determined in adult and elderly subjects and employed a mixture model, which allowed estimation of risperidone CL/F separately for three CYP2D6 phenotypes (poor, intermediate, and extensive metabolizers). Age was identified as a significant covariate on (±) 9-OH-risperidone CL/F24.
Risperidone PK parameter estimates for base model were consistent with a recently published report in children and adolescents43. Thyssen et al. characterized the population PK of risperidone in 304 pediatric subjects using sparse sampling. Subjects in the pediatric study were phenotyped for CYP2D6, using the ratio of risperidone to (±) 9-OH risperidone; a ratio of >1 classified a subject as a CYP2D6 PM. As CYP2D6 and CYP3A4 biotransform risperidone to (+) and (−) 9-OH risperidone, respectively, the total concentration of 9-OH metabolites is dependent on function of both enzymes. Hence, this method for CYP2D6 phenotyping affords a meaningful likelihood of misclassification of CYP2D6 phenotype. Variability in CYP3A4 and resulting (−) 9-OH risperidone concentrations could yield a higher or lower ratio than expected, yet the ratio was attributed to CYP2D6 phenotype only. The investigators then used a mixture model with two subpopulations, CYP2D6 EMs and CYP2D6 PMs, which is under-representative of the diversity in CYP2D6 activity, from poor to intermediate to extensive to ultra-rapid. The PK profile of active antipsychotic fraction (risperidone plus (±) 9-OH risperidone) was similar in PMs and EMs. However, Thyssen did not report population PK of (±)9-OH risperidone or covariates on the active metabolite clearances43.
In a similar fashion to Feng et al.24, but with pediatric patients, a combination of sparse and more intense D-optimal sampling strategies, and CYP2D6 genotypes in 62% of subjects, we developed a nonlinear mixed-effects model to describe both risperidone and (±) 9-OH risperidone concentration-time profiles. We categorized CYP2D6 genotypes into three phenotypes (poor, intermediate, and extensive; no subject had gene duplication yielding an ultra-rapid phenotype) and employed a mixture model to incorporate CYP2D6 phenotype and risperidone clearance for each group (poor, intermediate, and extensive metabolizers). The mixture model approach involved modeling of a probability distribution with a mixture of probability distributions, which includes the hypothesis that one or more subpopulations can exist rather than assuming the population as one group. This modeling approach combines the estimation of the model parameters such as clearance and the identification of the subpopulations in the population using a mixture for the distribution of the random effects44. The relative clearances for CYP2D6 EMs, IMs, and PMs, signifying metabolism of the parent drug, risperidone, to its metabolites were 37.4 L/h, 29.2 L/h, and 9.4 L/h. Population parameter estimates from the bootstrap were: risperidone CL/F (L/h) in PMs was 8.9 (7.3–10.3, 95% CI), EMs was 34.5 (20.4–42.7, 95% CI), and IMs was 30 (0.46–68.9, 95% CI), Decreasing clearances with decreasing CYP2D6 activity (based on predicted phenotype) were also reported in the Feng study of adult and geriatric subjects (ages 18–93 years) taking risperidone for schizophrenia or Alzheimer’s Disease24.
Inter-individual variability in risperidone (and active metabolite) exposure and response is multi-factorial. As expected, and consistent with Feng24 and other studies in older populations15,40, age was not identified as a significant covariate on risperidone clearance. The final model for risperidone and (±) 9-OH risperidone identified weight as a significant covariate for (±) 9-OH risperidone clearance.
A mixture model described risperidone and (±) 9-OH risperidone clearances separately for CYP2D6 extensive, intermediate, and poor metabolizers; body weight was the only tested covariate that improved the model and influenced the clearance of (±) 9-OH risperidone. One limitation to this study is the inconsistent documentation of concomitant medications in the previous medical research records, confounding our ability to include concomitant medications as a covariate in our models.
At present, there is no defined target risperidone or active moiety exposure for treatment of the psychiatric disorders or target symptoms for which risperidone has demonstrated efficacy. Given the small sample size and homogenous diagnoses, the results from this study do not answer the question of appropriate dosing or target exposure. However, a population PK model has not been previously published solely in the pediatric population, nor in a cohort of patients with neurodevelopmental disorders treated with risperidone in the course of clinician-guided care. This is an important step toward understanding risperidone and active moiety exposure and potential factors contributing to PK variability. In addition, the population PK of both risperidone and (±) 9-OH risperidone, are considered separately (each of which constitutes a marketed drug), in contrast to the few studies including pediatrics which combine these entities to evaluate “active antipsychotic moiety.” This may be important in the occurrence of side effects. A population PK model constructed with CYP2D6 genotype- predicted phenotypes, that estimates CYP2D6 subpopulations in children and adolescents maybe helpful to guide dosing.
In the context of inter-individual variability, subsequent investigations may focus on identifying potential target exposures (a priori) and ability to predict a dose to achieve a given concentration with a single sample, using covariates alone. Dose refinement based on this approach may be achieved more quickly, with more optimal safety and efficacy than achieved from current dosing strategies.
CONCLUSION
Weight was allometrically scaled and identified as a significant covariate on (±) 9-OH risperidone clearance, risperidone clearance, and risperidone volume of distribution. Active moiety [risperidone plus (−) and (+) 9-OH risperidone] pharmacokinetic variability and the effect of covariates were better explained with addition of metabolite pharmacokinetic parameters. Contribution of CYP2D6 genotypes to differences in active moiety pharmacokinetics, clinical response, and adverse reactions warrants additional study. This model may aid in the development of individualized paediatric risperidone dosing regimens to optimize safety and efficacy.
Acknowledgments
Source of Funding: This study was supported by NIH grants 1R21HD042440 (AAV), 3U10HD037249 (AAV, SNS), 5T32AR007594-15 (CMTS); the Cincinnati Children’s Hospital Medical Center Translational Research Initiative, and the Clinical Research Feasibility Funds Program.
The authors thank Jeffrey Blumer, PhD, MD, Co-Investigator on previous studies from which some of the data were collected. We thank Joshua Courter, PharmD, for reviewing this manuscript and providing constructive comments. We are grateful to Sandi Bechtol, RN, for coordinating the prospective study, Marianne Kuijvenhoven for data compilation, and Shareen Cox for her work with risperidone and 9-hydroxyrisperidone enantiomer concentration determinations.
References
- 1.Kowatch RA, Fristad M, Birmaher B, et al. Treatment guidelines for children and adolescents with bipolar disorder. J Am Acad Child Adolesc Psychiatry. 2005 Mar;44(3):213–235. doi: 10.1097/00004583-200503000-00006. [DOI] [PubMed] [Google Scholar]
- 2.Myers SM, Johnson CP. Management of children with autism spectrum disorders. Pediatrics. 2007 Nov;120(5):1162–1182. doi: 10.1542/peds.2007-2362. [DOI] [PubMed] [Google Scholar]
- 3.Pappadopulos E, Macintyre JC, II, Crismon ML, et al. Treatment recommendations for the use of antipsychotics for aggressive youth (TRAAY). Part II. J Am Acad Child Adolesc Psychiatry. 2003 Feb;42(2):145–161. doi: 10.1097/00004583-200302000-00008. [DOI] [PubMed] [Google Scholar]
- 4.Young CM, Findling RL. Pharmacologic treatment of adolescent and child schizophrenia. Expert Rev Neurother. 2004 Jan;4(1):53–60. doi: 10.1586/14737175.4.1.53. [DOI] [PubMed] [Google Scholar]
- 5.Masi G, Liboni F. Management of schizophrenia in children and adolescents: focus on pharmacotherapy. Drugs. 2011 Jan 22;71(2):179–208. doi: 10.2165/11585350-000000000-00000. [DOI] [PubMed] [Google Scholar]
- 6.McKinney C, Renk K. Atypical antipsychotic medications in the management of disruptive behaviors in children: safety guidelines and recommendations. Clinical psychology review. 2011 Apr;31(3):465–471. doi: 10.1016/j.cpr.2010.11.005. [DOI] [PubMed] [Google Scholar]
- 7.McConville BJ, Sorter MT. Treatment challenges and safety considerations for antipsychotic use in children and adolescents with psychoses. J Clin Psychiatry. 2004;65 (Suppl 6):20–29. [PubMed] [Google Scholar]
- 8.Spina E, Avenoso A, Facciola G, et al. Relationship between plasma risperidone and 9-hydroxyrisperidone concentrations and clinical response in patients with schizophrenia. Psychopharmacology (Berl) 2001 Jan 1;153(2):238–243. doi: 10.1007/s002130000576. [DOI] [PubMed] [Google Scholar]
- 9.He H, Richardson JS. A pharmacological, pharmacokinetic and clinical overview of risperidone, a new antipsychotic that blocks serotonin 5-HT2 and dopamine D2 receptors. Int Clin Psychopharmacol. 1995 Mar;10(1):19–30. doi: 10.1097/00004850-199503000-00003. [DOI] [PubMed] [Google Scholar]
- 10.Calarge CA, Miller del D. Predictors of risperidone and 9-hydroxyrisperidone serum concentration in children and adolescents. Journal of child and adolescent psychopharmacology. 2011 Apr;21(2):163–169. doi: 10.1089/cap.2010.0038. [DOI] [PMC free article] [PubMed] [Google Scholar]
- 11.Locatelli I, Kastelic M, Koprivsek J, et al. A population pharmacokinetic evaluation of the influence of CYP2D6 genotype on risperidone metabolism in patients with acute episode of schizophrenia. European journal of pharmaceutical sciences : official journal of the European Federation for Pharmaceutical Sciences. 2010 Oct 9;41(2):289–298. doi: 10.1016/j.ejps.2010.06.016. [DOI] [PubMed] [Google Scholar]
- 12.Novalbos J, Lopez-Rodriguez R, Roman M, et al. Effects of CYP2D6 genotype on the pharmacokinetics, pharmacodynamics, and safety of risperidone in healthy volunteers. Journal of clinical psychopharmacology. 2010 Oct;30(5):504–511. doi: 10.1097/JCP.0b013e3181ee84c7. [DOI] [PubMed] [Google Scholar]
- 13.Seto K, Dumontet J, Ensom MH. Risperidone in schizophrenia: is there a role for therapeutic drug monitoring? Therapeutic drug monitoring. 2011 Jun;33(3):275–283. doi: 10.1097/FTD.0b013e3182126d83. [DOI] [PubMed] [Google Scholar]
- 14.Xiang Q, Zhao X, Zhou Y, et al. Effect of CYP2D6, CYP3A5, and MDR1 genetic polymorphisms on the pharmacokinetics of risperidone and its active moiety. Journal of clinical pharmacology. 2010 Jun;50(6):659–666. doi: 10.1177/0091270009347867. [DOI] [PubMed] [Google Scholar]
- 15.Megens AAHP, Awouters FHL. In vivo pharmacological profile of 9-hydroxyrisperidone, the major metabolite of the novel antipsychotic risperidone. Drug Develop Res. 1994;33:399–412. [Google Scholar]
- 16.Snoeck E, Van Peer A, Sack M, et al. Influence of age, renal and liver impairment on the pharmacokinetics of risperidone in man. Psychopharmacology. 1995 Dec;122(3):223–229. doi: 10.1007/BF02246543. [DOI] [PubMed] [Google Scholar]
- 17.Bradford LD. CYP2D6 allele frequency in European Caucasians, Asians, Africans and their descendants. Pharmacogenomics. 2002 Mar;3(2):229–243. doi: 10.1517/14622416.3.2.229. [DOI] [PubMed] [Google Scholar]
- 18.Aravagiri M, Marder SR, Nuechterlein KH, et al. Intra- and interindividual variations in steady-state plasma concentrations of risperidone and 9-hydroxyrisperidone in schizophrenic patients treated chronically with various doses of risperidone. Therapeutic drug monitoring. 2003 Dec;25(6):657–664. doi: 10.1097/00007691-200312000-00003. [DOI] [PubMed] [Google Scholar]
- 19.Aravagiri M, Marder SR, Wirshing D, et al. Plasma concentrations of risperidone and its 9-hydroxy metabolite and their relationship to dose in schizophrenic patients: simultaneous determination by a high performance liquid chromatography with electrochemical detection. Pharmacopsychiatry. 1998 May;31(3):102–109. doi: 10.1055/s-2007-979308. [DOI] [PubMed] [Google Scholar]
- 20.Aichhorn W, Weiss U, Marksteiner J, et al. Influence of age and gender on risperidone plasma concentrations. J Psychopharmacol. 2005 Jul;19(4):395–401. doi: 10.1177/0269881105053306. [DOI] [PubMed] [Google Scholar]
- 21.Yagihashi T, Mizuno M, Chino B, et al. Effects of the CYP2D6*10 alleles and comedication with CYP2D6-dependent drugs on risperidone metabolism in patients with schizophrenia. Hum Psychopharmacol. 2009 Jun;24(4):301–308. doi: 10.1002/hup.1025. [DOI] [PubMed] [Google Scholar]
- 22.Leysen JE, Gommeren W, Eens A, et al. Biochemical profile of risperidone, a new antipsychotic. The Journal of pharmacology and experimental therapeutics. 1988 Nov;247(2):661–670. [PubMed] [Google Scholar]
- 23.Schotte A, Janssen PF, Gommeren W, et al. Risperidone compared with new and reference antipsychotic drugs: in vitro and in vivo receptor binding. Psychopharmacology (Berl) 1996 Mar;124(1–2):57–73. doi: 10.1007/BF02245606. [DOI] [PubMed] [Google Scholar]
- 24.Feng Y, Pollock BG, Coley K, et al. Population pharmacokinetic analysis for risperidone using highly sparse sampling measurements from the CATIE study. British journal of clinical pharmacology. 2008 Nov;66(5):629–639. doi: 10.1111/j.1365-2125.2008.03276.x. [DOI] [PMC free article] [PubMed] [Google Scholar]
- 25.Aichhorn W, Marksteiner J, Walch T, et al. Age and gender effects on olanzapine and risperidone plasma concentrations in children and adolescents. J Child Adolesc Psychopharmacol. 2007 Oct;17(5):665–674. doi: 10.1089/cap.2006.0045. [DOI] [PubMed] [Google Scholar]
- 26.Leon J, Susce MT, Pan RM, et al. A study of genetic (CYP2D6 and ABCB1) and environmental (drug inhibitors and inducers) variables that may influence plasma risperidone levels. Pharmacopsychiatry. 2007 May;40(3):93–102. doi: 10.1055/s-2007-973836. [DOI] [PubMed] [Google Scholar]
- 27.Aman MG, Vinks AA, Remmerie B, et al. Plasma pharmacokinetic characteristics of risperidone and their relationship to saliva concentrations in children with psychiatric or neurodevelopmental disorders. Clin Ther. 2007 Jul;29(7):1476–1486. doi: 10.1016/j.clinthera.2007.07.026. [DOI] [PMC free article] [PubMed] [Google Scholar]
- 28.Vinks AA, Mannaert E, Pappas K, et al. Pharmacokinetics of risperidone and its 9-hydroxy-enantiomer metabolites in pediatric psychiatric patients. Clin Pharmacol Ther. 2006;79:73. [Google Scholar]
- 29.D’Argenio DZ. Optimal sampling times for pharmacokinetic experiments. Journal of pharmacokinetics and biopharmaceutics. 1981 Dec;9(6):739–756. doi: 10.1007/BF01070904. [DOI] [PubMed] [Google Scholar]
- 30.D’Argenio DZSA. User’s Guide to Release 4. Los Angeles, CA: Biomedical Simulations Resource University of Southern California; 1997. ADAPT II. Pharmacokinetic/Pharmacodynamic Systems Analysis Software. [Google Scholar]
- 31.Flarakos J, Luo W, Aman M, et al. Quantification of risperidone and 9-hydroxyrisperidone in plasma and saliva from adult and pediatric patients by liquid chromatography-mass spectrometry. Journal of chromatography A. 2004 Feb 13;1026(1–2):175–183. doi: 10.1016/j.chroma.2003.10.138. [DOI] [PubMed] [Google Scholar]
- 32.Cabovska B, Cox SL, Vinks AA. Determination of risperidone and enantiomers of 9-hydroxyrisperidone in plasma by LC-MS/MS. Journal of chromatography B, Analytical technologies in the biomedical and life sciences. 2007 Jun 1;852(1–2):497–504. doi: 10.1016/j.jchromb.2007.02.007. [DOI] [PMC free article] [PubMed] [Google Scholar]
- 33.Johansson I, Lundqvist E, Dahl ML, et al. PCR-based genotyping for duplicated and deleted CYP2D6 genes. Pharmacogenetics. 1996 Aug;6(4):351–355. doi: 10.1097/00008571-199608000-00008. [DOI] [PubMed] [Google Scholar]
- 34.Lundqvist E, Johansson I, Ingelman-Sundberg M. Genetic mechanisms for duplication and multiduplication of the human CYP2D6 gene and methods for detection of duplicated CYP2D6 genes. Gene. 1999 Jan 21;226(2):327–338. doi: 10.1016/s0378-1119(98)00567-8. [DOI] [PubMed] [Google Scholar]
- 35.Ludden TM, Beal SL, Sheiner LB. Comparison of the Akaike Information Criterion, the Schwarz criterion and the F test as guides to model selection. Journal of Pharmacokinetics & Biopharmaceutics. 1994 Oct;22(5):431–445. doi: 10.1007/BF02353864. [DOI] [PubMed] [Google Scholar]
- 36.Karlsson MO, Sheiner LB. The importance of modeling interoccasion variability in population pharmacokinetic analyses. Journal of Pharmacokinetics & Biopharmaceutics. 1993 Dec;21(6):735–750. doi: 10.1007/BF01113502. [DOI] [PubMed] [Google Scholar]
- 37.Pohjalainen T, Rinne JO, Nagren K, et al. The A1 allele of the human D2 dopamine receptor gene predicts low D2 receptor availability in healthy volunteers. Mol Psychiatry. 1998 May;3(3):256–260. doi: 10.1038/sj.mp.4000350. [DOI] [PubMed] [Google Scholar]
- 38.Anderson BJ, Holford NH. Mechanism-based concepts of size and maturity in pharmacokinetics. Annu Rev Pharmacol Toxicol. 2008;48:303–332. doi: 10.1146/annurev.pharmtox.48.113006.094708. [DOI] [PubMed] [Google Scholar]
- 39.Anderson BJ, Allegaert K, Holford NH. Population clinical pharmacology of children: general principles. Eur J Pediatr. 2006 Nov;165(11):741–746. doi: 10.1007/s00431-006-0188-y. [DOI] [PubMed] [Google Scholar]
- 40.Ette EI. Stability and performance of a population pharmacokinetic model. Journal of clinical pharmacology. 1997 Jun;37(6):486–495. doi: 10.1002/j.1552-4604.1997.tb04326.x. [DOI] [PubMed] [Google Scholar]
- 41.Ette EI, Sun H, Ludden TM. Ignorability and parameter estimation in longitudinal pharmacokinetic studies. Journal of clinical pharmacology. 1998 Mar;38(3):221–226. doi: 10.1002/j.1552-4604.1998.tb04419.x. [DOI] [PubMed] [Google Scholar]
- 42.Vermeulen A, Piotrovsky V, Ludwig EA. Population pharmacokinetics of risperidone and 9-hydroxyrisperidone in patients with acute episodes associated with bipolar I disorder. J Pharmacokinet Pharmacodyn. 2007 Apr;34(2):183–206. doi: 10.1007/s10928-006-9040-2. [DOI] [PubMed] [Google Scholar]
- 43.Thyssen A, Vermeulen A, Fuseau E, et al. Population pharmacokinetics of oral risperidone in children, adolescents and adults with psychiatric disorders. Clin Pharmacokinet. 2010 Jul 1;49(7):465–478. doi: 10.2165/11531730-000000000-00000. [DOI] [PubMed] [Google Scholar]
- 44.Lemenuel-Diot A, Laveille C, Frey N, et al. Mixture modeling for the detection of subpopulations in a pharmacokinetic/pharmacodynamic analysis. J Pharmacokinet Pharmacodyn. 2007 Apr;34(2):157–181. doi: 10.1007/s10928-006-9039-8. [DOI] [PubMed] [Google Scholar]