Abstract
In-stent restenosis occurs in coronary arteries after implantation of drug-eluting stents with non-uniform restenosis thickness distribution in the artery cross-section. Knowledge of the spatiotemporal drug uptake in the arterial wall is useful for investigating restenosis growth but may often be very expensive/difficult to acquire experimentally. In this work, local delivery of a hydrophobic drug from a drug-eluting stent implanted in a coronary artery is mathematically modeled to investigate the drug release and spatiotemporal drug distribution in the arterial wall. The model integrates drug diffusion in the coating and drug diffusion with reversible binding in the arterial wall. The model is solved by the finite volume method for both high and low drug loadings relative to its solubility in the stent coating with varied isotropic/anisotropic vascular drug diffusivities. Drug release profiles in the coating are observed to depend not only on the coating drug diffusivity but also on the properties of the surrounding arterial wall. Time dependencies of the spatially-averaged free- and bound-drug levels in the arterial wall on the coating and vascular drug diffusivities are discussed. Anisotropic vascular drug diffusivities result in slightly different average drug levels in the arterial wall but very different spatial distributions. Higher circumferential vascular diffusivity results in more uniform drug loading in the upper layers and is potentially beneficial in reducing in-stent restenosis. An analytical expression is derived which can be used to determine regions in the arterial with higher free-drug concentration than bound-drug concentration.
Keywords: drug-eluting stents, mathematical modeling, restenosis, anisotropic diffusivity, arterial drug distribution
1. Introduction
Drug-eluting stents have shown great benefits in reducing in-stent restenosis after angioplasty procedures compared with bare metal stents (Daemen and Serruys 2007, Fattori and Piva 2003, Santin et al. 2005, Sousa et al. 2003). The device enables a prolonged local delivery of drugs, such as sirolimus or paclitaxel, which are embedded in and released from the polymeric stent-coating and can interrupt certain stages in in-stent restenosis formation (Costa and Simon 2005, Deconinck et al. 2008, Wessely et al. 2006). Significant work has been carried out on stent design (Bailey 2009), in vitro drug release from polymeric stent-coating with various configurations including drug type and loading, coating polymer type and molecular weight, and coating thickness (Acharya and Park 2006, Kamath et al. 2006, Ranade et al. 2004, Sharkawi et al. 2005, Venkatraman and Boey 2007), physiochemical drug properties (Creel et al. 2000, Levin et al. 2004, Wessely, et al. 2006, Zhang et al. 2002), in vivo examination of drug delivery and arterial drug uptake (Creel, et al. 2000, Hwang and Edelman 2002, Hwang et al. 2005, Lovich et al. 2001, Lovich and Edelman 1995, Lovich et al. 1998, Tzafriri et al. 2010), and in-stent restenosis formation (Carlier et al. 2003, Finkelstein et al. 2003, Murata et al. 2002, Takebayashi et al. 2004, Wentzel et al. 2001). Nevertheless, the various factors lead to complexities in stent design and evaluation and impede the development of drug-eluting stents.
Modeling and simulation methods promote the understanding of drug-eluting stent function and can facilitate the improvement of device efficacy. Drug release from coating and drug-vascular tissue interactions were studied in one-dimensional models (Hossainy and Prabhu 2008, Lovick and Edelman 1996, Sakharov et al. 2002). Analytical solution for drug diffusion in one-dimensional multi-layer wall structure was also derived (Pontrelli and de Monte 2010). Convective and diffusive transports of drug in the arterial wall have been assessed for both hydrophilic and hydrophobic drugs (Hwang et al. 2001). The effects of thrombus (Balakrishnan et al. 2008), blood flow (Borghi et al. 2008, Kolachalama et al. 2010), stent coating (Balakrishnan et al. 2007), and strut position (Balakrishnan et al. 2005) on stent-based drug delivery have been investigated for a single strut in the axial profile of the artery using a coupled computational fluid dynamics and mass transfer model. In a cross-section model, drug elution from a fully embedded stent strut was found to be most effective with a bi-layer gel paved stent (Grassi et al. 2009). Models with multiple struts have also been developed to study the impact of different strut configurations (half, fully, and not-embedded) and diffusivities on arterial drug uptake (Mongrain et al. 2007, Vairo et al. 2010). Mechanics and fluid dynamics simulation has also been done to study stent expansion and interaction with coronary artery (Zunino et al. 2009).
Additional questions arises as in in-stent restenosis has been experimentally observed to be more likely to occur in stented coronary arteries with non-uniformly distributed struts, and the maximum thickness occurred at the site with maximum inter-strut angle in the artery cross-section (Takebayashi, et al. 2004). Knowledge of the spatiotemporal drug uptake in the arterial wall can provide some insights into this observation. This paper mathematically models the integrated process of (1) the delivery of a hydrophobic drug from a drug-eluting stent with bio-durable polymeric coating and (2) drug distribution in the arterial wall with reversible binding. The drug delivery and distribution are studied in a detailed manner for implications on improving device efficacy and reducing in-stent restenosis for drug-eluting stents. Development of such a model can potentially be used for the optimal stent design in silico in the future to avoid sub-optimal stent designs and undesirable outcomes in patient treatments.
2. Methods
2.1. Description of the Implanted Stent
The drug-eluting stents studied in this paper have a bio-durable polymeric coating and delivers a hydrophobic drug, which is the case for FDA-approved stents such as Cypher™ stents (Cordis, Johnson & Johnson) and Taxus™ stents (Boston Scientific). The cross-section of the coronary artery with an implanted eight-strut stent is illustrated in Figure 1a. The cross-section for each strut is assumed to be square with strut dimension a having a typical value from Cypher stents (Bailey 2009). The struts are assumed to be distributed evenly in the lumen with same degree of strut embedment, Lp, in the arterial wall, which is within the range of no-embedment to total embedment in previous studies (Grassi, et al. 2009, Mongrain, et al. 2007, Vairo, et al. 2010).
Figure 1.
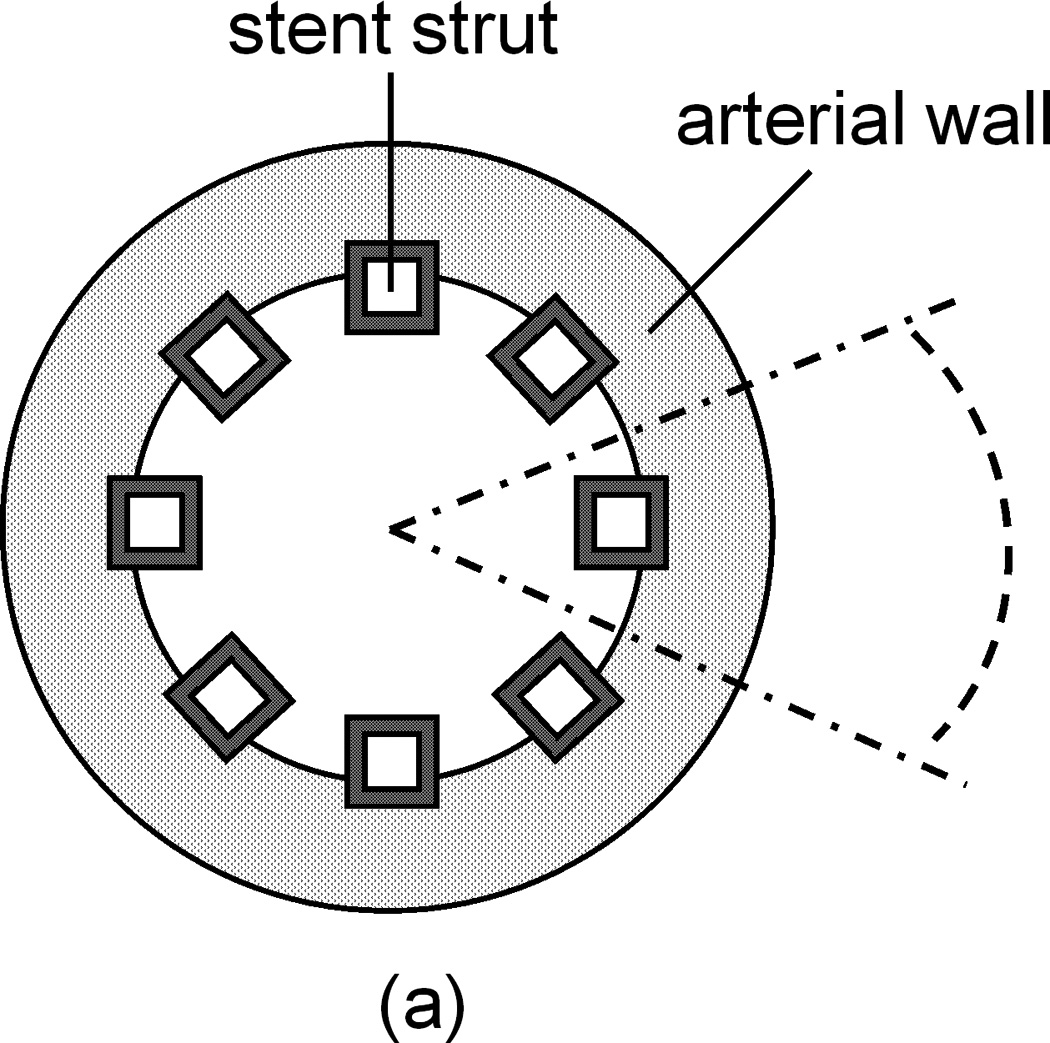
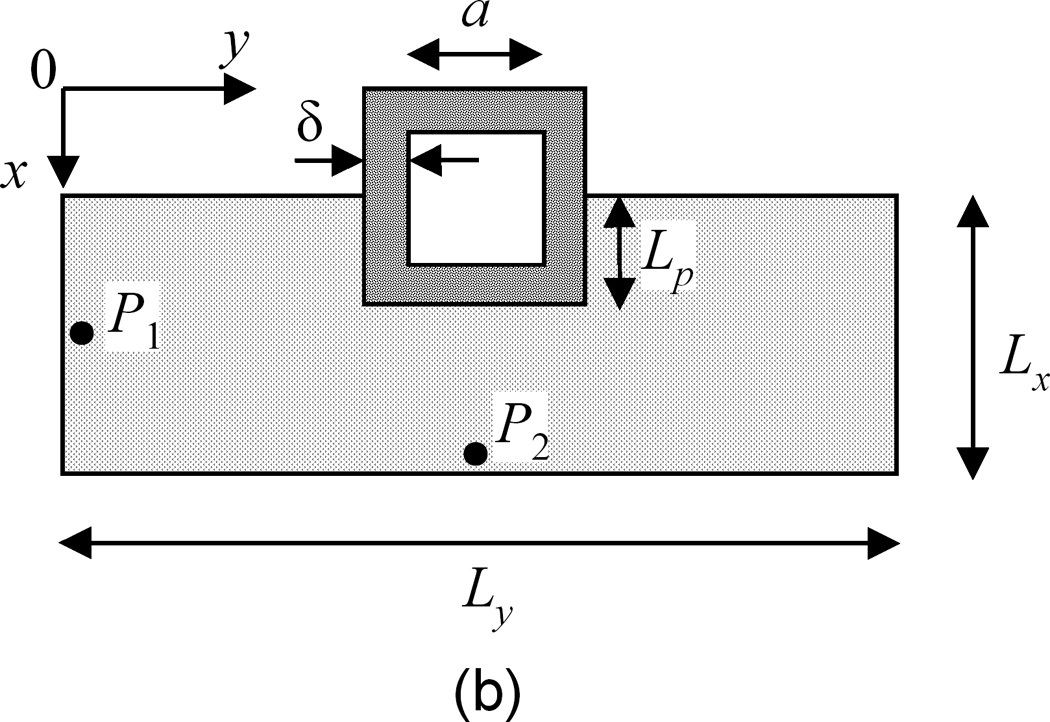
(a) Cross-sectional view of an implanted stent in a coronary artery. Dashed lines show a reduced domain by symmetry. (b) Extracted single strut domain with partial embedment into the arterial wall.
A single strut section can be separated and studied using the symmetry, as indicated by dotted lines in Figure 1a. Based on the small thickness of the coronary artery wall (Lx ~ 200 µm) compared to the diameter of the lumen (2.5–3.5 mm), the single strut section can be modeled as a rectangular arterial wall domain, as in Figure 1b. The domain can be further reduced to half to increase the computation speed by symmetry. The inter-strut distance (distance between the centers of two adjacent struts), Ly, is estimated for an eight-strut stent in a 3-mm wide coronary artery. The transmural and circumferential directions are labeled as the x and y axes, respectively. Blood flow has a direction into the paper plane. Parameters defining the spatial dimensions are labeled in Figure 1b, with their values summarized in Table 1. The coating thickness δ has values in the literature within the range of 5–50 µm (Finkelstein, et al. 2003), and a value of 50 µm is used consistent with previous modeling work (Mongrain, et al. 2007, Vairo, et al. 2010). Strut embedment in the wall can range from no embedment to total embedment (Grassi, et al. 2009, Mongrain, et al. 2007, Vairo, et al. 2010), revealing slightly different uniformity in drug distribution and higher amount of drug in the arterial wall with increased degree of embedment. In this work the depth of strut embedment into the wall Lp is used with a value close to half-embedment.
Table 1.
Model Parameters and Values
| Dimensions | ||
| strut dimension | a | 140 µm (Bailey 2009) |
| strut coating thickness | δ | 50 µm (Mongrain, et al. 2007) |
| strut embedment | Lp | no embedment ~ total embedment |
| coronary artery wall thickness | Lx | 200 µm (Lovick and Edelman 1996) |
| inter-strut distance | Ly | 1000 µm* |
| Model parameters | ||
| initial drug concentration in the coating | C0 | 10−5 M (Sakharov, et al. 2002) |
| coating drug diffusivity | D1 | 0.01~1 µm2/s(Mongrain, et al. 2007) |
| isotropic vascular drug diffusivity | D2 | 0.1~10 µm2/s (Levin, et al. 2004) |
| transmural vascular drug diffusivity | D2x | 0.1~10 µm2/s |
| circumferential vascular drug diffusivity | D2y | 1~100 D2x (Hwang and Edelman 2002) |
| association rate constant (binding) | ka | 104 M−1s−1 (Zhang, et al. 2002) |
| dissociation rate constant (unbinding) | kd | 0.01 s−1 |
| resistance at perivascular boundary | Rwp | 5~100 s/µm (Hwang, et al. 2001) |
| initial binding site concentration | S0 | 10−5 M (Levin, et al. 2004) |
| partition coefficient at the perivascular boundary | κwp | 1 (Creel, et al. 2000) |
| partition coefficient at the coating-arterial wall interface | κcw | 1 (Balakrishnan, et al. 2007) |
estimated for an eight-strut stent in a 3-mm wide coronary artery
2.2. Mathematical Model
The drug delivery process is described by drug diffusion in the polymeric coating as Eq. 1 and coupled drug diffusion and reversible binding in the arterial wall as Eq. 2 & 3.
| (1) |
| (2) |
| (3) |
Drug transport by diffusion has been identified as the dominant mechanism in the arterial wall (Lovich and Edelman 1995) and convective drug transport in the wall is not considered, same as in most models (Balakrishnan, et al. 2008, Balakrishnan, et al. 2007). The coating drug diffusivity (D1) studied has a range of 0.01–1 µm2/s (Mongrain, et al. 2007, Sakharov, et al. 2002), and the isotropic vascular drug diffusivity has a higher range of 0.1–10 µm2/s(Creel, et al. 2000, Levin, et al. 2004). Anisotropic vascular drug diffusivity is investigated, where the transmural vascular diffusivity (D2x) has the same range as that of the isotropic vascular diffusivity, while the circumferential vascular diffusivity (D2y) can be the same as the transmural diffusivity for large drug molecules or one or two orders larger in magnitude for decreasing drug molecule sizes (Hwang and Edelman 2002). Drug binding in the wall is described as a first-order reversible reaction,  , characterized by an association (binding) rate constant ka reacting free drug (C) with binding site (S) into bound drug (B), and a dissociation (unbinding) rate constant kd (Borghi, et al. 2008, Lovick and Edelman 1996, Sakharov, et al. 2002). The amount of available binding sites S at each location within the wall can be tracked by the difference between the initial binding sites concentration S0 and the bound drug concentration B. Reported values for the association (dissociation) rate constants ka (kd) (Zhang, et al. 2002) and binding site concentrations (S0) (Levin, et al. 2004) are used as in Table 1
At each interface in Figure 1b (defined by the length dimensions), the boundary conditions are expressed in flux form. At the arterial wall-perivascular space interface, the flux is expressed as (Hwang, et al. 2001)
| (4) |
where Cp is the perivascular drug concentration, Cw is the drug concentration on the arterial wall side of the interface, κwp is the partition coefficient (defined as κwp = [Cw/Cp]equilibrium), and Rwp is the mass transfer resistance (Hwang, et al. 2001). The boundary conditions at the lumen-coating interface and the lumen-arterial wall interface can be written in a similar way as Eq. 4. While a washed-out boundary condition is usually adopted for a hydrophilic drug like heparin (Lovick and Edelman 1996, Sakharov, et al. 2002), for hydrophobic drugs such as sirolimus and paclitaxel a zero-flux boundary condition is justified and used as described below.
For hydrophobic drugs like sirolimus and paclitaxel, studies (Levin, et al. 2004, Tzafriri, et al. 2010) have shown strong partitioning of the drugs into the arterial wall at the lumen-arterial wall interface, even in the presence of binding proteins or in serum (Lovich, et al. 2001). These experimental observations and a high resistance imposed by the intima (Lovich, et al. 1998) can greatly damp the drug depletion into the blood and result in a negligible drug flux into the lumen. In addition, the drug uptake by the bloodstream was found to be a very limited part of the drug initially stored in the polymer coating (Borghi, et al. 2008), while simulations have indicated that the blood flow rate and drug diffusivity in the blood have negligible effects on the amount of accumulated drug in the arterial wall (Mongrain, et al. 2007). Furthermore, it is the drug transported into the arterial wall that can be effective in suppressing restenosis (Costa and Simon 2005). Based on these facts, a simplification of neglected drug flux at the lumen-vascular wall and the lumen-coating interfaces is justified.
At the perivascular boundary, drug concentration in the perivascular space (Cp) is assumed zero and the mass transfer resistance (Rwp) has a reported range of 5–100 s/µm (Hwang, et al. 2001, Sakharov, et al. 2002). Zero flux boundary condition applies to the other interfaces including the coating-strut interface and right/left wall boundaries (due to symmetry). The boundary conditions at the wall-coating interface are described by concentration partitioning and flux matching (Eq. 5–6).
| (5) |
| (6) |
Values of one are used for the partition coefficients at the coating-vascular wall interface (κcw) (Balakrishnan, et al. 2007) and perivascular boundary (κwp) (Creel, et al. 2000).
Initial conditions for simulation include uniformly dispersed drug in the polymer coating at concentration C0, absence of both free and bound drug in the arterial wall, and uniform binding sites throughout the arterial wall at concentration S0.
2.3. Numerical Simulation
The mathematical model was simulated using the finite volume method. To illustrate how the numerical scheme was developed, for a mesh cell of size Δx by Δy centered at (x, y), Eq. 2 can be expressed as
| (7) |
where Jx, Jy correspond to the fluxes in the x, y directions, respectively. Applying a forward-difference approximation for the time derivative with a time step Δt and mesh size h = Δx = Δy results in
| (8) |
where superscript n is the time index, subscripts i, j are the indices for x, y coordinates of the mesh cell, ±h/2 are the boundaries with neighboring mesh cells, and C̅ and B̅ are the average of the free- and bound-drug concentrations over the mesh cell centered at (i, j) at time index n. The flux across boundary of two adjacent mesh cells was calculated by a second-order centered difference, i.e., .
The numerical simulations were implemented in Matlab 2010b running on an Intel-based personal computer. The explicit numerical scheme used forward-time centered-space discretization (Durran 1999). Standard Von Neumann stability analysis of the numerical scheme and further consideration to avoid over-damping gave a criterion of . Similar procedures can be used to derive the stability condition for anisotropic diffusion as . This criterion is a sufficient condition for numerical stability as the binding reaction terms in Eq. 8 are overall negative. While satisfying the stability condition, each simulation was run at several decreasing time steps ranging from 2 s to 0.1 s with an optimized spatial discretization (14,000 mesh cells) until the release profiles in the coating were within the difference of 1%. The correctness of the Matlab implementation was also assessed by reducing the code to a 1D transmural diffusion problem at the high drug loading case, which was subsequently verified with analytical solution.
Values of the parameters used in the simulation are summarized in Table 1. Isotropic vascular drug diffusivity (D2) was first investigated, followed by an anisotropic vascular drug diffusivity study.
2.4. Dimensional Analysis
Some insights of the system characteristics can be obtained by performing dimensional analysis. The characteristic lengths of the coating domain and the arterial wall domain are the coating thickness δ and lengths Lx and Ly/2, respectively. Define, C̅ = C/C0, B̅ = B/S0, and non-dimensionalize Eqs. 1–3 to obtain Eqs. 9–11 in Table 2.
Table 2.
Non-dimensionalized Equations
| |||||
| |||||
| |||||
| Characteristic time scales and dimensionless groups | |||||
| τ1 = δ2/D1 | τ3 = 1/kd | ||||
Three characteristic time scales appear, τ1, τ2, τ3, corresponding to diffusion in the coating, transmural diffusion, and the binding reaction. An evaluation of the magnitude of the three groups gives τ1 ~ 103–105 s, τ2 ~ 103–105 s, and τ3 ~ 102 s, which indicate that reversible binding is very fast compared to diffusion.
The relative significance of diffusion and reversible binding in the wall is also implied by their corresponding dimensionless groups in Eq. 10. Compared with the coefficient of transmural diffusion component (which is one), the reaction components have very large coefficients (known as Damköhler numbers), G2 ~ 102–104 and G3 ~ 101–103, which also implies that the binding reactions play a very strong role in the spatiotemporal dynamics. The competition between association and dissociation reactions is quantified by G2/G3 = 10 in Eq. 11, which indicates a preference of association over dissociation.
The competition between transmural and circumferential diffusion in the arterial wall is implied by the dimensionless group G1. With increasing D2y, the group G1 increases from ~10−1 to ~10, revealing an increasing importance of circumferential diffusion in Eq. 10 compared with transmural diffusion.
3. Results & Discussion
3.1. Low Drug Load (C0 ≤ Cs)
The drug is dissolved in the polymer matrix when the loading is equal to or less than the solubility, and the drug transport in the coating is purely diffusion controlled (Cohen and Erneux 1998). Due to the absence of drug aggregates, the dissolved drug concentration in the stent coating depletes gradually with the release.
3.1.1. Drug Release Profiles from the Stent Coating
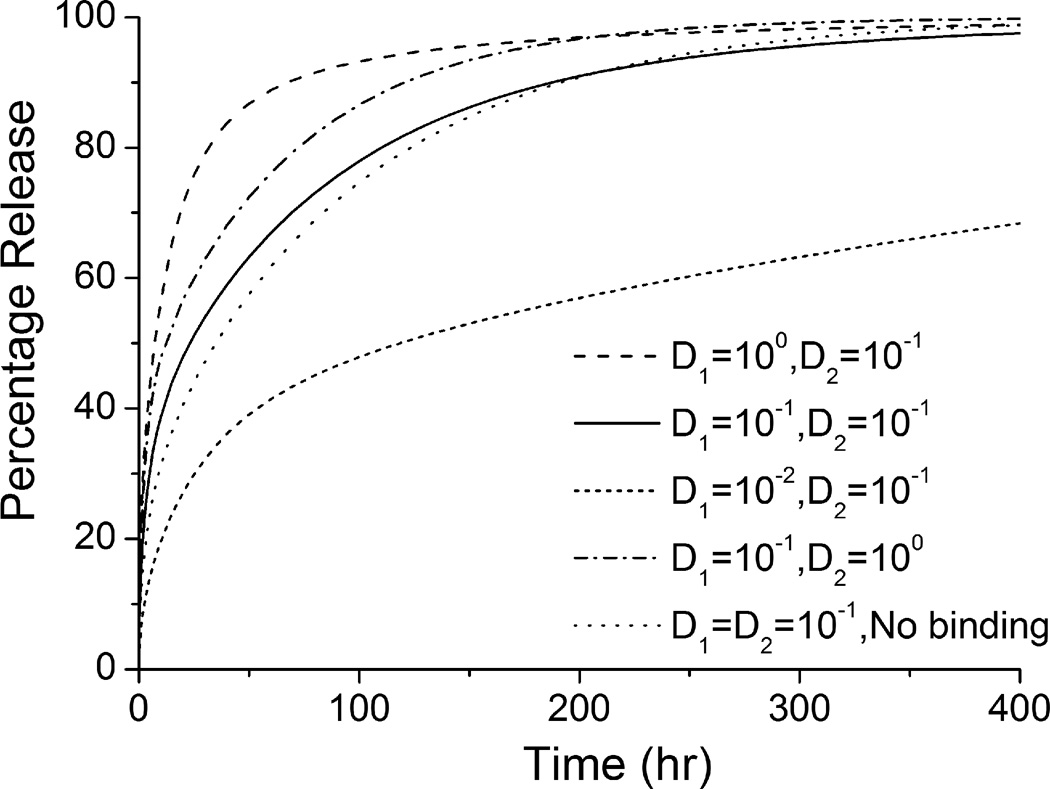
The release rate decreases significantly with reduced coating drug diffusivity (D1), when the isotropic vascular drug diffusivity (D2) remains constant (see Figure 2). Lower coating diffusivity is associated with prolonged drug release, which is in agreement with previous studies (Balakrishnan, et al. 2007, Mongrain, et al. 2007). Within the simulated range of coating diffusivity D1, more than 90% of the total drug is released in the first 100 hr at a high D1 value of 1 µm2/s, while a two-order lower D1 ensures a prolonged release of the drug by releasing less than 70% within 400 hr. Meanwhile, changes in the vascular diffusivity D2 and the presence of binding in the wall both affect the drug release process. Compared to the same change in D1, increment of an order in the magnitude of D2 significantly enhances the release rate as well. Elimination of the binding reactions results in a slightly reduced release rate, explained by the fact that with binding a greater concentration gradient is produced in the wall by transferring free drug into bound form (Sakharov, et al. 2002), and thus faster drug transport from the coating-wall interface. These findings suggest a potentially significant impact of drug-arterial wall interactions on the drug release from an implanted stent. In a clinical application of an implanted stent, even more complexity may arise due to the physiological environment compared with the simplified domain in this model. This impact leads to a difference from in vitro release measurements carried out in buffer solutions. In particular, for a drug-eluting stent with hydrophobic drug, where the drug dissipation into blood is small or negligible, drug-arterial wall interactions can vary the release profiles greatly.
Figure 2.
Drug release profiles in the stent coating at different diffusivities (with binding) and in non-binding case (the diffusivities are in units of µm2/s).
3.1.2. Spatially-Averaged Drug Concentration
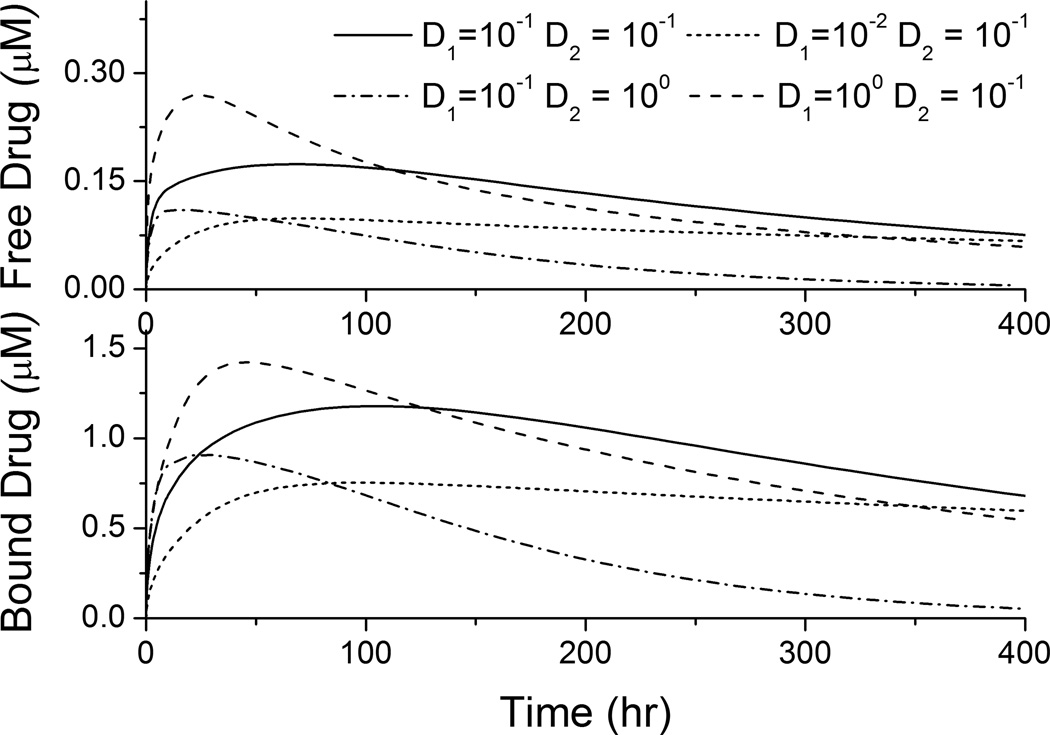
Two types of drug forms exist in the arterial wall: free drug and bound drug. The temporal profiles for the spatial average of both drug concentrations in the arterial wall were simulated (that is, the integral of the concentration over the arterial wall domain in Figure 1b divided by its volume). The spatially-averaged bound-drug concentration was about an order of magnitude higher than that of free drug in Figure 3, which is consistent in magnitude with the ratio of their dimensional groups, G2/G3 = 10. This also implies the preferred association than dissociation in the reversible binding process. For each simulated diffusivity pair (D1,D2), the spatially-averaged bound- and free-drug concentrations have similar trends over time.
Figure 3.
Spatially-averaged concentrations for the free- and bound-drug in the arterial wall for different coating and vascular diffusivities (µm2/s).
The spatially-averaged free- and bound-drug concentrations in the arterial wall approach quasi-steady values that reduce slowly for most (D1,D2) pairs (see Figure 3). The time needed to reach peak concentrations for both bound- and free-drug can be estimated by the diffusion time in the transmural direction, τ2. Evaluation with the real dimensions (reduced transmural distance due to strut embedment) in Figure 1b gives τ2 = 33.6 hour for D2 = 0.1 µm2/s, which is in agreement with the peak positions for corresponding plots in Figure 3. Besides, noticeably the quasi-steady spatially-averaged drug concentrations are dominated by the diffusivity in the wall, D2, rather than the diffusivity through the stent coating, D1. While all three (D1,D2) pairs with the same D2 (0.1 µm2/s) achieved similar quasi-steady spatially-averaged drug concentrations, the fourth (D1,D2) pair with an order-of-magnitude higher D2 (1 µm2/s) had a much lower quasi-steady drug concentration (see Figure 3). Under quasi-steady conditions, both diffusion and binding achieve a dynamic equilibrium throughout the arterial wall, and with the drug dissipation in the arterial wall occurring through the perivascular space, the binding kinetics and the vascular diffusivity D2 provide the tradeoff that specifies the quasi-steady spatially-averaged drug concentrations. Higher vascular drug diffusivity speeds the transport of free drug through the arterial wall and faster dissipation of drug at perivascular boundary.
While the quasi-steady spatially-averaged drug concentrations are similar for the same vascular diffusivity D2, the spatially-averaged drug concentrations are higher in early times for increased stent coating diffusivity D1 (see Figure 3). The higher D1 results in faster initial drug transport through the stent coating into the arterial wall (Mongrain, et al. 2007), before approaching quasi-steady spatially-averaged drug concentrations. These observations can provide some guidance in the design of the stent coating to maintain the vascular drug concentrations within the therapeutic window throughout the treatment.
3.1.3. Anisotropic Diffusivities in the Wall
The vascular drug diffusivity can be anisotropic in the transmural and circumferential directions in the coronary artery wall, mainly attributed by the flat shape of the smooth muscle cells (Hwang and Edelman 2002). For small drug molecules, the circumferential vascular diffusivity can be as high as orders of magnitude larger than the transmural diffusivity, but the anisotropy in the diffusivity gradually diminishes with increasing drug molecules. Although anisotropic diffusivity was accounted in some of the studies (Hwang, et al. 2001, Vairo, et al. 2010), there has not been a full investigation on this property. Here diffusivity anisotropy in the arterial wall is studied in detail for its impact on the drug concentration and distribution in the wall.
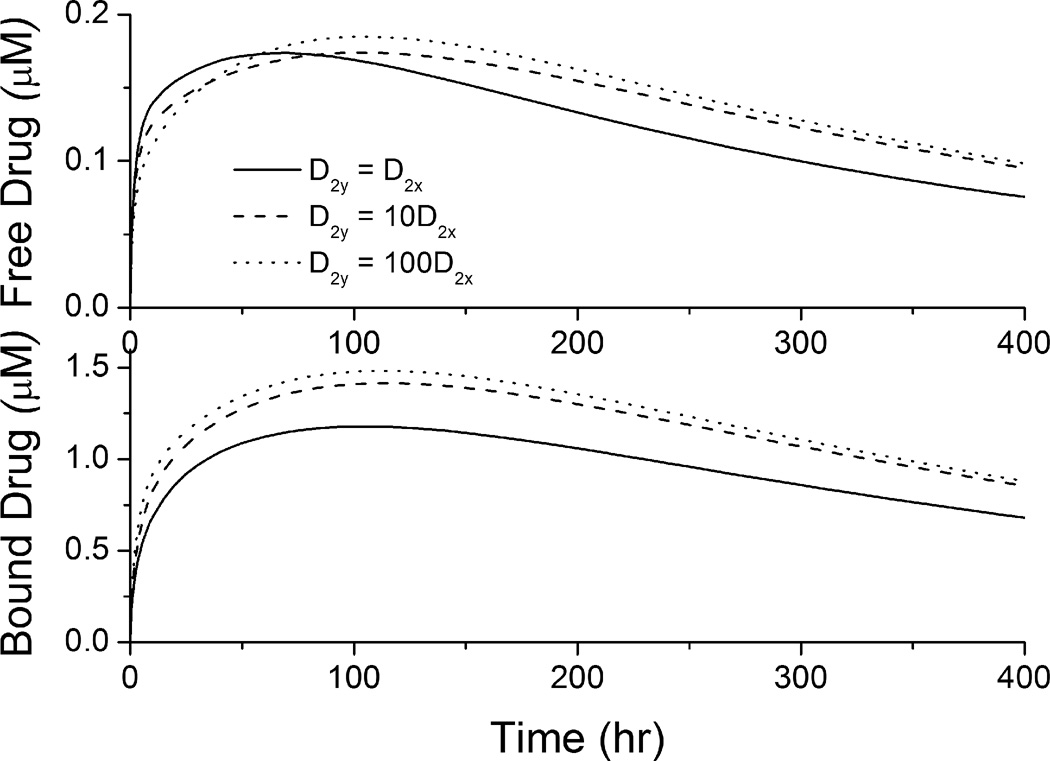
The spatially-averaged drug concentrations in the arterial wall were enhanced with increased circumferential vascular diffusivity D2y, when the transmural diffusivity D2x remains the same (see Figure 4). With increased D2y, the diffusion in the circumferential direction competes over penetration through the arterial wall (Hwang and Edelman 2002), reduces the penetrated drug concentration close to the perivascular interface and corresponding local drug dissipation. This allows a longer time for the arterial drug build-up and as a result the peak times for anisotropic cases are observed to be shifted slightly to the right compared to the isotropic case (Figure 4). Meanwhile, increased circumferential vascular diffusivity transports drug in the arterial wall away from the stent coating more quickly, resulting in faster drug release from the stent coating. These factors mentioned contribute to the enhanced spatially-averaged bound-drug concentrations at increased D2y. In early times the spatially-averaged free-drug concentration is slightly lower at enhanced circumferential diffusivity due to the increased availability of binding sites within the arterial wall where drug has diffused. With the anisotropy ratio (ratio of circumferential diffusivity to transmural diffusivity, D2y/D2x) increased from 10 to 100, the corresponding increment in the quasi-steady drug concentrations becomes less significant. This observation is partly explained as that when the circumferential diffusion is very fast compared with transmural penetration, the latter becomes the dominant limitation for drug transport in the wall and dissipation at the perivascular side. More details are included in following discussions for Figure 5.
Figure 4.
Spatially-averaged concentrations for the free- and bound-drug in the arterial wall at different circumferential diffusivities (D2x = 0.1 µm2/s).
Figure 5.
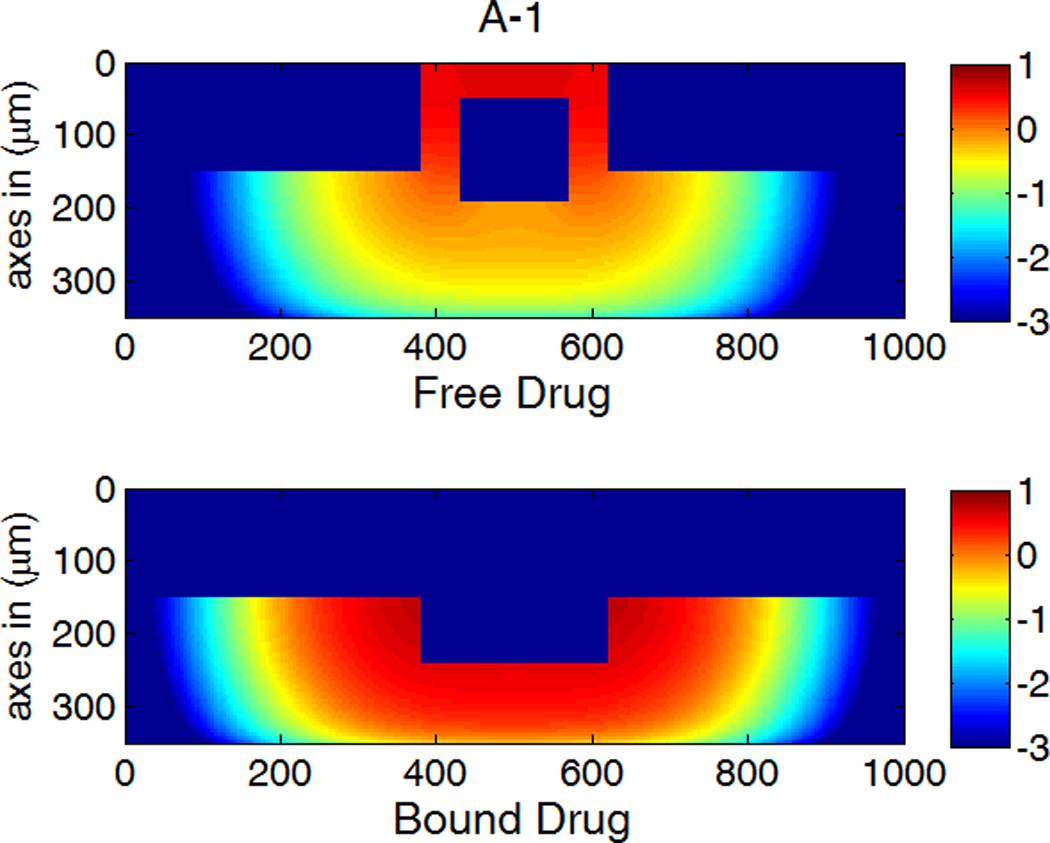
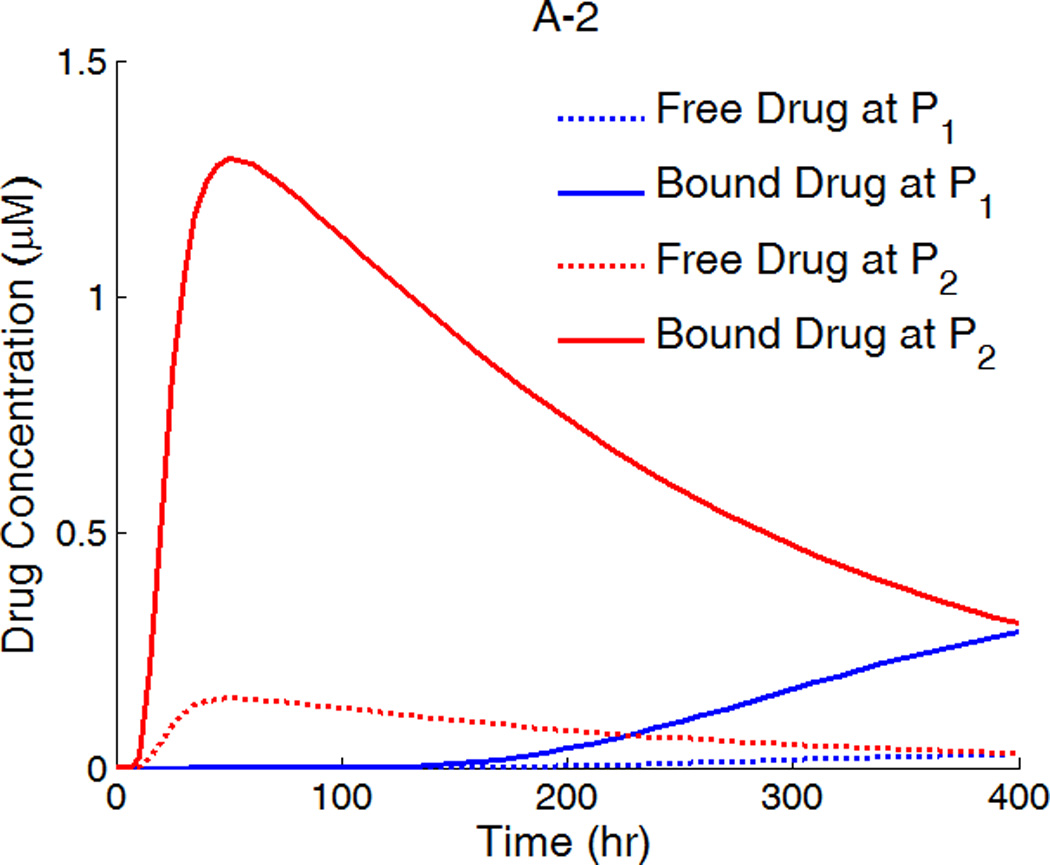
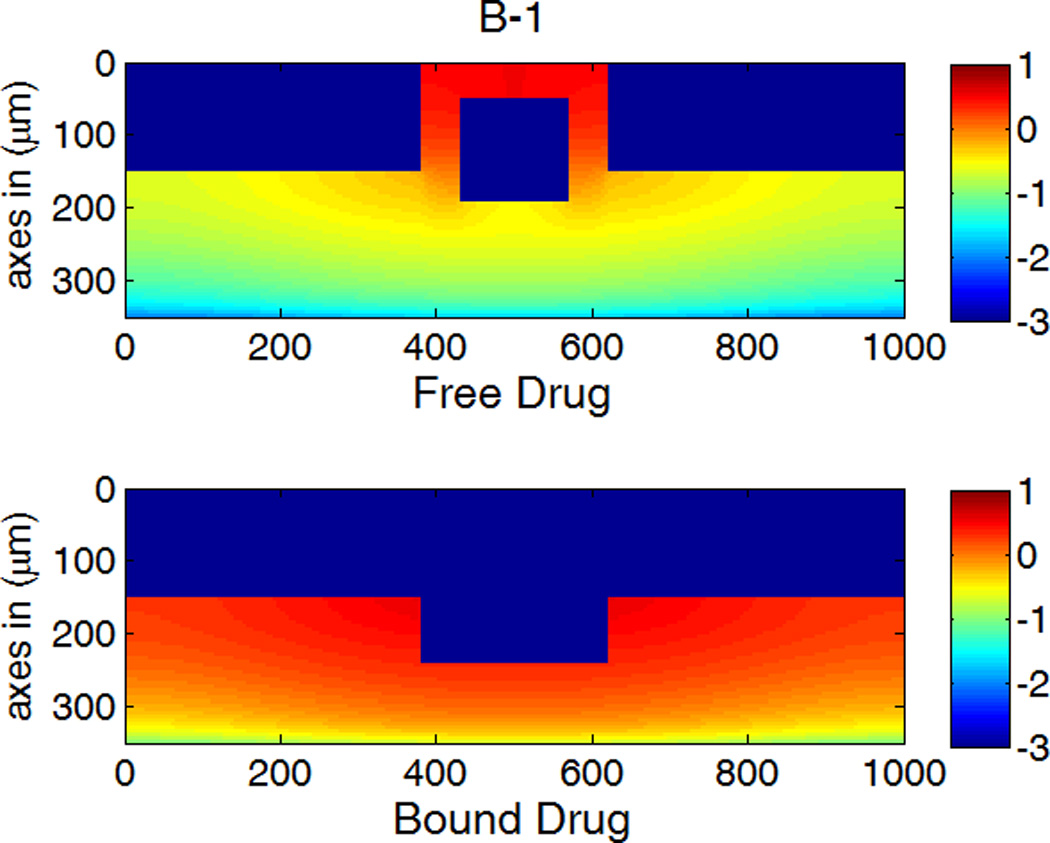
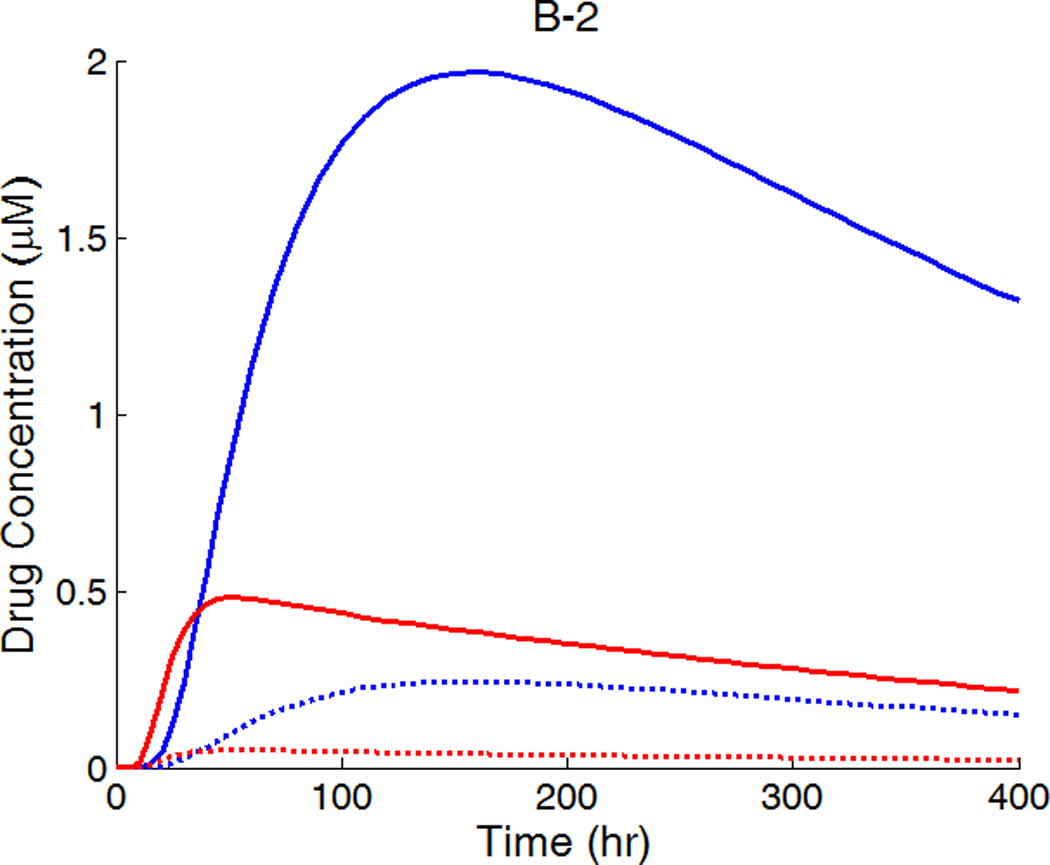
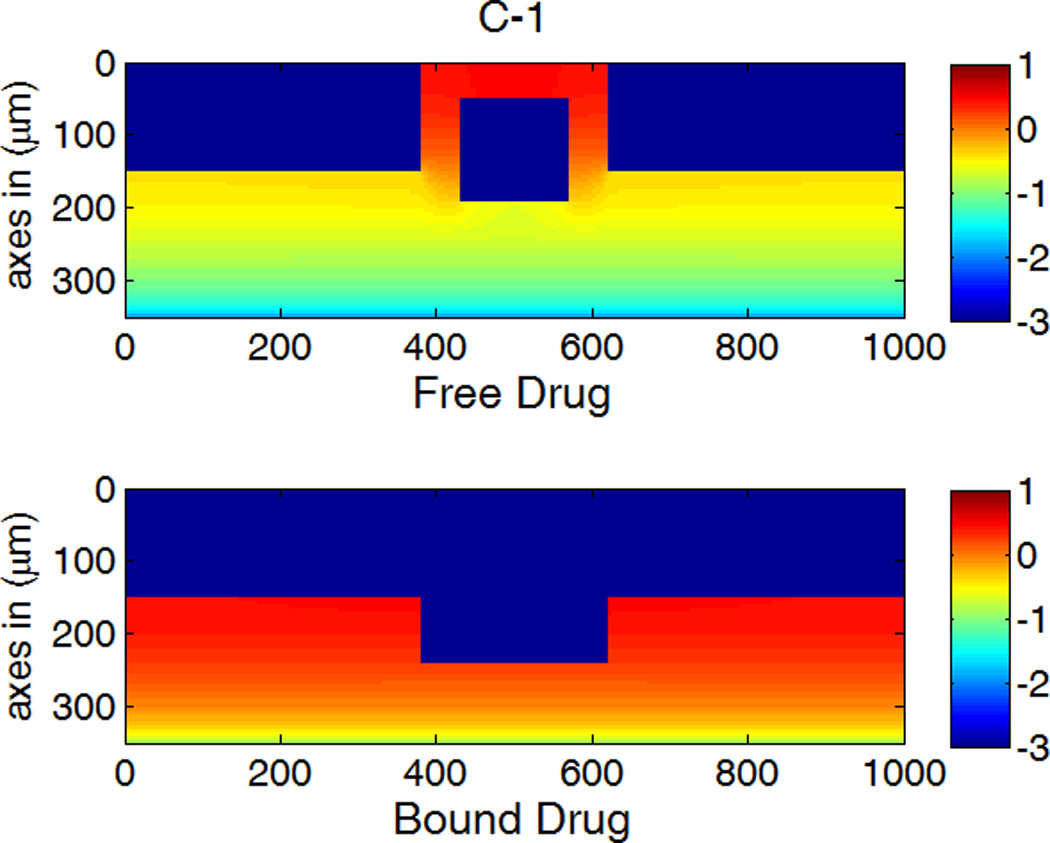
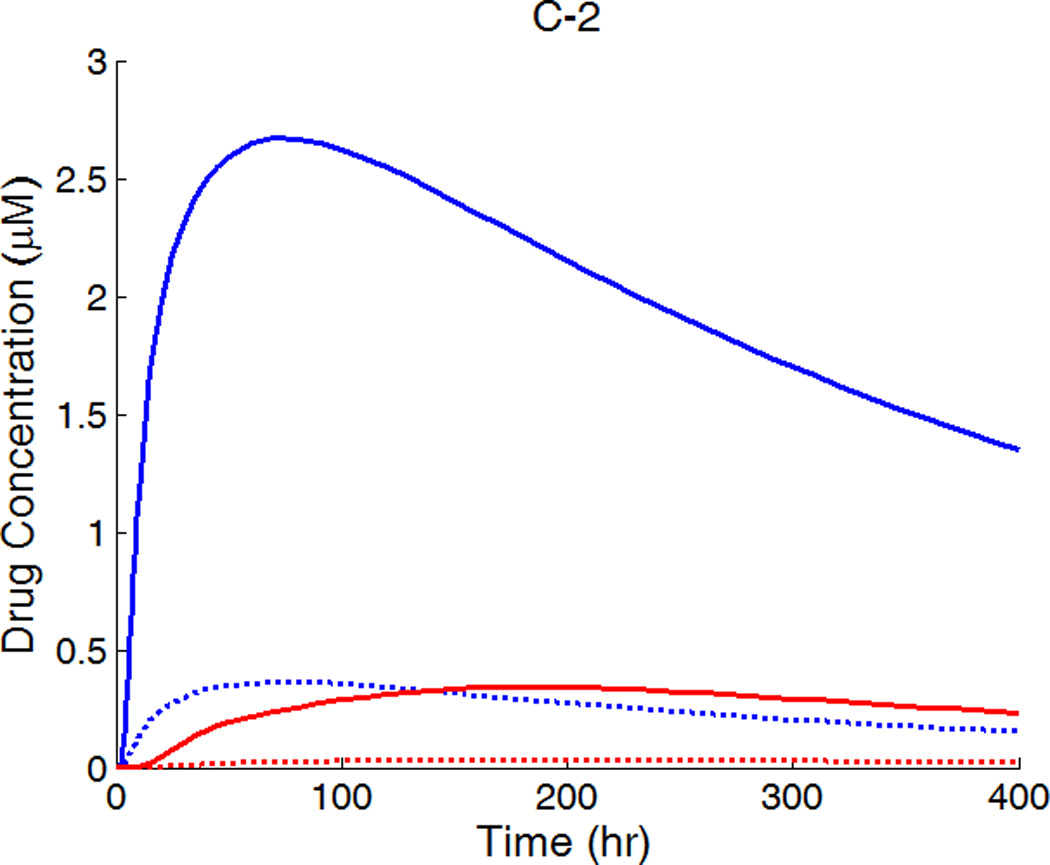
A,B,C-1: drug concentration fields at different circumferential diffusivities at 100 hr with low drug loading in the coating (logarithmic plots, D2x = 0.1 µm2/s, x and y axis are dimensions in µm); A,B,C-2: time evolution of drug concentrations (µM) at point P1 (blue) and point P2 (red), free (--) and bound (—) drug. (A) D2y = D2x, (B) D2y = 10D2x, (C) D2y = 100D2x.
Anisotropic diffusivity changes the spatial distribution of drug in the arterial wall greatly (Figure 5). Depending on the particular value of the vascular diffusivity anisotropy ratio, drug concentrations can range from being highly non-uniform along the circumference of the arterial wall (Figure 5A-1) to being highly uniform (Figure 5C-1), whereas a concentration gradient always exists in the transmural direction. At very high anisotropy ratios, the drug concentrations can be well approximated as only being a function of time and depth in the transmural direction (Figure 5C-1).
The time evolution of the drug concentrations at positions P1 and P2 (near the left and the perivascular boundaries in Figure 1b) are shown in Figure 5 as well. With increasing circumferential diffusivity D2y, the free- and bound-drug concentrations at P1 increase, and those at P2 decrease. The reduced local drug concentrations at P2 at increased circumferential diffusivity further reduces the drug dissipation at the perivascular boundary, resulting in the slightly higher spatially-average drug concentrations observed in Figure 4.
The first appearance of drug at P1 and P2 corresponds to the diffusion time in each direction (see right column in Figure 5). For isotropic diffusion in Figure 5A-2, the diffusion time in the circumferential direction is a lot longer than the penetration time. The drug distribution is very non-uniform in the circumferential direction when transmural penetration is already achieved, and areas with negligible drug concentrations exist far away from the strut (see Figure 5A-1). Similar results on free-drug concentration distribution have been reported in a model where drug binding was absent (Hwang, et al. 2001). The lack of drug in upper layers far away from the strut in the circumferential direction can be a serious factor of restenosis occurrence, as high drug concentrations in the upper layers of wall is more important than penetration in suppressing restenosis (Wessely, et al. 2006). This lack of drug in the upper layers of the arterial wall away from the stent strut after implantation also provides a potential explanation to the reported observation that the thickest restenosis occurs at the largest inter-strut angle site, where two sent struts are further apart due to uneven stent placement (Takebayashi, et al. 2004). This finding could further contribute to the observed asymmetric neointimal thickness distribution in arterial cross-section, for which higher wall shear stress was considered as an important factor to induce less neointimal growth (Carlier, et al. 2003, Wentzel, et al. 2001).
For D2y = 10D2x, the time evolution of the free- and bound-drug concentrations at the locations P1 and P2 in Figure 5B-2 shows comparable diffusion times with both positions initially receiving drug at a similar time. With even higher D2y (100D2x), the diffusion time in the circumferential direction is much shorter compared to that of penetration (see Figs. 5C-1 and 5C-2). In this case, a very fast coverage of drug in the upper media layers is achieved, and nearly uniform drug concentrations in the circumferential direction are produced. The potential adverse effect of unevenly placed struts could be greatly reduced, compared with isotropic diffusion. These simulations indicate that drugs with high diffusivity anisotropy in the arterial wall are preferable from the clinical point of view, in terms of achieving higher and more uniform drug concentration in the upper layers of the arterial wall.
3.2. High Drug Load (C0 ≫ Cs)
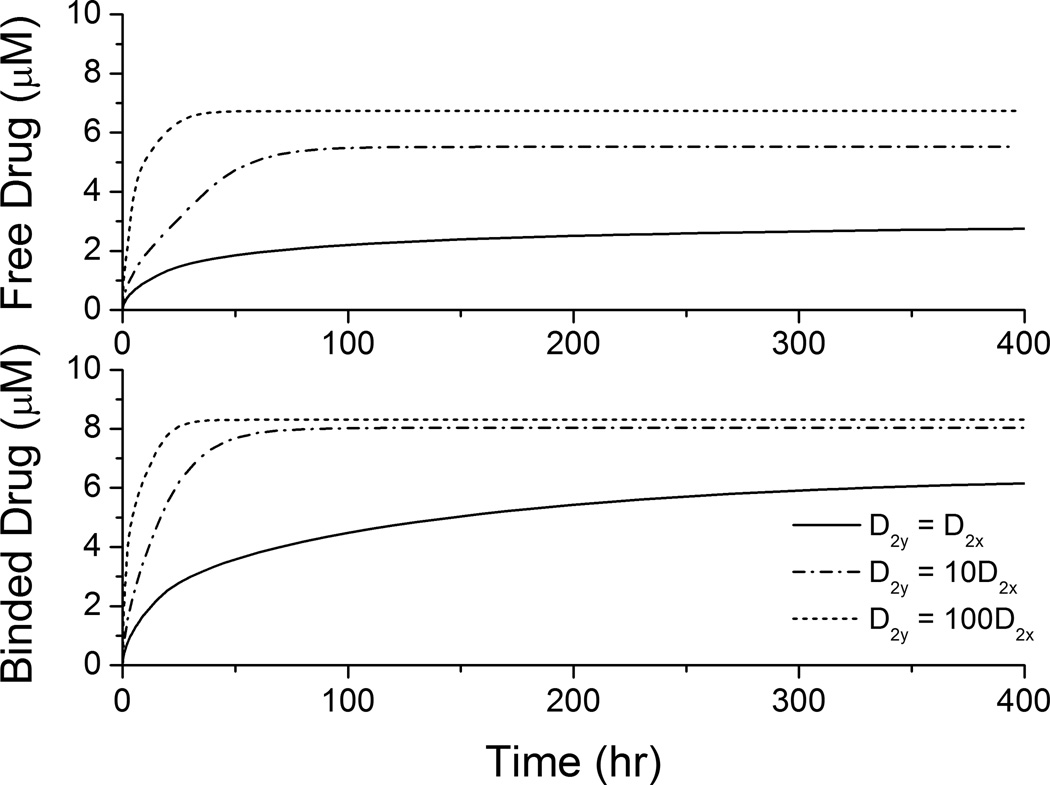
In clinical applications high drug loadings are used that are very often orders of magnitude higher than the solubility in the matrix and most of the drug is dispersed in the polymer matrix in aggregated form (Acharya and Park 2006). While the drug is released from the stent coating, the dynamic equilibrium between drug aggregates and dissolved drug ensures a continuous drug supply. When reaching a dynamic equilibrium is fast compared to the release, the drug concentration can be assumed as constant at its solubility within the coating, similar to the continuum pharmacokinetics situation investigated in some works (Kolachalama, et al. 2010). In this case, the spatially-averaged drug concentrations in the arterial wall achieve quasi-equilibrium values (as in Figure 6) until the drug aggregates in the coating is eventually depleted. Shorter times are required to achieve quasi-equilibrium with increased circumferential diffusivity, and the quasi-equilibrium drug concentrations are enhanced. Due to the availability of the prolonged drug source, the trend of enhancement is more significant here than in Figure 4.
Figure 6.
Spatially-averaged free- and bound-drug concentrations (µM) in the arterial wall under continuous drug release from the stent coating at high drug loading (D2x = 0.1 µm2/s).
The drug distribution profiles for isotropic vascular diffusivity indicate that quasi-equilibrium has not yet fully established after 400 hours due to the slow diffusion in the circumferential direction (Figure 7A-1, 2). The low quasi-equilibrium drug concentrations at sites far away from the strut in the circumferential direction lends support to the finding in the previous section that maximum restenosis thickness at maximum inter-strut angle is related to lack of drug in that position. Quasi-equilibrium was established quickly when the circumferential diffusivity D2y is enhanced (cases B and C in Figure 7.). In Figure 7B-1, the free-drug concentration forms a clear gradient centered at the strut even at quasi-equilibrium, indicating non-uniformity of drug concentration in both circumferential and transmural directions. When D2y is increased to 100D2x in Figure 7C-1, the fast circumferential diffusion compared with penetration resulted in planar layers containing uniform equilibrium drug concentrations, and layers form a drug gradient downward the arterial wall, similar to Figure 5C-1.
Figure 7.
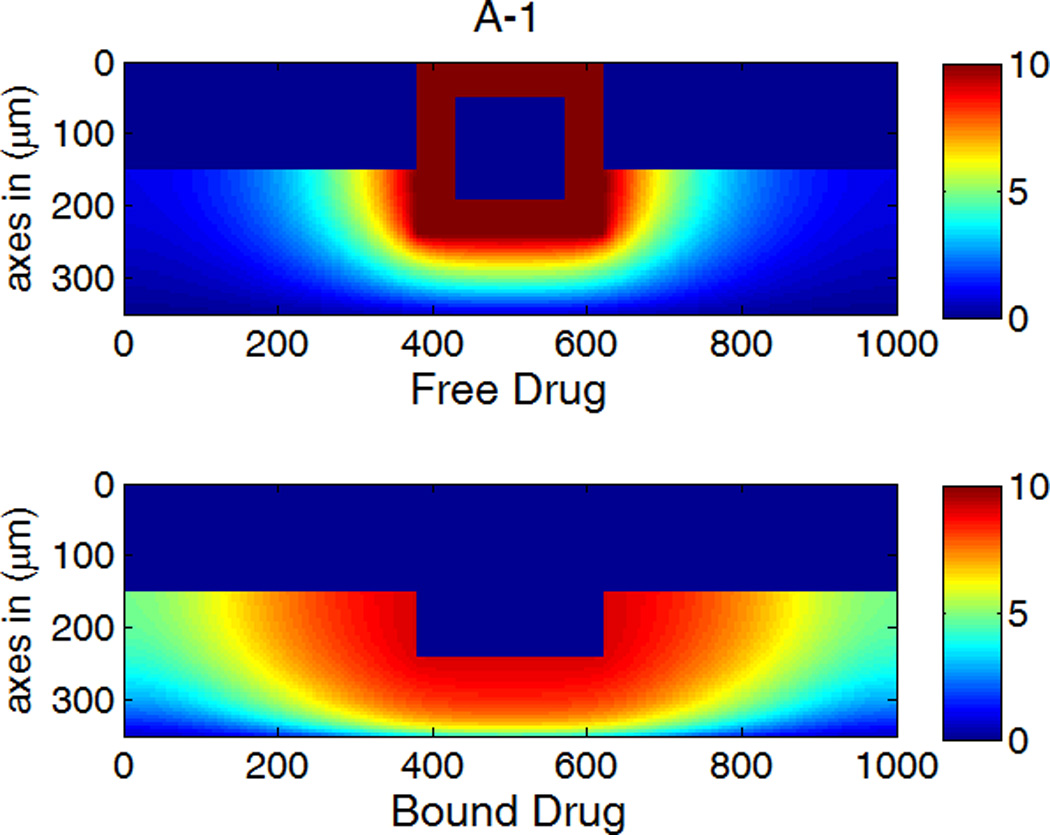
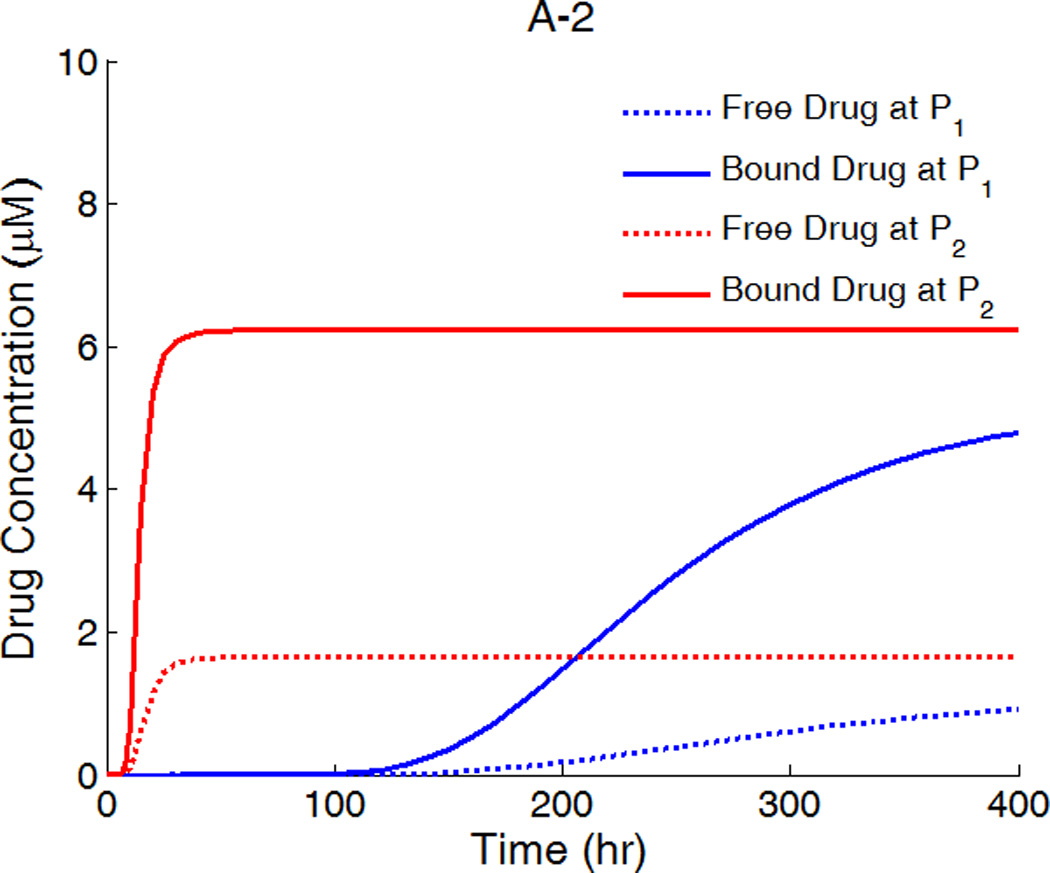
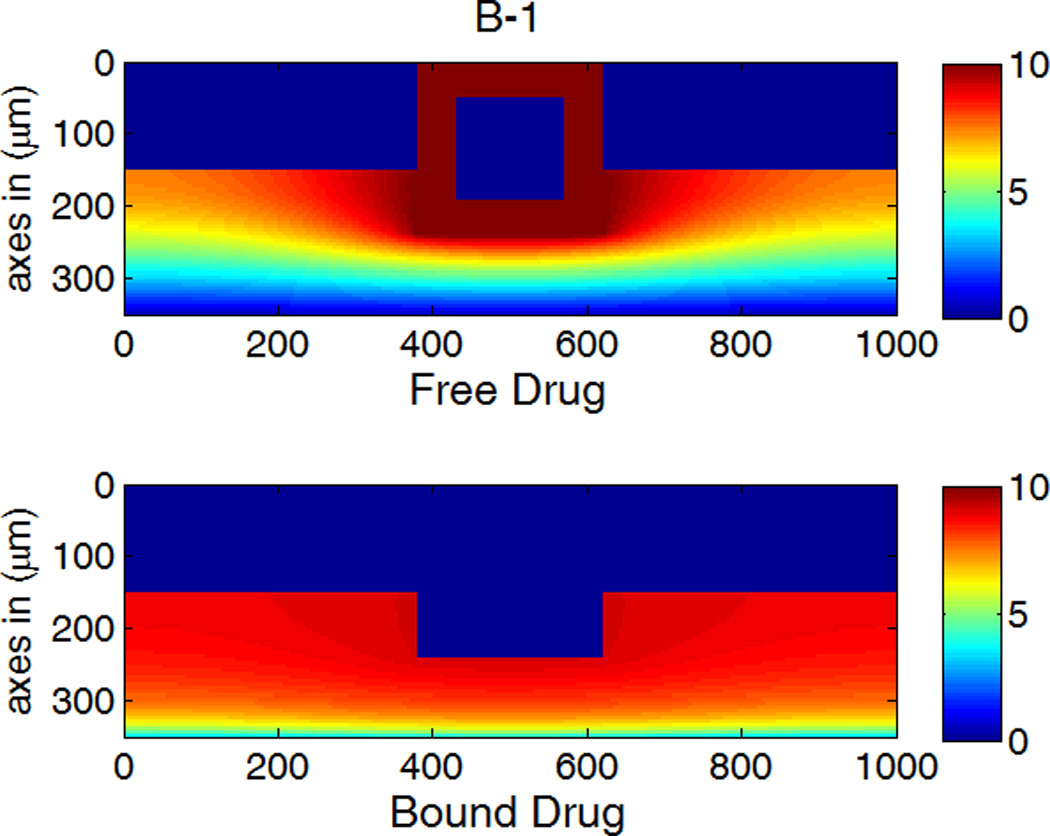
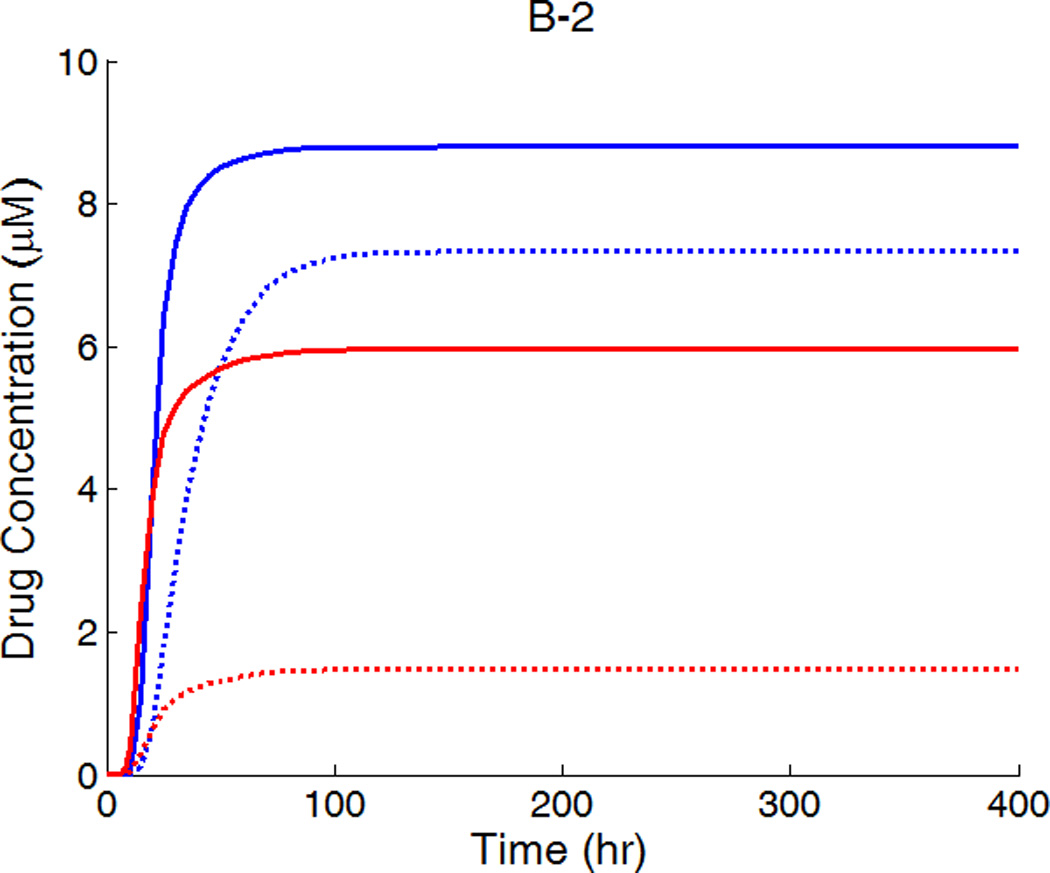
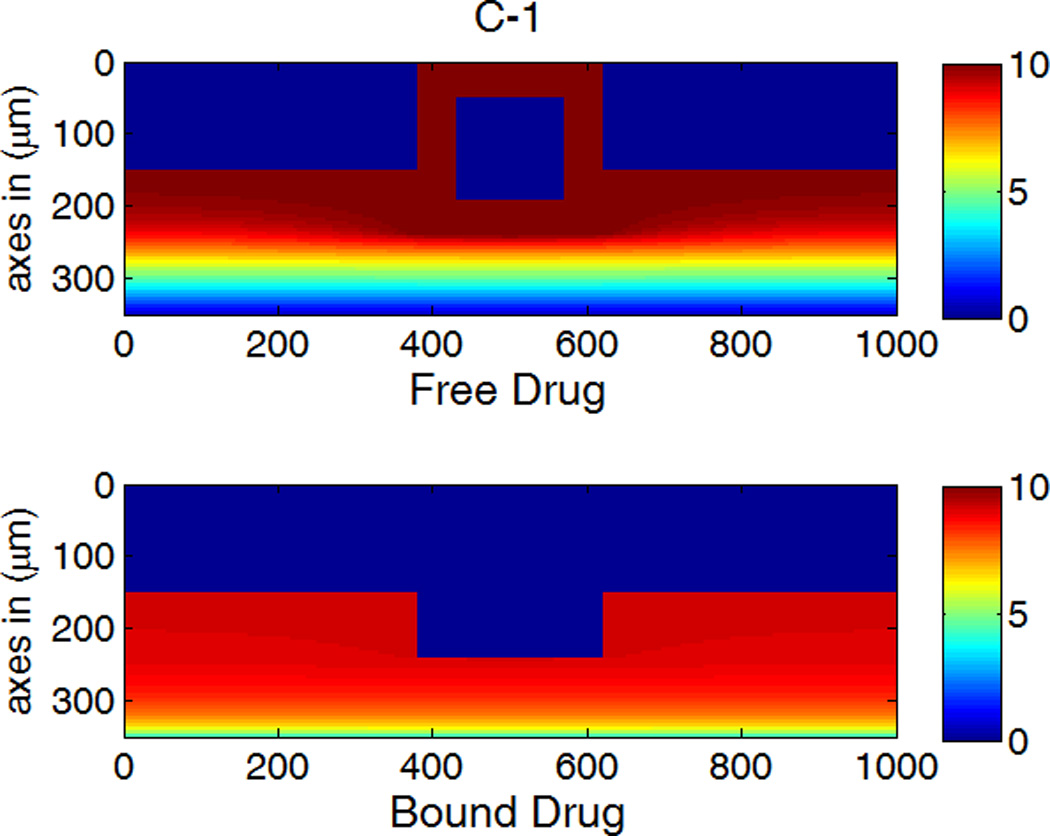
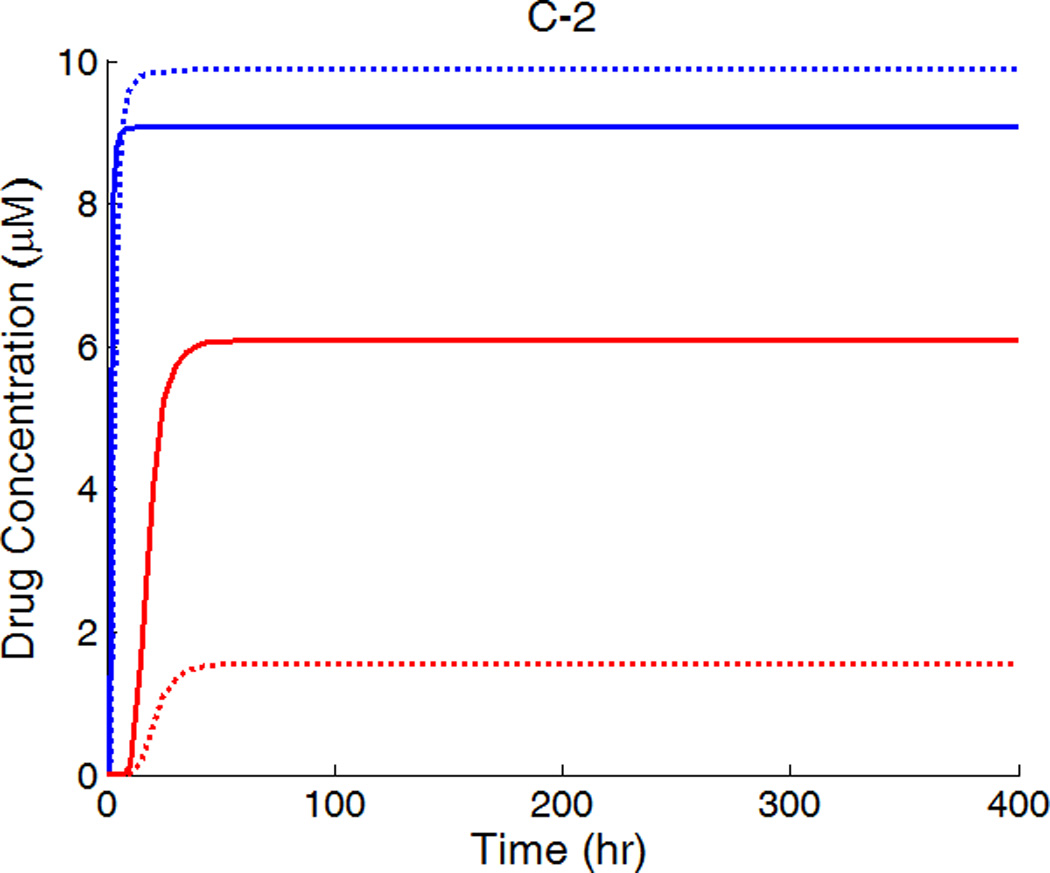
A,B,C-1: drug distribution profiles at different circumferential diffusivities at 400 hr with high drug loading in the coating (D2x = 0.1 µm2/s, x and y axis are dimensions in µm); A,B,C-2: concentration (µM) evolution at point P1 (blue) and point P2 (red), free (--) and bound (—) drug. (A) D2y = D2x, (B) D2y = 10D2x, (C) D2y = 100D2x.
The concentrations at boundary points P1 and P2 (as located in Figure 1b) in Figure 7 (A,B,C-2) have a similar initial trend as those in Figure 5, while reaching at constant quasi-equilibrium levels. In Figure 7C-2, the free-drug concentration at quasi-equilibrium is higher than that of the bound drug at P1. A careful investigation of C-1 shows that this circumstance is true for a large vascular area neighboring the strut. Although part of the arterial wall has higher free-drug level than that of bound drug, the spatially-averaged concentration is still lower for free drug (see Figure 6), as expected from the preferred association to dissociation in binding. These simulations show that, while the spatially-averaged concentrations have higher bound-drug concentration than that of free drug, this observation does not necessarily hold for individual vascular sites.
The critical condition for the occurrence that free-drug concentration exceeds that of bound-drug can be derived. Assuming at equilibrium conditions, the rates of association and dissociation in Eq. 3 are equal, kaC(S0 − B) = kdB. This equation can be rearranged to solve for the free-binding-site concentration in terms of the free-drug concentration, B = KCS0/ (KC + 1), where K = ka/kd is the binding equilibrium constant. For a higher concentration of free drug than bound drug, or C > B, the condition can be reduced to C > S0 −1/K. Because the highest free-drug concentration in the wall occurs at the coating-wall boundary, where C = Cs/κCW, and the inequality becomes Eq. 12,
| (12) |
When this inequality is satisfied, higher free-drug concentration can occur in the region close to the strut. Furthermore, the relationship also defines the boundary of equal free- and bound-drug concentrations in this work, which is met by C = S0 −1/K = 9 µM.
4. Conclusion
The intravascular drug delivery of a hydrophobic drug from a drug-eluting stent and coupled drug binding and distribution in the arterial wall were modeled simultaneously. Dimensionless groups were derived to provide insights into the relative importance of directionally-dependent diffusivities and reversible binding on the spatiotemporal distribution of drug in the surrounding arterial wall. Drug release from a implanted drug-eluting stent is affected by the surrounding arterial wall via the vascular drug diffusivity and reversible binding reaction, which implies a potentially large difference from in vitro release behaviors of a hydrophobic drug. Moreover, the average drug concentrations in the arterial wall at quasi-steady state are observed to be greatly determined by the vascular drug diffusivity rather than the coating drug diffusivity. Anisotropic vascular drug diffusivities result in slightly different spatially-averaged drug levels but very different spatial distributions, and higher free-drug concentration than bound-drug concentration can occur in the arterial wall. For the latter the critical condition of occurrence was derived as Cs/κcw > S0 −1/K. Higher circumferential vascular diffusivity reduces the drug gradient in the circumferential direction and produces more uniformly loaded drug layers, which can be beneficial in reducing in-stent restenosis after drug-eluting stent implantation. Simulation results as presented here provide insights as to how changes in drug properties (such as its directional diffusivities) influence spatial uniformity in the arterial wall and show potential guidance for designing drug-eluting stents with improved efficacy.
Acknowledgements
Support is acknowledged from the National Institutes of Health NIBIB 5RO1EB005181 and the National Science Foundation (Grant #0426328). The last author thanks David Mooney for hosting him at Harvard University while this manuscript was being written.
References
- Acharya G, Park K. Mechanisms of controlled drug release from drug-eluting stents. Adv Drug Deliver Rev. 2006;58(3):387–401. doi: 10.1016/j.addr.2006.01.016. [DOI] [PubMed] [Google Scholar]
- Bailey SR. DES Design: Theoretical Advantages and Disadvantages of Stent Strut Materials, Design, Thickness, and Surface Characteristics. J Interv Cardiol. 2009:S3–S17. [Google Scholar]
- Balakrishnan B, Dooley J, Kopia G, Edelman ER. Thrombus causes fluctuations in arterial drug delivery from intravascular stents. J Control Release. 2008;131(3):173–180. doi: 10.1016/j.jconrel.2008.07.027. [DOI] [PMC free article] [PubMed] [Google Scholar]
- Balakrishnan B, Dooley JF, Kopia G, Edelman ER. Intravascular drug release kinetics dictate arterial drug deposition, retention, and distribution. J Control Release. 2007;123(2):100–108. doi: 10.1016/j.jconrel.2007.06.025. [DOI] [PMC free article] [PubMed] [Google Scholar]
- Balakrishnan B, Tzafriri AR, Seifert P, Groothuis A, Rogers C, Edelman ER. Strut position, blood flow, and drug deposition - Implications for single and overlapping drug-eluting stents. Circulation. 2005;111(22):2958–2965. doi: 10.1161/CIRCULATIONAHA.104.512475. [DOI] [PubMed] [Google Scholar]
- Borghi A, Foa E, Balossino R, Migliavacca F, Dubini G. Modelling drug elution from stents: effects of reversible binding in the vascular wall and degradable polymeric matrix. Comput Method Biomec. 2008;11(4):367–377. doi: 10.1080/10255840801887555. [DOI] [PubMed] [Google Scholar]
- Carlier SG, van Damme LCA, Blommerde CP, Wentzel JJ, van Langehove G, Verheye S, Kockx MM, Knaapen MWM, Cheng C, Gijsen F, et al. Augmentation of wall shear stress inhibits neointimal hyperplasia after stent implantation - Inhibition through reduction of inflammation? Circulation. 2003;107(21):2741–2746. doi: 10.1161/01.CIR.0000066914.95878.6D. [DOI] [PubMed] [Google Scholar]
- Cohen DS, Erneux T. Controlled drug release asymptotics. Siam J Appl Math. 1998;58(4):1193–1204. [Google Scholar]
- Costa MA, Simon DI. Molecular basis of restenosis and drug-eluting stents. Circulation. 2005;111(17):2257–2273. doi: 10.1161/01.CIR.0000163587.36485.A7. [DOI] [PubMed] [Google Scholar]
- Creel CJ, Lovich MA, Edelman ER. Arterial paclitaxel distribution and deposition. Circ Res. 2000;86(8):879–884. doi: 10.1161/01.res.86.8.879. [DOI] [PubMed] [Google Scholar]
- Daemen J, Serruys PW. Drug-eluting stent update 2007 part I: a survey of current and future generation drug-eluting stents: meaningful advances or more of the same? Circulation. 2007;116(3):316–328. doi: 10.1161/CIRCULATIONAHA.106.621342. [DOI] [PubMed] [Google Scholar]
- Deconinck E, Sohier I, De Scheerder I, Van Den Mooter G. Pharmaceutical Aspects of Drug Eluting Stents. Journal of Pharmaceutical Sciences. 2008;97(12):5047–5060. doi: 10.1002/jps.21356. [DOI] [PubMed] [Google Scholar]
- Durran DR. Numerical methods for wave equations in geophysical fluid dynamics. New York: Springer; 1999. [Google Scholar]
- Fattori R, Piva T. Drug-eluting stents in vascular intervention. Lancet. 2003;361(9353):247–249. doi: 10.1016/S0140-6736(03)12275-1. [DOI] [PubMed] [Google Scholar]
- Finkelstein A, McClean D, Kar S, Takizawa K, Varghese K, Baek N, Park K, Fishbein MC, Makkar R, Litvack F, et al. Local drug delivery via a coronary stent with programmable release pharmacokinetics. Circulation. 2003;107(5):777–784. doi: 10.1161/01.cir.0000050367.65079.71. [DOI] [PubMed] [Google Scholar]
- Grassi M, Pontrelli G, Teresi L, Grassi G, Comel L, Ferluga A, Galasso L. Novel Design of Drug Delivery in Stented Arteries: A Numerical Comparative Study. Math Biosci Eng. 2009;6(3):493–508. doi: 10.3934/mbe.2009.6.493. [DOI] [PubMed] [Google Scholar]
- Hossainy S, Prabhu S. A mathematical model for predicting drug release from a biodurable drugeluting stent coating. J Biomed Mater Res A. 2008;87A(2):487–493. doi: 10.1002/jbm.a.31787. [DOI] [PubMed] [Google Scholar]
- Hwang CW, Edelman ER. Arterial ultrastructure influences transport of locally delivered drugs. Circ Res. 2002;90(7):826–832. doi: 10.1161/01.res.0000016672.26000.9e. [DOI] [PubMed] [Google Scholar]
- Hwang CW, Levin AD, Jonas M, Li PH, Edelman ER. Thrombosis modulates arterial drug distribution for drug-eluting stents. Circulation. 2005;111(13):1619–1626. doi: 10.1161/01.CIR.0000160363.30639.37. [DOI] [PubMed] [Google Scholar]
- Hwang CW, Wu D, Edelman ER. Physiological transport forces govern drug distribution for stentbased delivery. Circulation. 2001;104(5):600–605. doi: 10.1161/hc3101.092214. [DOI] [PubMed] [Google Scholar]
- Kamath KR, Barry JJ, Miller KM. The Taxus (TM) drug-eluting stent: A new paradigm in controlled drug delivery. Adv Drug Deliver Rev. 2006;58(3):412–436. doi: 10.1016/j.addr.2006.01.023. [DOI] [PubMed] [Google Scholar]
- Kolachalama VB, Tzafriri AR, Arifin DY, Edelman ER. Luminal flow patterns dictate arterial drug deposition in stent-based delivery (vol 133, pg 24, 2009) J Control Release. 2010;146(1):160–160. doi: 10.1016/j.jconrel.2008.09.075. [DOI] [PMC free article] [PubMed] [Google Scholar]
- Levin AD, Vukmirovic N, Hwang CW, Edelman ER. Specific binding to intracellular proteins determines arterial transport properties for rapamycin and paclitaxel. P Natl Acad Sci USA. 2004;101(25):9463–9467. doi: 10.1073/pnas.0400918101. [DOI] [PMC free article] [PubMed] [Google Scholar]
- Lovich MA, Creel C, Hong K, Hwang CW, Edelman ER. Carrier proteins determine local pharmacokinetics and arterial distribution of paclitaxel. Journal of Pharmaceutical Sciences. 2001;90(9):1324–1335. doi: 10.1002/jps.1085. [DOI] [PubMed] [Google Scholar]
- Lovich MA, Edelman ER. Mechanisms of Transmural Heparin Transport in the Rat Abdominal- Aorta after Local Vascular Delivery. Circ Res. 1995;77(6):1143–1150. doi: 10.1161/01.res.77.6.1143. [DOI] [PubMed] [Google Scholar]
- Lovich MA, Philbrook M, Sawyer S, Weselcouch E, Edelman ER. Arterial heparin deposition: role of diffusion, convection, and extravascular space. Am J Physiol-Heart C. 1998;44(6):H2236–H2242. doi: 10.1152/ajpheart.1998.275.6.H2236. [DOI] [PubMed] [Google Scholar]
- Lovick MA, Edelman ER. Computational simulations of local vascular heparin deposition and distribution. Am J Physiol-Heart C. 1996;40(5):H2014–H2024. doi: 10.1152/ajpheart.1996.271.5.H2014. [DOI] [PubMed] [Google Scholar]
- Mongrain R, Faik I, Leask RL, Rodes-Cabau J, Larose E, Bertrand OF. Effects of diffusion coefficients and struts apposition using numerical simulations for drug eluting coronary stents. J Biomech Eng-T Asme. 2007;129(5):733–742. doi: 10.1115/1.2768381. [DOI] [PubMed] [Google Scholar]
- Murata T, Hiro T, Fujii T, Yasumoto K, Murashige A, Kohno M, Yamada J, Miura T, Matsuzaki M. Impact of the cross-sectional geometry of the post-deployment coronary stent on in-stent neointimal hyperplasia - An intravascular ultrasound study. Circ J. 2002;66(5):489–493. doi: 10.1253/circj.66.489. [DOI] [PubMed] [Google Scholar]
- Pontrelli G, de Monte F. A multi-layer porous wall model for coronary drug-eluting stents. International Journal of Heat and Mass Transfer. 2010;53(19–20):3629–3637. [Google Scholar]
- Ranade SV, Miller KM, Richard RE, Chan AK, Allen MJ, Helmus MN. Physical characterization of controlled release of paclitaxel from the TAXUS(TM) Express(2TM) drug-eluting stent. J Biomed Mater Res A. 2004;71A(4):625–634. doi: 10.1002/jbm.a.30188. [DOI] [PubMed] [Google Scholar]
- Sakharov DV, Kalachev LV, Rijken DC. Numerical simulation of local pharmacokinetics of a drug after intravascular delivery with an eluting stent. J Drug Target. 2002;10(6):507–513. doi: 10.1080/1061186021000038382. [DOI] [PubMed] [Google Scholar]
- Santin M, Colombo P, Bruschi G. Interfacial biology of in-stent restenosis. Expert Rev Med Devic. 2005;2(4):429–443. doi: 10.1586/17434440.2.4.429. [DOI] [PubMed] [Google Scholar]
- Sharkawi T, Leyni-Barbaz D, Chikh N, McMullen JN. Evaluation of the in vitro drug release from resorbable biocompatible coatings for vascular stents. J Bioact Compat Pol. 2005;20(2):153–168. [Google Scholar]
- Sousa JE, Serruys PW, Costa MA. New frontiers in cardiology - Drug-eluting stents: Part I. Circulation. 2003;107(17):2274–2279. doi: 10.1161/01.CIR.0000069330.41022.90. [DOI] [PubMed] [Google Scholar]
- Takebayashi H, Mintz GS, Carlier SG, Kobayashi Y, Fujii K, Yasuda T, Costa RA, Moussa I, Dangas GD, Mehran R, et al. Nonuniform strut distribution correlates with more neointimal hyperplasia after sirolimus-eluting stent implantation. Circulation. 2004;110(22):3430–3434. doi: 10.1161/01.CIR.0000148371.53174.05. [DOI] [PubMed] [Google Scholar]
- Tzafriri AR, Vukmirovic N, Kolachalama VB, Astafieva I, Edelman ER. Lesion complexity determines arterial drug distribution after local drug delivery. J Control Release. 2010;142(3):332–338. doi: 10.1016/j.jconrel.2009.11.007. [DOI] [PMC free article] [PubMed] [Google Scholar]
- Vairo G, Cioffi M, Cottone R, Dubini G, Migliavacca F. Drug release from coronary eluting stents: A multidomain approach. J Biomech. 2010;43(8):1580–1589. doi: 10.1016/j.jbiomech.2010.01.033. [DOI] [PubMed] [Google Scholar]
- Venkatraman S, Boey F. Release profiles in drug-eluting stents: Issues and uncertainties. J Control Release. 2007;120(3):149–160. doi: 10.1016/j.jconrel.2007.04.022. [DOI] [PubMed] [Google Scholar]
- Wentzel JJ, Krams R, Schuurbiers JCH, Oomen JA, Kloet J, van der Giessen WJ, Serruys PW, Slager CJ. Relationship between neointimal thickness and shear stress after wallstent implantation in human coronary arteries. Circulation. 2001;103(13):1740–1745. doi: 10.1161/01.cir.103.13.1740. [DOI] [PubMed] [Google Scholar]
- Wessely R, Schomig A, Kastrati A. Sirolimus and paclitaxel on polymer-based drug-eluting stents - Similar but different. J Am Coll Cardiol. 2006;47(4):708–714. doi: 10.1016/j.jacc.2005.09.047. [DOI] [PubMed] [Google Scholar]
- Zhang FM, Fath M, Marks R, Linhardt RJ. A highly stable covalent conjugated heparin biochip for heparin-protein interaction studies. Anal Biochem. 2002;304(2):271–273. doi: 10.1006/abio.2002.5617. [DOI] [PubMed] [Google Scholar]
- Zunino P, D'Angelo C, Petrini L, Vergara C, Capelli C, Migliavacca F. Numerical simulation of drug eluting coronary stents: Mechanics, fluid dynamics and drug release. Comput Method Appl M. 2009;198(45–46):3633–3644. [Google Scholar]


