Abstract
One defining characteristic of the mammalian brain is its neuronal diversity1. For a given region, substructure or layer and even cell type2, variability in neuronal morphology and connectivity2-5 persists. While it is well established that such cellular properties vary considerably according to neuronal type, the significant biophysical diversity of neurons of the same morphological class is typically averaged out and ignored. Here we show that the amplitude of hyperpolarization-evoked membrane potential sag recorded in olfactory bulb mitral cells is an emergent, homotypic property of local networks and sensory information processing. Simultaneous whole-cell recordings from pairs of cells reveal that the amount of hyperpolarization-evoked sag potential and current6 is stereotypic for mitral cells belonging to the same glomerular circuit. This is corroborated by a mosaic, glomerulus-based pattern of expression of the HCN2 subunit of the hyperpolarization-activated current (Ih) channel. Furthermore, inter-glomerular differences in both membrane potential sag and HCN2 protein are diminished when sensory input to glomeruli is genetically and globally altered so only one type of odorant receptor is universally expressed7. We therefore suggest that population diversity in the intrinsic profile of mitral cells reflect functional adaptations of distinct local circuits dedicated to processing subtly different odor-related information.
Neurons exhibit a broad array of biophysical properties that profoundly impact the computations they perform. Even within cell type, diversity in morphology8, expression of molecular markers1 and ion channels9 is well documented but whether such variation reflects necessary biological noise10 or perhaps a functional, dynamic system for regulating excitability at the cellular11 or even network level remains unclear. The h-current (Ih), or sag potential is one intrinsic biophysical property known to influence the input12-14–output15-17 function of most principal cell types18. In the olfactory bulb the broad amplitude distribution of Ih –mediated sag potential recorded across the mitral cell population has recently been shown to reflect functional diversity in their input–output responses to in vivo stimuli6.
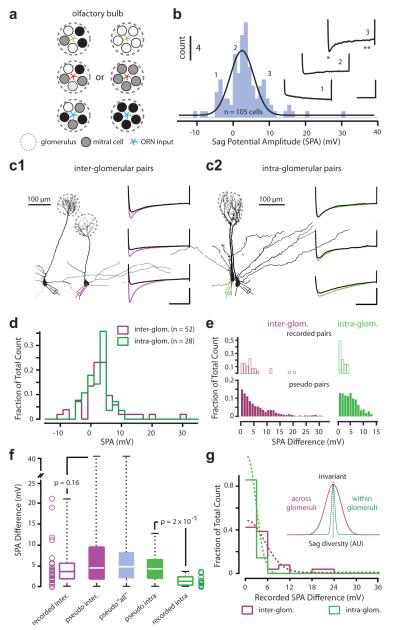
To directly explore whether cell-to-cell variability in membrane potential sag might reflect differences between functional ensembles of mitral cells, we have taken advantage of the fact that in some brain regions the local architecture facilitates the identification of functionally discrete networks of neurons19. This is especially true for the olfactory bulb, where glomeruli act as information hubs that receive inputs from a unique, homogeneous population of sensory afferents20 that are integrated by a network of a few hundred interconnected local interneurons and principal mitral and tufted cells. Thus, in a slice preparation, individual mitral cells can be precisely linked to the functional circuit in which they operate in vivo21,22 permitting us to explore whether their intrinsic diversity reflects an emergent property of the functional organization of the olfactory bulb (Figure 1a).
Figure 1. Diversity of sag potential amplitudes within and across mitral cell networks.
a) Schematic of two possible organizing principles of mitral cell biophysical diversity. Each olfactory glomerulus receives genetically unique input, indicated in red, green and blue. The intrinsic, biophysical properties of mitral cells (represented by the different colored circles) within a glomerular network may be heterogeneous (left) or homogenous (right). b) Histogram (fitted with a Gaussian) showing the distribution of sag potential amplitude (SPA) recorded across the mitral cell population (n = 105 cells). Traces are three examples recorded from cells belonging to the indicated bins. Scale bar is 600 ms and 15 mV. Example morphologies of two simultaneously recorded mitral cells projecting to either different (c1) or the same glomerular networks (c2). The voltage traces show the sag potential recorded in three examples of inter- and intra-glomerular pairs. Scale bar is 500 ms and 10 mV. d) Histograms of SPA for all individual cells belonging to either inter- (purple) and intra-glomerular (green) pairs. e) top: Histograms of recorded SPA differences for inter- (n = 26) and intra-glomerular (n = 14) pairs. bottom: Histograms of SPA differences for inter- and intra-glomerular pseudo pairs. f) Boxplot of recorded and pseudo inter-glomerular pairs, pseudo-pairs of all recordings, intra-glomerular pseudo- and recorded pairs. Open circles represent individual data points of recorded SPA difference. g) Histogram of sag amplitude difference for inter- and intra-glomerular recorded pairs fitted with a half Gaussian (n = 26 and 14 pairs respectively; bin size = 3 mV). Inset: Gaussian fits of the recorded data for intra-glomerular (green) and inter-glomerular pairs.
In wild-type mice, mitral cells can exhibit a hyperpolarization-evoked rebound potential and current indicative of the Ih – mediated sag potential recently described in the rat, both in vitro and in vivo6 (Supplementary Figure 1). The distribution of sag potential amplitude (SPA) recorded across the mitral cell population in mouse is similarly uni-modal (p < 0.05) and broad (min = −10.4 mV, max = 30.65 mV, median = 3 mV, mean = 3.43 ± 5.8 mV, n = 105 cells, n = 39 animals; Figure 1b, Supplementary Figure 1). To explore the possibility such population diversity might reflect differences between local mitral cell networks (Figure 1a), we performed simultaneous whole-cell recordings of sag from pairs of cells belonging to distinctly different (Figure 1c1) or the same glomerular ensemble (Figure 1c2). The mean SPA obtained under these two recording scenarios was not significantly different (inter-glom pairs, 3.3 ± 6.7 mV, n = 52 cells vs intra-glom pairs 2.45 ± 3.72 mV, n = 28 cells, p = 0.41; Figure 1d). For each recorded pair we determined the absolute difference in SPA (Supplementary Figure 2) and performed a multiple pair-wise comparison, whereby the SPA difference between each cell and all other cells within the same group –excluding its simultaneously recorded ‘partner’– was calculated (‘pseudo pairs’, Figure 1e). For inter-glomerular pairs of mitral cells, the distribution of SPA difference between recorded and pseudo pairs was similar (recorded: min = 0.03 mV, max = 21.06 mV, median = 3.57 mV, Q1, Q3 = 1.87, 5.35 mV respectively, n = 26 pairs vs pseudo pairs: min = 0.01mV, max = 41.05 mV, median = 4.435 mV, Q1, Q3 = 1.78, 9.46 mV, n = 1300, p = 0.16; Figure 1e,f). This was also the case when comparing inter-glomerular recorded pairs and pseudo pairs extracted from our entire data set (n = 105 cells, 5460 pseudo pairs; Supplementary Figure 2).
In contrast, the sag potential and Ih–current amplitude recorded simultaneously from mitral cells belonging to the same glomerular network was virtually indistinguishable (Supplementary Figure 2). Thus the difference in the SPA recorded from intra-glomerular pairs was significantly smaller than that determined for “intra-glomerular” pseudo pairs (recorded SPA difference: min = 0 mV, max = 3.59 mV, median = 1.22 mV, Q1, Q3 = 0.31, 2.1 mV, n = 14 pairs vs intra-glom pseudo: min = 0 mV, max = 12.75 mV, median = 4.23 mV, Q1, Q3 = 1.99 and 6.41 mV, n = 364 pairs; p = 2 × 10⁻⁵; Figure 1e,f; Supplementary Figure 2), inter-glomerular recorded pairs (p = 2.4 × 10⁻³; Figure 1f,g) and pseudo-pairs extracted from all cells (n = 105 cells; p = 1 × 10⁻⁵; Figure 1f, Supplementary Figure 2). The broad range of sag and Ih–current amplitudes recorded across the bulb is therefore not representative of the diversity found within individual glomerular circuits where it is a homotypic feature of the local mitral cell network (Figure 1g).
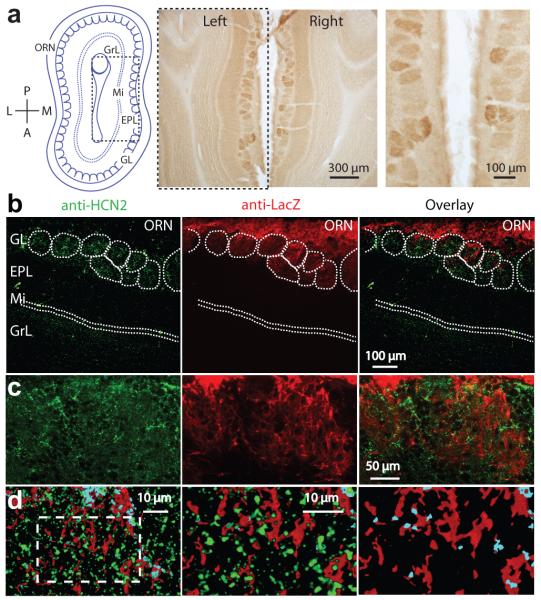
Cell-attached experiments in mitral cells indicate that the Ih current is largest in patches recorded in the very distal apical dendrite6. Thus, the recorded membrane sag may reflect activation of HCN channels that are expressed predominantly in the dendritic tuft, the site of sensory integration within the glomerulus. To explore this possibility, we performed immunohistochemical staining for the HCN2 subunit that can form both homomeric, or heteromeric HCN channels known to mediate the slow Ih23 underlying mitral cell sag6. Qualitatively, very little HCN2 protein was observed in the granule cell and mitral cell layers24. In contrast to the external plexiform layer where HCN2 expression was low but homogeneous24 we observed a high-contrast mosaic staining pattern across the glomerular layer (Figure 2a). To determine whether HCN2 expression within the glomerulus was postsynaptic to olfactory receptor neuron input we next utilized a transgenic mouse line that expresses tau-LacZ in the sensory afferents under the olfactory marker protein (OMP) promoter (OMP-IRES-tau-LacZ)7. Double staining experiments against both Lac-Z and HCN2 revealed that the HCN2 protein is predominantly expressed within dendritic compartments downstream of the olfactory receptor input (Figure 2b,c,d)25. Irrespective of the potential contribution of other cell types24,26, this mosaic pattern of HCN2 expression is consistent with the observation of large Ih currents in the distal apical dendrite and the broad range of sag amplitudes recorded in mitral cells participating in different glomerular networks.
Figure 2. Glomerular expression of HCN2 in wild-type and OMP-IRES-tau-LacZ- expressing mice.
a) Left: Schematic of a horizontal section of olfactory bulb highlighting its anatomical organization (olfactory receptor nerve (ORN) layer, glomerular layer (GL), mitral cell layer (Mi), external plexiform layer (EPL), granule cell layer (GrL)). Middle, right, HCN2-DAB staining highlighting glomerular diversity. b) Anti-HCN2 and anti-β-galactosidase staining in OMP-IRES-tau-LacZ-expressing mice. Right: Overlay of green and red channels. c) High magnification images of the glomerular layer. Colors as in b. d) Left: Higher magnification images scanned as 30 digital sections represented as a pseudo 3D image of an approximately 6 μm thick section. Areas of overlap between green and red shown as light blue and indicate close proximity of the HCN2 and OMP-LacZ signals (middle and right panels are zoomed images of hashed area shown on left). Right panel: green removed for clarity.
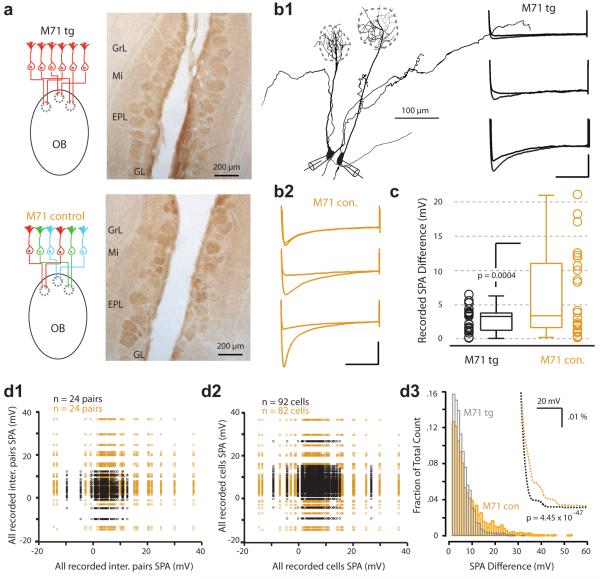
Such glomerular-based SPA and HCN2 expression might reflect network-related homeostatic regulation27,28 of excitability whereby glomerular differences arise from the processing of functionally and genetically unique subsets of olfactory input20. To test this hypothesis we next performed experiments in a transgenic “monoclonal nose” mouse that expresses the M71 odorant receptor in more than 95% of receptor neurons7 (M71tg, Figure 3a). We calculated mean pixel intensities of glomeruli in HCN2-DAB-stained M71tg and control animals that revealed significantly different variances (p = 0.001) whereby the dispersion in the M71tg was less than for control mice (p = 2.5 × 10⁻⁴; Supplementary Figure 3). Simultaneous recordings from inter-glomerular pairs of mitral cells in M71tg mice (min = 0.08 mV, max = 6.3 mV, median = 3.3 mV, Q1 and Q3 = 1.32 mV and 3.78 mV; n = 24, Figure 3b1) also revealed a significantly narrower distribution of SPA difference compared to wild-type and control mice (min = 0.23 mV, max = 21.04 mV, median = 3.4 mV, Q1 and Q3 = 1.78 mV and 10.78 mV, n = 24; p = 0.004; Figure 3b1,b2,c). This reduction in sag amplitude diversity was also striking for pseudo pair comparisons determined for all recorded pairs (Figure 3d1) and the overall population data set (M71tg: min = 0 mV, max = 36.01 mV, median = 3.4 mV, Q1 and Q3 = 1.6 and 6.1 mV, n = 91 cells, 4095 comparisons vs M71 control: min = 0 mV, max = 51.4 mV, median = 4.6 mV, Q1 and Q3 = 2 and 10.19 mV respectively, n = 81 cells, 3321 comparisons; p = 4.45 × 10−47; Figure 3d2,d3). Thus, mitral cells and glomeruli in M71tg mice are more homogeneous in their sag and HCN2 expression profile than those in wild-type and M71 control mice receiving the normally diverse array of sensory afferent input.
Figure 3. Glomerular expression of HCN2 and mitral cell sag in M71 monoclonal mice.
a) Schematic (left) showing that, in the M71tg mouse line, sensory afferents to all glomeruli express the same M71 receptor. On the right, HCN2-DAB stain in horizontal slices from a M71tg mouse. b1) Example morphologies of two simultaneously recorded mitral cells belonging to distinctly different glomeruli (inter-glom pair) in the M71 transgenic. The voltage traces show the sag potential recorded in three different example pairs in M71tg (b1) and control mice (b2). Scale bar is 10 mV, 500 ms. c) Box plot of the SPA difference for inter-glomerular recorded pairs from M71tg (black) and control mice (orange). Scatterplots of SPA for pseudo pairs extracted from paired inter-glomerular recordings in the M71tg (d1) and control (d2) mice. d3) Histogram of SPA differences for pseudo-pairs extracted from all cells recorded in the M71tg (n = 91 cells, 4095 comparisons) and control mice (n = 81 cells, 3321 comparisons; bin size = 1 mV). Inset: Overlay of histogram spline fits highlight the disparity between the distributions.
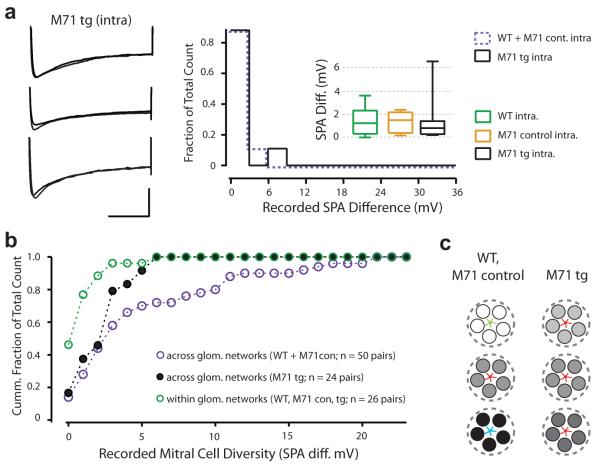
Despite the overall reduction in SPA variance in the M71tg, SPA in the intra-glomerular pairs remained more similar (M71tg intra-glom: min = 0.2 mV, max = 6.5 mV, median = 0.8 mV, Q1 and Q3 = 0.3 mV and 1.26 mV; n = 9, vs M71tg inter-glom p = 0.04; Figure 3c, 4a). Indeed, we observed no effect of wholesale expression of the M71 receptor on intra-glomerular sag diversity (M71tg vs. control and wild-type mice; p = 0.61 and 0.46 respectively; Figure 4a). Thus, sensory afferent input seems unlikely to be the sole driver of inter-glomerular diversity (Figure 4b).
Figure 4. Population diversity reflects local network membership and sensory processing.
a) Left: Example membrane voltage traces showing the sag potential recorded in three different intra-glomerular pairs recorded in the M71 transgenic mouse (scale bar is 500 ms and 10 mV). Right: histogram of the SPA difference recorded for intra-glomerular pairs in mice expressing the M71 transgene (n = 9 pairs; black filled line) versus M71 control and wild-type (pooled: n = 17 pairs; purple dashed line). Inset: Box plot of SPA difference for intra-glomerular pairs recorded in wild-type (n = 14), M71 control (n = 3) and transgenic (n = 9) mice. b) Summary data plotted as a cumulative histogram of SPA difference of all recorded pairs. c) Schematic highlighting the relationship between glomerulus affiliation, sensory input and mitral cell sag diversity (represented by white, grey or black filled circles for wild-type and M71 control mice versus M71tg mice (shades of gray)).
Using the hyperpolarization-evoked sag potential as a general proxy, we have identified several organizing principles regarding the population diversity of Ih expression in mitral cells6,29. Firstly, this intrinsic property is a biophysical signature of local constellations of neurons forming a functionally discrete olfactory network (Figure 4c). Since mitral cells are electrically and exclusively coupled to their intra-glomerular counterparts, co-regulation of the Ih channel and current may contribute to their biophysical similarity9. Secondly, analysis of the M71tg mouse directly shows that this network affiliation based signature depends on sensory information processing. The fact that in the M71tg mouse intra-glomerular sag diversity remained more homogeneous than the overall population also suggests that other factors such as feed-forward and lateral inhibition may contribute to sag regulation at the level of the glomerulus. From a functional perspective, mitral cell F-I curves are known to shift left, from a sigmoid toward a linear operation with increasing sag6. We suggest that the glomerular basis of this delineation may reflect a network-based gain control mechanism and result in correlated output patterning at the level of mitral cell networks30. Irrespective of the cellular mechanisms underlying the regulation of this phenomenon, the glomerulus-based diversity in expression of this intrinsic property appears a fundamental feature of the organisation and function of these olfactory circuits.
Supplementary Material
METHODS SUMMARY.
Whole-cell recordings using standard intracellular and extracellular solution were performed in horizontal olfactory bulb slices (300 μm thick) prepared from wild-type C57Bl/6J and M71 transgenic or control littermate mice aged 4–6 weeks. The Ih current and Ih –mediated sag potential has recently been extensively characterized for mitral cells6 and the details of the experimental and analytical procedures are provided in the Supplementary Information.
Acknowledgments
We thank Mateo Velez-Fort for comments on the manuscript. This project was supported by the Oticon Foundation, The Danish Council for Independent Research and The Lundbeckfondation (KA), the Gulbenkian PhD Programme and Fundação para a Ciência e Tecnologia (DP), The Wellcome Trust (ER and TWM) and Medical Research Council MC_U1175975156 (BP and TWM).
Footnotes
Author Information: The authors declare that there are no competing financial interests.
References
- 1.Gupta A, Wang Y, Markram H. Organizing principles for a diversity of GABAergic interneurons and synapses in the neocortex. Science. 2000;287:273–278. doi: 10.1126/science.287.5451.273. [DOI] [PubMed] [Google Scholar]
- 2.Brochtrup A, Hummel T. Olfactory map formation in the Drosophila brain: genetic specificity and neuronal variability. Curr Opin Neurobiol. 2011;21:85–92. doi: 10.1016/j.conb.2010.11.001. [DOI] [PubMed] [Google Scholar]
- 3.Reyes A, et al. Target-cell specific facilitation and depression in neocortical networks. Nature Neuroscience. 1998;1:279–285. doi: 10.1038/1092. [DOI] [PubMed] [Google Scholar]
- 4.Jinno S, et al. Neuronal diversity in GABAergic long-range projections from the hippocampus. J Neurosci. 2007;27:8790–8804. doi: 10.1523/JNEUROSCI.1847-07.2007. [DOI] [PMC free article] [PubMed] [Google Scholar]
- 5.Brown SP, Hestrin S. Intracortical circuits of pyramidal neurons reflect their long-range axonal targets. Nature. 2009;457:1133–1136. doi: 10.1038/nature07658. [DOI] [PMC free article] [PubMed] [Google Scholar]
- 6.Angelo K, Margrie TW. Population diversity and function of hyperpolarization-activated current in olfactory bulb mitral cells. Scientific Reports. 2011;1 doi: 10.1038/srep00050. doi:10.1038/srep00050. [DOI] [PMC free article] [PubMed] [Google Scholar]
- 7.Fleischmann A, et al. Mice with a “monoclonal nose”: perturbations in an olfactory map impair odor discrimination. Neuron. 2008;60:1068–1081. doi: 10.1016/j.neuron.2008.10.046. [DOI] [PMC free article] [PubMed] [Google Scholar]
- 8.Tsiola A, Hamzei-Sichani F, Peterlin Z, Yuste R. Quantitative morphologic classification of layer 5 neurons from mouse primary visual cortex. J Comp Neurol. 2003;461:415–428. doi: 10.1002/cne.10628. [DOI] [PubMed] [Google Scholar]
- 9.Schulz DJ, Goaillard JM, Marder E. Variable channel expression in identified single and electrically coupled neurons in different animals. Nat Neurosci. 2006;9:356–362. doi: 10.1038/nn1639. [DOI] [PubMed] [Google Scholar]
- 10.Ermentrout GB, Galan RF, Urban NN. Reliability, synchrony and noise. Trends Neurosci. 2008;31:428–434. doi: 10.1016/j.tins.2008.06.002. [DOI] [PMC free article] [PubMed] [Google Scholar]
- 11.Marder E, Goaillard JM. Variability, compensation and homeostasis in neuron and network function. Nat Rev Neurosci. 2006;7:563–574. doi: 10.1038/nrn1949. [DOI] [PubMed] [Google Scholar]
- 12.Magee JC. Dendritic hyperpolarization-activated currents modify the integrative properties of hippocampal CA1 pyramidal neurons. J Neurosci. 1998;18:7613–7624. doi: 10.1523/JNEUROSCI.18-19-07613.1998. [DOI] [PMC free article] [PubMed] [Google Scholar]
- 13.Garden DL, Dodson PD, O’Donnell C, White MD, Nolan MF. Tuning of synaptic integration in the medial entorhinal cortex to the organization of grid cell firing fields. Neuron. 2008;60:875–889. doi: 10.1016/j.neuron.2008.10.044. [DOI] [PubMed] [Google Scholar]
- 14.George MS, Abbott LF, Siegelbaum SA. HCN hyperpolarization-activated cation channels inhibit EPSPs by interactions with M-type K(+) channels. Nat Neurosci. 2009;12:577–584. doi: 10.1038/nn.2307. [DOI] [PMC free article] [PubMed] [Google Scholar]
- 15.Nolan MF, Dudman JT, Dodson PD, Santoro B. HCN1 channels control resting and active integrative properties of stellate cells from layer II of the entorhinal cortex. J Neurosci. 2007;27:12440–12451. doi: 10.1523/JNEUROSCI.2358-07.2007. [DOI] [PMC free article] [PubMed] [Google Scholar]
- 16.Luthi A, McCormick DA. Periodicity of thalamic synchronized oscillations: the role of Ca2+-mediated upregulation of Ih. Neuron. 1998;20:553–563. doi: 10.1016/s0896-6273(00)80994-0. [DOI] [PubMed] [Google Scholar]
- 17.Giocomo LM, Zilli EA, Fransen E, Hasselmo ME. Temporal frequency of subthreshold oscillations scales with entorhinal grid cell field spacing. Science. 2007;315:1719–1722. doi: 10.1126/science.1139207. [DOI] [PMC free article] [PubMed] [Google Scholar]
- 18.Migliore M, Shepherd GM. Emerging rules for the distributions of active dendritic conductances. Nat Rev Neurosci. 2002;3:362–370. doi: 10.1038/nrn810. [DOI] [PubMed] [Google Scholar]
- 19.Woolsey TA, Van der Loos H. The structural organization of layer IV in the somatosensory region (SI) of mouse cerebral cortex. The description of a cortical field composed of discrete cytoarchitectonic units. Brain Res. 1970;17:205–242. doi: 10.1016/0006-8993(70)90079-x. [DOI] [PubMed] [Google Scholar]
- 20.Mombaerts P. Targeting olfaction. Current Opinion in Neurobiology. 1996;6:481–486. doi: 10.1016/s0959-4388(96)80053-5. [DOI] [PubMed] [Google Scholar]
- 21.Schoppa NE, Westbrook GL. Glomerulus-specific synchronization of mitral cells in the olfactory bulb. Neuron. 2001;31:639–651. doi: 10.1016/s0896-6273(01)00389-0. [DOI] [PubMed] [Google Scholar]
- 22.Pimentel DO, Margrie TW. Glutamatergic transmission and plasticity between olfactory bulb mitral cells. J Physiol. 2008;586:2107–2119. doi: 10.1113/jphysiol.2007.149575. [DOI] [PMC free article] [PubMed] [Google Scholar]
- 23.Robinson RB, Siegelbaum SA. Hyperpolarization-activated cation currents: from molecules to physiological function. Annu Rev Physiol. 2003;65:453–480. doi: 10.1146/annurev.physiol.65.092101.142734. [DOI] [PubMed] [Google Scholar]
- 24.Notomi T, Shigemoto R. Immunohistochemical localization of Ih channel subunits, HCN1-4, in the rat brain. J Comp Neurol. 2004;471:241–276. doi: 10.1002/cne.11039. [DOI] [PubMed] [Google Scholar]
- 25.Santoro B, et al. Molecular and functional heterogeneity of hyperpolarization-activated pacemaker channels in the mouse CNS. J Neurosci. 2000;20:5264–5275. doi: 10.1523/JNEUROSCI.20-14-05264.2000. [DOI] [PMC free article] [PubMed] [Google Scholar]
- 26.Cadetti L, Belluzzi O. Hyperpolarisation-activated current in glomerular cells of the rat olfactory bulb. Neuroreport. 2001;12:3117–3120. doi: 10.1097/00001756-200110080-00027. [DOI] [PubMed] [Google Scholar]
- 27.van Welie I, van Hooft JA, Wadman WJ. Homeostatic scaling of neuronal excitability by synaptic modulation of somatic hyperpolarization-activated Ih channels. Proc Natl Acad Sci U S A. 2004;101:5123–5128. doi: 10.1073/pnas.0307711101. [DOI] [PMC free article] [PubMed] [Google Scholar]
- 28.Desai NS, Rutherford LC, Turrigiano GG. Plasticity in the intrinsic excitability of cortical pyramidal neurons. Nat Neurosci. 1999;2:515–520. doi: 10.1038/9165. [DOI] [PubMed] [Google Scholar]
- 29.Padmanabhan K, Urban NN. Intrinsic biophysical diversity decorrelates neuronal firing while increasing information content. Nat Neurosci. 2010;13:1276–1282. doi: 10.1038/nn.2630. [DOI] [PMC free article] [PubMed] [Google Scholar]
- 30.Dhawale AK, Hagiwara A, Bhalla US, Murthy VN, Albeanu DF. Non-redundant odor coding by sister mitral cells revealed by light addressable glomeruli in the mouse. Nat Neurosci. 2010;13:1404–1412. doi: 10.1038/nn.2673. [DOI] [PMC free article] [PubMed] [Google Scholar]
Associated Data
This section collects any data citations, data availability statements, or supplementary materials included in this article.


