

Abstract
We conducted a randomized controlled trial among African-American patients attending a primary-care provider visit to compare efficacy of a computer-delivered tailored intervention to increase colorectal cancer (CRC) screening (n = 273) with non-tailored print material—an American Cancer Society brochure on CRC screening (n = 283). Health Belief Model constructs were used to develop tailored messages and examined as outcomes. Analysis of covariance models were used to compare changes between CRC knowledge and health belief scores at baseline and 1 week post-intervention. At 1 week, patients who received the computer-delivered tailored intervention had greater changes in CRC knowledge scores (P < 0.001), perceived CRC risk scores (P = 0.005), FOBT barriers scores (P = 0.034) and colonoscopy benefit scores (P < 0.001). Findings show that computer-delivered tailored interventions are an effective adjunct to the clinical encounter that can improve knowledge and health beliefs about CRC screening, necessary precursors to behavior change.
Introduction
Colorectal cancer (CRC) is the second leading cause of cancer death in the United States among both men and women [1]. The 5-year survival when CRC is diagnosed at a localized stage is 91% but only 40% if diagnosed at an early stage [2]. More than half of CRC deaths could be prevented through screening, but participation rates remain low at 62% [3,4]. Current guidelines recommend that screening begin at age 50 years with one of six test options, each with a different testing schedule. Screening test options for people with no risk factors other than age include fecal occult blood or immunochemical testing (FOBT/FIT), stool DNA testing, flexible sigmoidoscopy, colonoscopy, air contrast barium enema or computed tomographic (CT) colonography, also called virtual colonoscopy [5]. Persons at increased risk due to family history should begin screening with colonoscopy at a younger age using individualized screening intervals [5].
CRC disparities in African-Americans
African-Americans are disproportionately affected by CRC, with the highest incidence and mortality rates of any racial/ethnic group [6] and higher rates of late-stage cancers [4]. These disparities have been attributed to lower screening rates, less use of diagnostic tests following an abnormal screen, limited access to health care and unique biological features in tumors of African-Americans [7]. Lack of knowledge about test options, importance of screening in the absence of symptoms and curability of CRC when detected early are among the many barriers to CRC screening [2]. Other barriers include lack of time, inconvenience, lack of interest, cost, fear of positive findings, embarrassment and fatalistic beliefs about cancer [2,8]. Having received a recommendation from a healthcare provider has been consistently shown to be the most important predictor of CRC screening [9–16].
Computer-delivered tailored interventions
Computer-delivered tailored interventions have become an increasingly common approach to promote health behaviors in both healthy and chronically ill populations, but few have been implemented into routine primary care. Several reviews examining the impact of tailored interventions on health behavior change have found efficacy of tailored interventions over non-tailored ones [17–27]. Specific conclusions were that: (i) information tailored on four to five theoretical concepts was more effective than those tailoring on fewer concepts, (ii) tailoring on beliefs/attitudes, self-efficacy, stage of change, processes of change and social support was associated with largest effect sizes and (iii) careful tailoring on demographic characteristics such as age, gender and race and giving feedback on the behavior itself may enhance the effectiveness of theoretically tailored interventions [20]. A meta-analysis of 88 computer-delivered tailored interventions revealed a clinically and statistically significant effect size of g = 0.17 averaged over four health behaviors including smoking cessation, physical activity, fruit and vegetable intake and mammography [17]. No significant differences were observed by communication channel (print, computer or automated phone interventions). Finally, according to the Elaboration Likelihood Model, tailored interventions are expected to stimulate greater cognitive activity and central processing of information, which leads to more thoughtful consideration and evaluation of health messages [28,29]. Because tailored messages are customized to the individual, they are viewed as personally relevant which increases engagement and makes them more persuasive.
While studies have shown that tailored interventions are more effective than non-tailored at promoting mammography [26,30–32], evidence regarding effectiveness of tailored CRC screening interventions is limited especially among racial, ethnic, socioeconomic and geographic groups [33]. And, to our knowledge, only one other study tested the effects of a computer-delivered tailored intervention, where CRC screening messages are delivered in real time based on participants’ responses to questions posed by a computer program [34].
Purpose
Our ongoing randomized controlled trial is testing the efficacy of a computer-delivered tailored intervention to promote CRC screening among African-Americans. This theory-based intervention was designed to increase knowledge and change health beliefs in directions that would support behavior change, specifically CRC screening. The purpose of this study was to compare changes in CRC-related knowledge and health beliefs 1 week post-intervention delivery between patients who used the computer-delivered tailored intervention and those who received non-tailored print material (an American Cancer Society brochure on CRC screening). Two research questions were as follows: (i) Are there differential changes in total knowledge and health beliefs (perceived CRC risk, benefits, barriers and self-efficacy) scores between patients who received the computer-delivered tailored intervention versus those who received a non-tailored CRC screening brochure at 1 week post-intervention? and (ii) Are there differential changes in individual items on the knowledge and health belief scales between patients who received the computer-delivered tailored intervention versus those who received a non-tailored CRC screening brochure at 1 week post-intervention? All procedures were HIPPA compliant and approved by the Indiana University-Purdue University at Indianapolis Institutional Review Board prior to study implementation.
Materials and methods
Intervention descriptions
The computer-delivered tailored intervention was an enhancement of a pilot program developed by this research team. The program, titled Colon Testing: Celebrate Life for Years to Come, was housed in a portable tablet computer and delivered messages, graphics and video tailored on real-time assessment of the user’s age, gender, perceived risk for developing CRC, perceived barriers to testing and family history (e.g. those with a strong family history of CRC received recommendations only for colonoscopy whereas those without received information about the two most common test options recommended for average-risk individuals). Samples of tailored messages and visuals from the interactive program are included in the Appendix.
The computer program was created by the research team in collaboration with Eo Studios, a media design and production company in Athens, GA. This firm guided all aspects of intervention development through use of a web-based project site where documents, visuals and video and audio demonstrations were posted for viewing. Initial development focused on refining assessment questions, message libraries and computer algorithms to link messages to tailoring variables. Relevant graphics were developed including animations of polyps growing, charts illustrating changes in CRC risk and still photos. Permissions were procured to use segments from an American Cancer Society video titled Get Tested for Colon Cancer. Here’s how (#2432.00; 2005) and a public service announcement featuring actor Morgan Freeman developed by the Centers for Disease Control and Prevention [35].
Additional segments filmed included a mock colonoscopy procedure, a doctor discussing colon testing with the main character in an examination room, and a pastor—who was also a CRC survivor—telling his story and giving testimonial to the benefits of testing. To control for variations in users’ reading levels which could affect engagement, the program included voice over narration of all content. A database was designed and incorporated to electronically capture users’ responses to assessment questions posed during the intervention. On average, the program required 17 min to complete. Prior to implementation, the program was pilot tested with 21 subjects in the target population at two primary-care clinics where it received satisfaction and usability scores of >90% on most items. Cultural relevance and appropriateness of program messages were evaluated by a community advisory group comprised of eight African-American men and women.
Revisions to message wording and delivery were made based upon their input. The context for message delivery focused on a family gathering for a 50th birthday celebration. After introducing the theme and characters, program content began by providing information about CRC and screening. Colon anatomy and physiology, as well as development of CRC from polyps, were explained through narration and animations. Racial disparities in CRC incidence and mortality were highlighted in messages and graphs, tailored on gender. Based upon the user’s family history of CRC, segments explaining the two most commonly recommended test options were shown. Average-risk users watched demonstrations of both FOBT and colonoscopy and were asked to indicate which test they would be most likely to consider. Users at increased CRC risk viewed only the colonoscopy demo because this was the test recommended for them by national CRC screening guidelines [5].
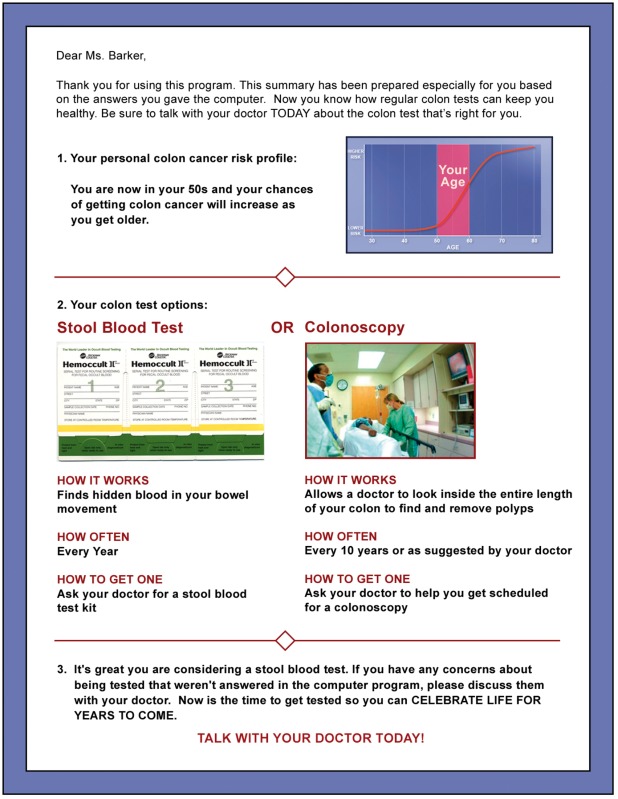
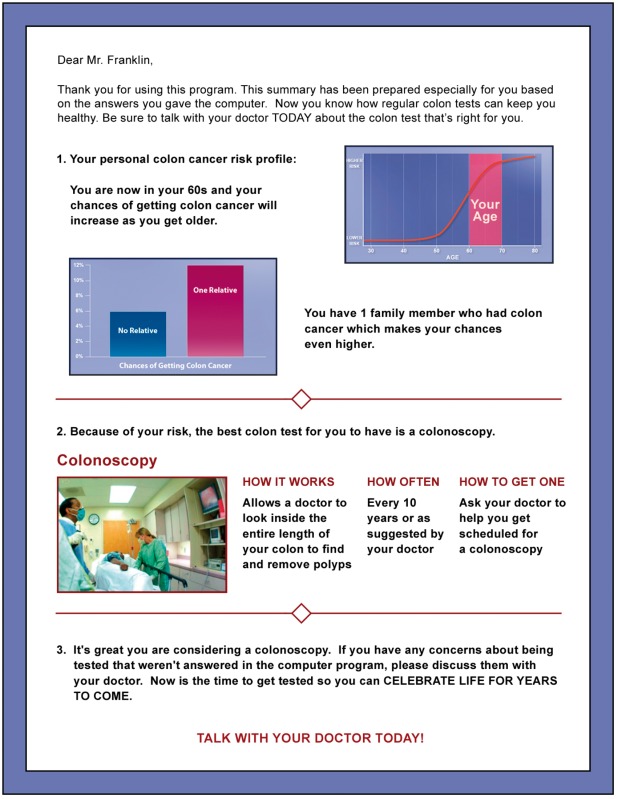
Barriers to CRC screening in general and each test specifically were assessed and then tailored messages were delivered in the program to overcome each barrier endorsed by participants. Five barriers focused on CRC screening generically (no problems with my bowels, don’t want to know if something is wrong, too many others things to do, doctor didn’t recommend, nothing you can do about getting colon cancer); six barriers were specific for either FOBT (collecting a stool sample is unpleasant, takes too much time, don’t know how to do, too much trouble, etc.) or colonoscopy (test would be embarrassing, would be painful, have to clean out my bowels, need someone to drive me home, etc). At the program’s end, a tailored, single-page colored printout was generated that imported visuals and data from the intervention and summarized the user’s personal CRC risk factors, risk-appropriate testing recommendations and, if average risk, the user’s preferred test (see sample tailored printouts in Appendix).
The comparison group received non-tailored print materials, specifically a commonly used CRC screening brochure developed by the American Cancer Society [36]. This informational brochure was written at the fourth-grade reading level and contained information about screening as a means to prevent CRC as well as encouragement to discuss testing options with their provider. This was considered an optimal ‘usual care’ condition and a consistent approach to convey a recommendation for CRC screening from the primary-care provider.
Recruitment procedures and eligibility criteria
Participants were eligible if they were 51–80 years of age, English-speaking, self-identified as African-American and currently non-adherent to CRC screening guidelines (were due for screening). Exclusion criteria were as follows: (i) personal history of CRC, (ii) FOBT in the past 12 months, sigmoidoscopy in the past 5 years or colonoscopy in the past 10 years; (iii) medical condition that prohibits CRC screening or (iv) cognitive, speech or hearing impairment.
Participants were recruited from: (i) five community-based clinics affiliated with our safety-net hospital serving African-American patients from the most medically underserved communities in Indianapolis; (ii) four primary-care clinics at the Indianapolis Veterans Affairs Medical Center (VAMC); (iii) one university-affiliated family medicine clinic in Indianapolis and (iv) one primary-care practice serving patients in medically underserved areas in central and west Louisville, Kentucky.
Participants from the five safety net hospital community clinics were recruited by experienced recruiters employed through our practice-based research implementation network. In other sites, recruiters were research staff specifically hired and trained for this study. All recruiters identified potentially eligible participants from primary-care clinic databases and obtained provider approval prior to contact. Of 178 providers, 164 (92%) granted approval to contact their potentially eligible patients. Approved patients who had an upcoming primary-care visit were mailed an introductory letter (signed by their provider), a recruitment brochure that explained the study, and a copy of the written informed consent. Within 1 week of this mailing, patients who did not call the toll-free number to opt-out received a phone call from a recruiter who assessed eligibility, explained the study and answered questions. Patients who verbally consented by phone were scheduled for baseline telephone interviews. As shown in Figure 1, our participation rate was 63%.
Fig. 1.

Participant flow.
Enrollment and intervention delivery
Trained research assistants met participants who had completed the baseline telephone interview in private areas in the clinics 30–45 min prior to their scheduled appointments to complete enrollment and deliver interventions. Written informed consent and forms granting access to medical records were reviewed and signed by participants. Those assigned to the tailored interactive computer intervention were given the tablet computer and instructed on use of the stylus to answer questions posed during the program. Head phones were provided if desired to reduce noise and distractions. Research assistants remained nearby to answer questions or provide technical assistance. When participants finished the program, research assistants connected the tablet computer to a mobile color printer to generate the tailored printout (See Appendix). The non-tailored brochure was provided to those assigned to this comparison group.
Data collection
Outcome data were collected using a computer-assisted telephone interview system at four time points by interviewers at the Indiana University Center for Survey Research. Baseline data were collected upon enrollment, before scheduled primary-care visits where the intervention was delivered. The second interview was conducted 1 week post-intervention delivery to assess changes in health beliefs and reactions to the interventions. Figure 1 shows the flow of participants through the study. We interviewed 96% of the computer-delivered tailored intervention group and 93% of the brochure group within 1 week of their clinic visit. To assess behavioral (screening) outcomes, a third interview was conducted at 6 months and a final interview at 15 months post-intervention. Data collected at baseline and 1 week post-intervention were used for this study. A companion manuscript will examine data collected at the third and fourth interviews in order to determine whether the intervention had an effect on CRC screening.
Measures
CRC knowledge was measured using 11 items developed specifically for this study. Several dimensions of CRC knowledge were assessed, including risk factors, screening test options and test frequency. Knowledge scores were computed by summing the number of correct responses, with a possible range of 0–11. This multidimensional measure had a Cronbach α coefficient of 0.63.
Perceived CRC risk (susceptibility) was assessed using two measures: a five-item scale which contained three items originally developed by Champion to measure perceived breast cancer risk [37,38] and a single-item measure of perceived age- and gender-adjusted comparative risk [39]. The five item scale used a four-point response option, where 1 = very unlikely and 4 = very likely, to assess participants’ beliefs about how likely they were to get CRC in the next 5 years, in the next 10 years and sometime during their lifetime. Two additional items assessed likelihood of getting CRC if they did or did not have regular colon testing. Comparative risk was assessed by ‘Compared to other (men/women) your age, would you say your chance of getting colon cancer in the next ten years is…?’[39]. Response options were lower, about the same or higher than others my age. The Cronbach α for the five-item perceived risk scale was 0.79.
Perceived benefits, barriers and self-efficacy were measured for FOBT and colonoscopy separately using valid and reliable scales developed by our team [40,41]. All scales had Likert response options where 1 = strongly disagree to 4 = strongly agree. The FOBT benefits scale contained three items while the colonoscopy benefits scale had four items. In this sample, Cronbach α coefficients for FOBT benefits and colonoscopy benefits scales were 0.76 and 0.67, respectively. To assess FOBT barriers, participants were asked to indicate how much they agreed or disagreed with nine statements such as ‘You might put off doing a stool blood test because… collecting a stool sample is unpleasant, you don’t have the time or you don’t know how to do one’. Colonoscopy barriers were assessed with 15 items where participants indicated agreement or disagreement with statements such as ‘You might put off having a colonoscopy because…the cost would be a problem, it could be painful or finding someone to drive you home would be hard’. Cronbach α coefficients for the FOBT and colonoscopy barriers scales were 0.82 and 0.89, respectively. Self-efficacy for CRC screening was measured for FOBT (eight items) and colonoscopy (11 items) independently by asking participants to indicate how sure they were that they could take the steps necessary to complete the test. The Cronbach α coefficient for both self-efficacy scales was 0.87.
Data analysis
Baseline (T1) demographics were summarized and compared between computer and brochure groups. Age, years of education and number of healthcare provider visits in the last 12 months were compared using t-tests. Gender, marital status, employment status, health insurance status and income level were compared using χ2 tests. Cronbach α coefficients were reported for the baseline (T1) health belief and knowledge scales. For knowledge, where the items are dichotomous, Cronbach’s α is equivalent to that of the Kuder–Richardson 20 measure of reliability. We used analysis of covariance (ANCOVA) models to examine the effect of treatment (computer versus brochure) on the change in health beliefs and knowledge from T1 to T2 controlling for T1 health belief or knowledge and T1 demographic variables, i.e. gender, married status, health insurance status, employment status, household income, years of education and number of doctor visit in last 12 months. We examined treatment effects on individual health belief scale items similarly using ANCOVA. For the comparative risk question (dichotomized to ‘higher or the same’ perceived risk versus ‘lower’ risk) and knowledge items, we ran logistic regressions controlling for baseline values and demographics. Hochberg’s [42] step-up Bonferroni method was used to adjust for multiple tests performed for each item within a scale. All analyses were performed using SAS (Version 9.2, Copyright ©2008 SAS Institute Inc., Cary, NC, USA).
Results
Baseline demographics of the sample are summarized in Table I. Mean age was 57.7 years, average education was 12.3 years and number of healthcare provider visits in the last 12 months was 6.7. Half were males, 32% were currently married or living with a partner, 22% were employed full- or part-time, 80% had some kind of healthcare insurance and 58% had yearly household incomes below $15 000. There were no significant differences in demographics between the computer-delivered tailored group and the non-tailored brochure group.
Question 1: Are there differential changes in knowledge and health beliefs between patients who received the computer-delivered tailored intervention and those who received the non-tailored CRC screening brochure?
Table I.
Sample demographics at baseline
| Computer group (n = 273) | Brochure group (n = 283) | ||
|---|---|---|---|
| Mean (SD) | Variable | Mean (SD) | P |
| Age | 57.3 (6.1) | 58.1 (6.4) | 0.147 |
| Years of education | 12.2 (1.8) | 12.4 (2.0) | 0.379 |
| Number of healthcare provider visits in last 12 months | 6.9 (8.7) | 6.6 (8.7) | 0.626 |
| n (%) | n (%) | P | |
| Gender | |||
| Male | 141 (52) | 139 (49) | 0.551 |
| Female | 132 (48) | 144 (51) | |
| Married/partnered | |||
| Yes | 86 (31) | 91 (32) | 0.846 |
| No | 187 (69) | 191 (68) | |
| Employed | |||
| Yes | 61 (22) | 60 (21) | 0.744 |
| No | 212 (78) | 223 (79) | |
| Insurance | |||
| Yes | 218 (80) | 224 (79) | 0.902 |
| No | 55 (20) | 58 (21) | |
| Income | |||
| <$15 000 | 159 (60) | 147 (55) | 0.331 |
| $15 000–30 000 | 72 (28) | 89 (33) | |
| >$30 000 | 32 (12) | 33 (12) |
Treatment effects on changes from baseline to 1 week post-intervention on belief scales and the knowledge scale, controlling for baseline demographics, are summarized in Table II. Compared with the brochure group, the computer group had a greater increase in perceived risk scores (P = 0.045), a greater decrease in FOBT barrier scores (P = 0.034), a greater increase in colonoscopy benefit scores (P < 0.001) and a greater increase in knowledge scores (P < 0.001). Those reporting perceived CRC risk as ‘higher’ or ‘about the same’ as other people did not differ between groups at baseline (74% of computer group, 73% of brochure group) but at T2, a greater proportion of the computer group perceived their CRC risk to be at least the same as others (81% versus 70%, respectively; adjusted OR = 1.9, 95% CI = 1.2, 3.0; P = 004).
Research Question 2: Are there differential changes in individual items on the knowledge and health belief scales between patients who received the computer-delivered tailored intervention versus those who received a non-tailored CRC screening brochure at 1 week post-intervention?
Table II.
Health belief and knowledge scale means and change scores from baseline to 1 week post-intervention by group (n = 273 in computer group and n = 283 in brochure group)
| Scale | Group | T1, mean (SD) | T2, mean (SD) | Estimateda mean change | Ta | Pa |
|---|---|---|---|---|---|---|
| Perceived risk | Computer | 2.40 (0.66) | 2.50 (0.63) | 0.13 | 2.01 | 0.045 |
| Brochure | 2.38 (0.73) | 2.42 (0.72) | 0.03 | |||
| FOBT benefits | Computer | 3.49 (0.59) | 3.55 (0.62) | 0.07 | 1.06 | 0.290 |
| Brochure | 3.47 (0.62) | 3.47 (0.66) | 0.02 | |||
| FOBT barriers | Computer | 2.33 (0.73) | 2.10 (0.80) | −0.21 | −2.13 | 0.034 |
| Brochure | 2.20 (0.73) | 2.13 (0.79) | −0.10 | |||
| FOBT self-efficacy | Computer | 3.63 (0.51) | 3.76 (0.46) | 0.14 | 1.83 | 0.067 |
| Brochure | 3.63 (0.56) | 3.72 (0.50) | 0.08 | |||
| COL benefits | Computer | 3.40 (0.63) | 3.56 (0.58) | 0.16 | 4.81 | <0.001 |
| Brochure | 3.42 (0.64) | 3.36 (0.68) | −0.06 | |||
| COL barriers | Computer | 2.26 (0.73) | 2.08 (0.80) | −0.16 | −0.89 | 0.373 |
| Brochure | 2.22 (0.74) | 2.12 (0.78) | −0.11 | |||
| COL self-efficacy | Computer | 3.45 (0.53) | 3.59 (0.49) | 0.15 | 1.08 | 0.279 |
| Brochure | 3.44 (0.61) | 3.56 (0.53) | 0.11 | |||
| Knowledge | Computer | 3.86 (2.34) | 6.38 (2.64) | 2.59 | 12.20 | <0.001 |
| Brochure | 3.70 (2.29) | 4.30 (2.42) | 0.59 |
aEstimated mean change, T-statistics and P-value from ANCOVA model controlling for T1 outcome and demographic variables. FOBT = fecal occult blood test, COL = colonoscopy.
Tables III–V display descriptive statistics and statistical tests for all scale items having unadjusted P-values ≤ 0.05. Of the five items on the perceived risk scale (Table III), significant differences in mean change scores were seen for two; patients in the computer group had higher perceived likelihood of getting colon cancer sometime in their lifetime (adjusted P = 0.015) and getting colon cancer in the next 10 years (adjusted P = 0.040).
Table III.
Changes in individual perceived risk scale item means from health belief scales from baseline to 1 week post-intervention by group (n = 273 in computer group and n = 283 in brochure group)
| Scale item | Group | T1, mean (SD) | T2, mean (SD) | Estimateda mean change | Ta | Adjusted Pa |
|---|---|---|---|---|---|---|
| How likely is it that you will get CRC sometime in your lifetime? | Computer | 2.37 (0.94) | 2.69 (0.82) | 0.31 | 3.69 | 0.015 |
| Brochure | 2.42 (0.96) | 2.46 (0.88) | 0.06 | |||
| How likely is it that you will get CRC in the next 10 years? | Computer | 2.37 (0.88) | 2.58 (0.87) | 0.23 | 2.58 | 0.040 |
| Brochure | 2.33 (0.94) | 2.40 (0.91) | 0.05 |
aEstimated mean change, T-statistics and P-value (adjusted for multiple testing) from ANCOVA model controlling for T1 outcome and demographic variables.
Table IV.
Changes in colonoscopy scale item means from health belief scales from baseline to 1 week post-intervention by group (n = 273 in computer group and n = 283 in brochure group)
| Scale item | Group | T1, mean (SD) | T2, mean (SD) | Estimateda mean change | Ta | Adjusted Pa |
|---|---|---|---|---|---|---|
| Benefit: Having a COL will help you avoid getting CRC. | Compute | 3.03 (1.15) | 3.31 (1.05) | 0.27 | 4.49 | <0.001 |
| Brochure | 3.15 (1.13) | 3.00 (1.17) | −0.13 | |||
| Benefit: Having COL will lower your chances of dying from CRC. | Computer | 3.34 (0.96) | 3.56 (0.78) | 0.22 | 4.07 | <0.001 |
| Brochure | 3.37 (0.93) | 3.29 (1.02) | −0.08 | |||
| Benefit: Having COL will help you not worry as much about CRC. | Computer | 3.48 (0.80) | 3.59 (0.75) | 0.14 | 2.43 | 0.030 |
| Brochure | 3.41 (0.88) | 3.41 (0.91) | −0.02 |
aEstimated mean change, T-statistics and P-value (adjusted for multiple testing) from ANCOVA model controlling for T1 outcome and demographic variables.
Table V.
Knowledge scale item from baseline to 1 week post-intervention by group (n = 273 in computer group and n = 283 in brochure group)
| Scale Item | Group | T1, % correct answer | T2, % correct answer | Odds ratioa (computer versus brochure) | χ2a | Adjusted Pa |
|---|---|---|---|---|---|---|
| Can colon cancer ever be prevented? | Computer | 50.18 | 63.00 | 1.74 | 8.38 | 0.002 |
| Brochure | 47.00 | 50.00 | ||||
| Who is more likely to get colon cancer? (Age group) | Computer | 44.69 | 64.47 | 2.64 | 21.75 | <0.001 |
| Brochure | 40.99 | 46.10 | ||||
| Who is more likely to get colon cancer? (Race/ethnicity group) | Computer | 25.27 | 56.78 | 5.88 | 60.83 | <0.001 |
| Brochure | 31.10 | 27.66 | ||||
| Who is more likely to get colon cancer? (relative) | Computer | 24.54 | 36.63 | 1.64 | 5.45 | 0.020 |
| Brochure | 21.20 | 26.60 | ||||
| What is the chance for a woman to get colon cancer compared with men? | Computer | 24.18 | 34.07 | 1.60 | 5.40 | 0.020 |
| Brochure | 16.96 | 24.11 | ||||
| What is a small growth inside the colon that might turn into cancer called (polyp) | Computer | 32.23 | 61.54 | 2.01 | 10.31 | 0.004 |
| Brochure | 29.68 | 48.06 | ||||
| Which is the most effective way for people to lower their chances of dying from colon cancer? | Computer | 38.10 | 73.63 | 4.16 | 40.62 | <0.001 |
| Brochure | 36.40 | 48.94 | ||||
| What can be found by doing a take-home stool blood test? | Computer | 53.48 | 80.95 | 2.80 | 20.07 | <0.001 |
| Brochure | 53.00 | 63.12 | ||||
| If you choose to have a stool blood test and everything is normal, when will you need to have your next one? | Computer | 41.39 | 47.62 | 1.60 | 6.34 | 0.020 |
| Brochure | 40.99 | 37.59 | ||||
| What is a doctor able to see during a colonoscopy? | Computer | 46.52 | 72.53 | 3.57 | 32.63 | <0.001 |
| Brochure | 46.29 | 51.06 | ||||
| If you choose to have a colonoscopy and everything is normal, when will you probably need to have your next one? | Computer | 5.13 | 46.52 | 15.60 | 79.58 | <0.001 |
| Brochure | 6.01 | 7.09 | ||||
aOdds ratio, χ2-statistics and P-value (adjusted for multiple testing) from logistic model controlling for T1 outcome and demographic variables.
After adjusting for multiple comparisons, none of the individual item means on the FOBT benefits (three items), FOBT barriers (nine items) or FOBT self-efficacy (eight items) scales differed between the two groups. For items on the colonoscopy benefits (four items), colonoscopy barriers (15 items) and colonoscopy self-efficacy (11 items) scales, mean scores for three benefit items were significantly different between groups (Table IV). Patients in the computer group were more likely to agree that having a colonoscopy will help them avoid getting colon cancer (adjusted P < 0.001), will lower their chance of dying from colon cancer (adjusted P = <0.001) and will help them not worry as much about colon cancer (adjusted P = 0.030). For the knowledge scale (Table V), patients from the computer group had significantly higher percentages of correct responses on all 11 items compared with the brochure group (adjusted P-values ≤ 0.02).
Discussion
Our computer-delivered tailored intervention improved CRC knowledge and changed health beliefs about CRC screening in directions consistent with behavior change. African-American patients who were attending a scheduled primary-care visit and used the computer-delivered tailored intervention had significantly greater increases in scale scores for perceived CRC risk, perceived benefits of colonoscopy and CRC knowledge at 1 week post-intervention. In addition, the tailored intervention group showed a greater reduction in scale scores for FOBT barriers compared with those who received the non-tailored CRC brochure.
Most health behavior theories hypothesize that perceived risk/susceptibility/vulnerability to a disease or condition is a necessary motivational precursor to preventive health behavior change [43–45]. Several studies have demonstrated that perceived risk is associated with CRC screening [46–48]. 1 week after receipt, participants who used the computer-delivered tailored intervention had higher mean scores on several items assessing their perceptions of risk for, or susceptibility to, CRC.
To identify specific changes in knowledge and health beliefs, we also compared individual items on all scales between groups. Those in the tailored intervention group had greater increases in mean scores on two perceived risk items assessing their likelihood of getting CRC: (i) sometime in their lifetime and (ii) in the next 10 years. This is an important intervention effect since many African-Americans believe their CRC risk to be low [49–51].
Gerrard and colleagues suggested it may be essential to assess risk perceptions using a ‘conditional’ risk question, i.e. one that is contingent upon the performance of the behavior [52]. In this study, we added two conditional risk items to assess perceived chances of getting CRC if the participant: (i) got regular colon tests or (ii) did not get regular colon tests. We observed greater reductions in the tailored intervention group, trending toward significance, on one item—perceiving they would be less likely to get CRC if they had regular colon testing (adjusted P = 0.051). The tailored intervention raised participants’ perceptions of their personal risk for CRC and enhanced beliefs that regular colon testing would reduce risk.
Significant increases in both overall colonoscopy benefit scores and several individual colonoscopy benefit items were observed in the computer group. Patients in this group had greater increases in post-intervention mean scores (indicating greater agreement) that colonoscopy would: (i) help them avoid CRC, (ii) lower their chance of dying from CRC and (iii) help them not worry as much about CRC. While we did not assess perceived benefits to deliver tailored messages, our tailored intervention delivered clear messages about the preventability of CRC and that a colon cancer diagnosis could be avoided through the removal of polyps. These findings support the efficacy of our messages about the benefits of colonoscopy.
The Health Belief Model constructs of perceived barriers and self-efficacy have been shown to predict CRC screening behavior [41,46,47,53,54] and our computer-delivered tailored intervention included messages to overcome or reduce barriers and increase self-efficacy. The tailored group had a greater decrease in FOBT barriers at post-intervention than the brochure group (P = 0.034). Although barriers to colonoscopy were reduced for both groups, the difference in change scores between groups on colonoscopy barriers was not significant (P = 0.37). It is possible that one-time delivery of tailored messages is not strong enough to reduce barriers to colonoscopy or that these barriers are more difficult to overcome. It is also possible that both interventions led to discussions about screening during the clinic visit where colonoscopy barriers could have been addressed by providers. Studies are needed to explore real-time discussions between participants and their providers about CRC screening. Although video segments in the computer-delivered tailored intervention demonstrated the steps involved in completing FOBT and colonoscopy to increase self-efficacy, there were no significant between-group differences in self-efficacy change scores (they increased somewhat in both groups). These participants, who had relatively low levels of knowledge about CRC and screening, may need more than a single exposure to audio and video messages about these unfamiliar screening tests to see significant increases in self-efficacy.
Awareness of CRC and screening tests has increased over the past 20 years, yet lack of knowledge remains a major barrier to increasing participation, especially among African-Americans [49,55–57]. As a necessary first step to behavior change, the computer-delivered tailored intervention was developed to educate patients about the preventability of CRC, associated risk factors, development of CRC from polyps and screening test options. Our results indicated that the computer-delivered tailored intervention resulted in differential improvement in knowledge. This is important; Maxwell and colleagues reported that increasing knowledge of CRC screening mediated screening behavior and accounted for 13% of their intervention effect [58]. While knowledge is necessary but not sufficient for behavior change to occur, interventions that increase awareness of CRC, screening tests and preventability of CRC are an essential first step.
Few studies have examined changes in CRC-related health beliefs resulting from intervention. These findings contribute to the growing evidence on the effectiveness of computer-delivered tailored interventions to modify these important predictors of screening. Although the mechanisms by which the computer-delivered tailored intervention caused the observed changes are not yet clear, tailored interventions have two primary goals, to: (i) maximize the perceived salience or ‘fit’ of the information to the user and (ii) favorably influence mutable psychological characteristics that mediate health behavior, such as health beliefs [59]. Jerant et al. (2010) have suggested that interactive computer-delivered tailored interventions have great potential to reduce health disparities because they help to overcome several challenges minorities face, including limited health literacy, patient–provider communication barriers and the irrelevance of standard patient education materials to their unique perspectives and needs.
Computer-delivered tailored interventions that educate primary-care patients about CRC, assess individual risk factors and deliver tailored messages about risk-appropriate testing, and strategies to overcome barriers to testing have great potential to change health beliefs needed to move patients forward in their readiness to screen. Strengths of this randomized trial include its large sample size, high participation and low attrition rates and use of multiple primary-care recruitment sites. Participants were relatively young, with an average age of 58 years, representing the age group with the lowest CRC screening rates. Changing health beliefs about CRC screening among people in this age group has potential to make the greatest impact in increasing screening participation, thereby reducing CRC incidence and mortality.
Limitations include the potential for selection bias since patients who agreed to enroll may be more interested in CRC and screening. In addition, results may only be generalizable to similar populations of low-income African-American patients who have access to primary-care and CRC screening. Study settings were chosen specifically because the majority of patients were covered by some type of health insurance which provided access to CRC screening at low or no cost. Removing lack of insurance as a barrier to CRC screening may have influenced our results and limited their generalizability to the uninsured. However, there are similar safety net healthcare systems across the country in which we need to learn how to effectively facilitate participation in screening. While the computer-delivered tailored intervention produced significant changes in the desired directions, future analyses will determine if these changes in knowledge and health beliefs actually translate to CRC screening behavior.
Funding
This work was supported by the National Cancer Institute at the National Institutes of Health [R01 CA115983-01].
Conflict of interest statement
None declared.
Acknowledgements
The authors gratefully acknowledge our participants for their willingness to engage in this study. They also acknowledge the support of our collaborating healthcare providers and sincerely thank Dr Phyllis Dexter for her careful review and Denise Baker for her support during preparation of this article.
Appendix. Sample tailored messages and graphics in intervention
| Tailoring variable | Sample message | Graphics/Video |
|---|---|---|
| Intro | Mr Robert Gibson celebrates his 50th birthday today with his family and friends. Robert’s in good health—he watches what he eats, stays active and takes his blood pressure medicine. But there’s something else he’ll need to start doing to stay healthy in the years ahead. Colon testing is something everyone needs to think about when they get to be Robert’s age. | 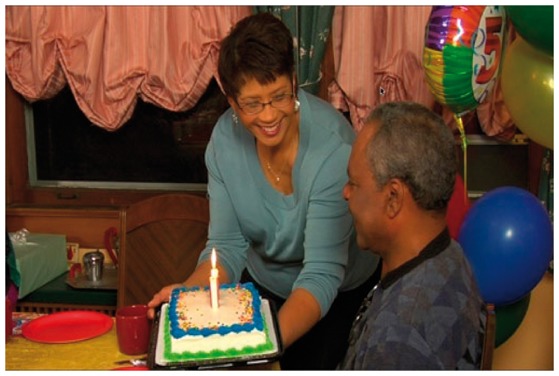 |
| Age | (IF AGE = 70–79) And remember, your chances of getting colon cancer also depend on your age. Because you are now in your 70s, your chances are higher than when you were younger. | 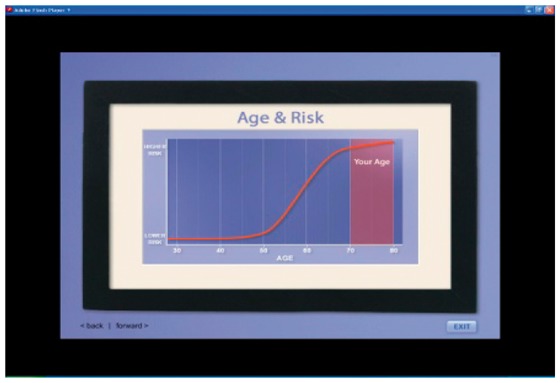 |
| Perceived risk | (IF LOW) You’re like most people who think their chances of getting colon cancer are low. For almost everyone who gets it, it’s a surprise. Most people with colon cancer will tell you they never expected to get it. | 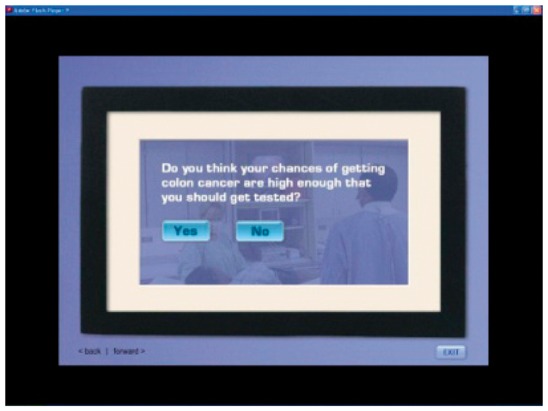 |
| Gender | (IF FEMALE) Unfortunately, African-American women are more likely than women of other races to get colon cancer and to die from it. One reason for this is because Black women are less likely to have regular colon testing. | 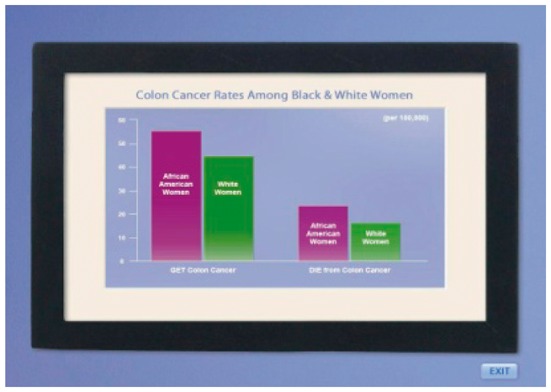 |
| Family history of colon cancer | (IF NONE) It’s good that you have no relatives with colon cancer. But, it’s important to know that most people who get colon cancer are just like you. In fact, three of every four people who get this disease have no colon cancer in their family. | 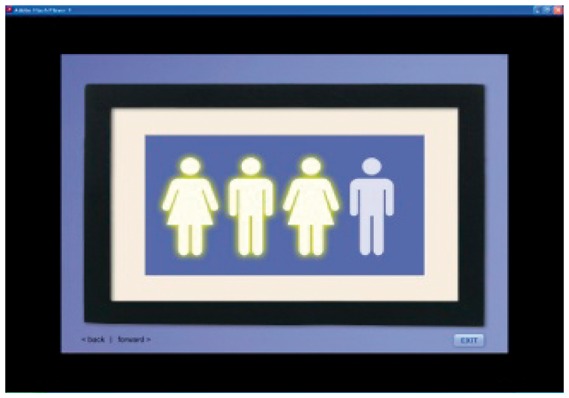 |
| (IF ONE RELATIVE AFFECTED WITH CRC) Because you have a close relative who’s had colon cancer, it’s especially important for you to get tested. This picture shows how your chances of getting colon cancer go up when someone in your family has it. | 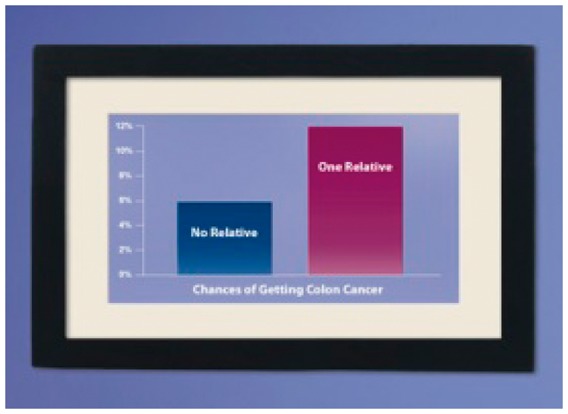 |
|
| Screening test recom-mendation linked to user’s objective CRC risk | (IF AVERAGE RISK) Stool blood test or colonoscopy? Which test should you do? That depends on what you and your doctor decide. Each has its advantages and disadvantages. The stool blood test is simple and can be done at home. You don’t have to take a laxative to clean out your colon. And, it doesn’t cost much. However, it can miss some polyps and cancers. It needs to be done faithfully every year. And, if blood is found, more tests must be run. | 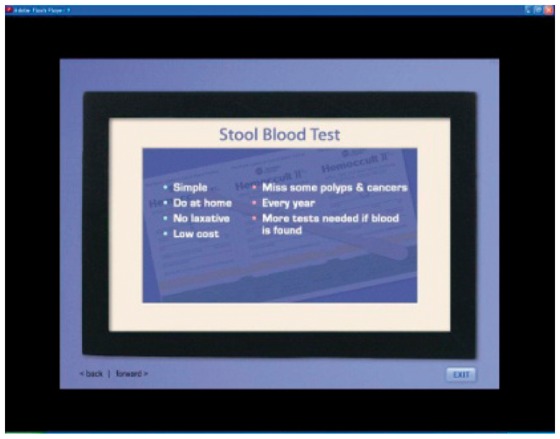 |
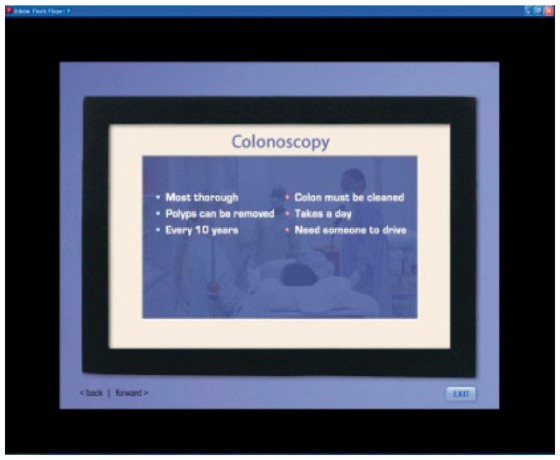 | ||
| Colonoscopy is the most thorough colon test. Any polyps found can be removed on the spot. If no polyps are found, it only needs to be done every 10 years. On the downside, you do have to clean out your colon. You need to take the day off from work for the test and you need someone to drive you home. Depending on your insurance, it can be costly. | ||
| (IF INCREASED RISK) Because you have relatives who had colon cancer, it is especially important for you to have a colonoscopy. This test allows a doctor to see inside the entire length of your colon to find and remove polyps. During this test, the doctor uses a long, thin, flexible tube to view the inside of your colon or bowel. The tube has a tiny camera that sends pictures to a screen. The doctor watches the screen to look for polyps or anything unusual. If polyps are found, they can be removed right then and there. | 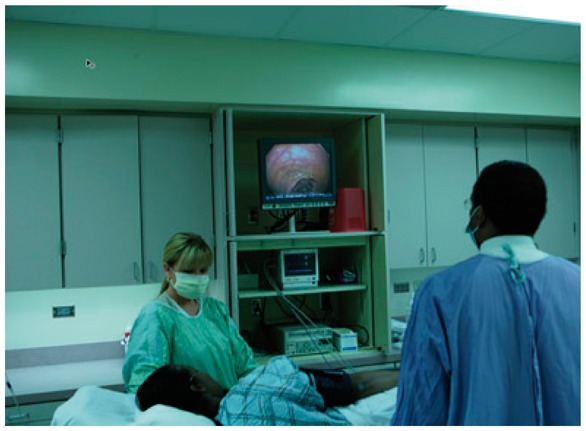 |
|
| FOBT Barrier: | (IF USER IS AVERAGE RISK AND SELECTED FOBT AS PREFERRED TEST) | 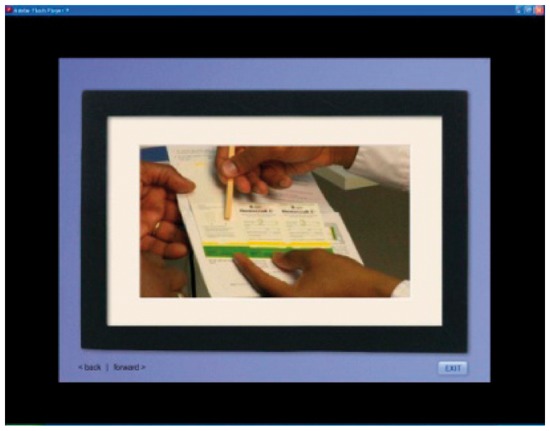 |
| Don’t know how to do the test | After a bowel movement, you use the stick that comes in the kit to dab a small amount of stool on one of the cards. You collect a small sample from three bowel movements in a row. Then you seal the card, place it in the return envelope and mail or drop it off to your doctor’s office | |
| Colonos-copy Barrier: | Robert: Would I have to take time off from work?… we’re really short-handed right now. | 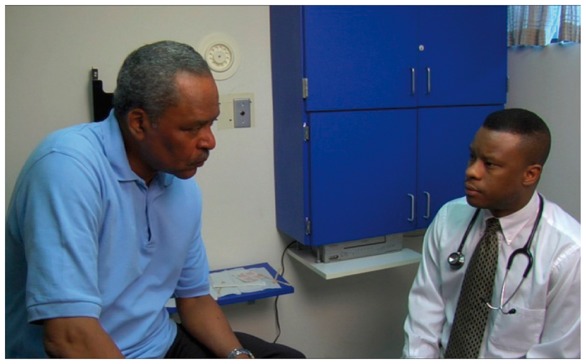 |
| Don’t have time | Doctor: Yes, you would need to take a day off, but it’s just once in every 10 years. One day is a good tradeoff if it means adding years to the rest of your life. Could you take a personal or vacation day? |
Sample tailored printout: woman at average risk for CRC
Sample tailored printout: man at increased risk for CRC due to family history
References
- 1.Edwards BK, Ward E, Kohler BA, et al. Annual report to the nation on the status of cancer, 1975-2006, featuring colorectal cancer trends and impact of interventions (risk factors, screening, and treatment) to reduce future rates. Cancer. 2010;116:544–73. doi: 10.1002/cncr.24760. [DOI] [PMC free article] [PubMed] [Google Scholar]
- 2.American Cancer Society. Colorectal Cancer Facts & Figures 2008-2010. Atlanta: American Cancer Society; 2008. [Google Scholar]
- 3.American Cancer Society. Cancer Prevention & Early Detection. Atlanta: American Cancer Society; 2010. [Google Scholar]
- 4.Center for Disease Control. CDC surveillance summaries; Surveillance of screening-detected cancers (colon and rectum, breast, and cervix) Morbidity Mortality Weekly Rep. 2010;59:1–26. [PubMed] [Google Scholar]
- 5.Levin B, Lieberman DA, McFarland B, et al. Screening and surveillance for the early detection of colorectal cancer and adenomatous polyps, 2008: a joint guideline from the American Cancer Society, the US multi-society task force on colorectal cancer, and the american college of radiology. CA Cancer J Clin. 2008;58:130–60. doi: 10.3322/CA.2007.0018. [DOI] [PubMed] [Google Scholar]
- 6.American Cancer Society. Cancer Facts & Figures for African Americans 2009-2010. Atlanta GA: American Cancer Society; 2009. [Google Scholar]
- 7.Rex DK, Rawl S, Rabeneck L, et al. Colorectal cancer in African Americans. Rev Gastroenterol Disord. 2004;4:60–5. [PubMed] [Google Scholar]
- 8.Greiner KA, Born W, Nollen N, et al. Knowledge and perceptions of colorectal cancer screening among urban African Americans. J Gen Intern Med. 2005;20:977–83. doi: 10.1111/j.1525-1497.2005.00165.x. [DOI] [PMC free article] [PubMed] [Google Scholar]
- 9.Myers RE, Trock BJ, Lerman C, et al. Adherence to colorectal cancer screening in an HMO population. Prevent Med. 1990;19:502–14. doi: 10.1016/0091-7435(90)90049-p. [DOI] [PubMed] [Google Scholar]
- 10.Holt WS., Jr Factors affecting compliance with screening sigmoidoscopy. J Fam Pract. 1991;32:585–9. [PubMed] [Google Scholar]
- 11.Kelly R, Shank J. Adherence to screening flexible sigmoidoscopy in asymptomatic patients. Med Care. 1992;30:1029–42. doi: 10.1097/00005650-199211000-00006. [DOI] [PubMed] [Google Scholar]
- 12.Lewis SF, Jensen NM. Screening sigmoidoscopy. Factors associated with utilization. J Gen Int Med. 1996;11:542–4. doi: 10.1007/BF02599602. [DOI] [PubMed] [Google Scholar]
- 13.Mandelson MT, Curry SJ, Anderson LA, et al. Colorectal cancer screening participation by older women. Am J Prev Med. 2000;19:149–54. doi: 10.1016/s0749-3797(00)00193-8. [DOI] [PubMed] [Google Scholar]
- 14.Weitzman ER, Zapka J, Estabrook B, et al. Risk and reluctance: understanding impediments to colorectal cancer screening. Prev Med. 2001;32:502–13. doi: 10.1006/pmed.2001.0838. [DOI] [PubMed] [Google Scholar]
- 15.Zapka JG, Puleo E, Vickers-Lahti M, et al. Healthcare system factors and colorectal cancer screening. Am J Prev Med. 2002;23:28–35. doi: 10.1016/s0749-3797(02)00444-0. [DOI] [PubMed] [Google Scholar]
- 16.O'Malley AS, Forrest CB, Mandelblatt J. adherence of low-income women to cancer screening recommendations. J Gen Int Med. 2002;17:144–54. doi: 10.1046/j.1525-1497.2002.10431.x. [DOI] [PMC free article] [PubMed] [Google Scholar]
- 17.Krebs P, Prochaska JO, Rossi JS. A meta-analysis of computer-tailored interventions for health behavior change. Prev Med. 2010;51:214–21. doi: 10.1016/j.ypmed.2010.06.004. [DOI] [PMC free article] [PubMed] [Google Scholar]
- 18.Albada A, Ausems MG, Bensing JM, et al. Tailored information about cancer risk and screening: a systematic review. Patient Edu Counsel. 2009;77:155–71. doi: 10.1016/j.pec.2009.03.005. [DOI] [PubMed] [Google Scholar]
- 19.Kroeze W, Werkman A, Brug J. A systematic review of randomized trials on the effectiveness of computer-tailored education on physical activity and dietary behaviors. Ann Behav Med. 2006;31:205–23. doi: 10.1207/s15324796abm3103_2. [DOI] [PubMed] [Google Scholar]
- 20.Noar SM, Benac CN, Harris MS. Does tailoring matter? Meta-analytic review of tailored print health behavior change interventions. Psychol Bull. 2007;133:673–93. doi: 10.1037/0033-2909.133.4.673. [DOI] [PubMed] [Google Scholar]
- 21.Velicer WF, Prochaska JO, Redding CA. Tailored communications for smoking cessation: past successes and future directions. Drug Alcohol Rev. 2006;25:49–57. doi: 10.1080/09595230500459511. [DOI] [PubMed] [Google Scholar]
- 22.Revere D, Dunbar PJ. Review of computer-generated outpatient health behavior interventions: clinical encounters ‘in absentia’. J Am Med Inform Assoc. 2001;8:62–79. doi: 10.1136/jamia.2001.0080062. [DOI] [PMC free article] [PubMed] [Google Scholar]
- 23.Kreuter MW, Farrell D, Olevitch L, et al. Tailoring Health Messages: Customizing Communication with Computer Technology. Mahwah: Lawrence Erlbaum Associates; 2000. [Google Scholar]
- 24.Strecher VJ, Greenwood T, Wang C, et al. Interactive multimedia and risk communiction. J Natl Cancer Inst Monogr. 1999;25:134–9. doi: 10.1093/oxfordjournals.jncimonographs.a024188. [DOI] [PubMed] [Google Scholar]
- 25.Brug J, Campbell M, van Assema P. The application and impact of computer-generated personalized nutrition education: a review of the literature. Patient Edu Counsel. 1999;36:145–56. doi: 10.1016/s0738-3991(98)00131-1. [DOI] [PubMed] [Google Scholar]
- 26.Skinner CS, Campbell MK, Rimer BK, et al. How effective is tailored print communication? Ann Behav Med. 1999;21:290–8. doi: 10.1007/BF02895960. [DOI] [PubMed] [Google Scholar]
- 27.Edwards AGK, Evans R, Hood K, Elwyn GJ. Personalised risk communication for informed decision making about taking screening tests. Cochrane Database of Systematic Reviews. 2006 doi: 10.1002/14651858.CD001865.pub2. Issue 4. No. CD001865. DOI: 10.1002/14651858.CD001865.pub2. [DOI] [PubMed] [Google Scholar]
- 28.Petty RE, Cacioppo JT. The elaboration likelihood model of persuasion. Adv Exp Soc Psychol. 1986;19:123–205. [Google Scholar]
- 29.Petty R, Barden J, Wheeler S. The elaboration likelihood model of persuasion: developing health promotions for sustained behavioral change. In: DiClemente R, Crosby R, Kegeler M, editors. Emerging Theories in Health Promotion Practice and Research. San Francisco, CA: John Wiley and Sons, Inc.; 2009. pp. 185–214. [Google Scholar]
- 30.Lipkus IM, Rimer BK, Halabi S, et al. Can tailored interventions increase mammography use among HMO women? Am J Prev Med. 2000;18:1–10. doi: 10.1016/s0749-3797(99)00106-3. [DOI] [PubMed] [Google Scholar]
- 31.Rakowski W, Ehrich B, Goldstein MG, et al. Increasing mammography among women aged 40-74 by use of a stage-matched, tailored intervention. Prev Med. 1998;27:748–56. doi: 10.1006/pmed.1998.0354. [DOI] [PubMed] [Google Scholar]
- 32.Clark MA, Rakowski W, Ehrich B, et al. The effect of a stage-matched and tailored intervention on repeat mammography(1) Am J Prev Med. 2002;22:1–7. doi: 10.1016/s0749-3797(01)00406-8. [DOI] [PubMed] [Google Scholar]
- 33.Steinwachs D, Allen JD, Barlow WE, Duncan RP, et al. NIH Consens State Sci Statements. National Institutes of Health; 2010. pp. 1–31. [PubMed] [Google Scholar]
- 34.Vernon SW, Bartholomew LK, McQueen A, et al. A randomized controlled trial of a tailored interactive computer-delivered intervention to promote colorectal cancer screening: sometimes more is just the same. Ann Behav Med. 2011;41:284–99. doi: 10.1007/s12160-010-9258-5. [DOI] [PMC free article] [PubMed] [Google Scholar]
- 35.Cooper CP, Gelb CA, Jameson H, et al. Developing English and Spanish television public service announcements to promote colorectal cancer screening. Health Prom Pract. 2005;6:385. doi: 10.1177/1524839905278759. [DOI] [PubMed] [Google Scholar]
- 36.American Cancer Society If You're 50 or Older, You Need to Get Tested for Colon Cancer. No Matter How Good Your Excuse Is. 2005 American Cancer Society, Inc. Publ. No. 2432.00. [Google Scholar]
- 37.Champion VL. Instrument refinement for breast cancer screening behaviors. Nurs Res. 1993;42:139–43. [PubMed] [Google Scholar]
- 38.Champion VL, Scott CR. Reliability and validity of breast cancer screening belief scales in African American women. Nurs Res. 1997;46:331–7. doi: 10.1097/00006199-199711000-00006. [DOI] [PubMed] [Google Scholar]
- 39.Kreuter MW, Strecher VJ. Changing inaccurate perceptions of health risk: results from a randomized trial. Health Psychol. 1995;14:56–63. doi: 10.1037//0278-6133.14.1.56. [DOI] [PubMed] [Google Scholar]
- 40.Rawl S, Champion VL, Menon U, et al. Validation of scales to measure benefits and barriers to colorectal cancer screening. J Psychosoc Oncol. 2001;19:47–63. [Google Scholar]
- 41.Menon U, Champion VL, Larkin GN, et al. Beliefs associated with fecal occult blood test and colonoscopy use at a worksite colon cancer screening program. J Occupat Environ Med. 2003;45:891–8. doi: 10.1097/01.jom.0000083038.56116.30. [DOI] [PMC free article] [PubMed] [Google Scholar]
- 42.Hochberg Y. A sharper Bonferroni procedure for multiple tests of significance. Biometrika. 1988;75:800. [Google Scholar]
- 43.Weinstein ND. Testing four competing theories of health-protective behavior. Health Psychol. 1993;12:324–33. doi: 10.1037//0278-6133.12.4.324. [DOI] [PubMed] [Google Scholar]
- 44.Janz NK, Becker MH. The health belief model: a decade later. Health Edu Quart. 1984;11:1–47. doi: 10.1177/109019818401100101. [DOI] [PubMed] [Google Scholar]
- 45.Champion VL, Skinner CS. The health belief model. Health Behav Health Edu Theor Res Pract. 2008;3:45–62. [Google Scholar]
- 46.Janz NK, Wren PA, Schottenfeld D, et al. Colorectal cancer screening attitudes and behavior: a population-based study. Prev Med. 2003;37:627–34. doi: 10.1016/j.ypmed.2003.09.016. [DOI] [PubMed] [Google Scholar]
- 47.Manne S, Markowitz A, Winawer S, et al. Correlates of colorectal cancer screening compliance and stage of adoption among siblings of individuals with early onset colorectal cancer. Health Psychol. 2002;21:3–15. [PubMed] [Google Scholar]
- 48.Codori AM, Petersen GM, Miglioretti DL, et al. Health beliefs and endoscopic screening for colorectal cancer: potential for cancer prevention. Prev Med. 2001;33:128–36. doi: 10.1006/pmed.2001.0862. [DOI] [PubMed] [Google Scholar]
- 49.Gwede CK, William CM, Thomas KB, et al. Exploring disparities and variability in perceptions and self-reported colorectal cancer screening among three ethnic subgroups of US. blacks. Oncol Nurs Forum. 2010;37:581–91. doi: 10.1188/10.ONF.581-591. [DOI] [PMC free article] [PubMed] [Google Scholar]
- 50.Cronan TA, Devos-Comby L, Villalta I, et al. Ethnic differences in colorectal cancer screening. J Psychosoc Oncol. 2008;26:63–86. doi: 10.1300/j077v26n02_05. [DOI] [PubMed] [Google Scholar]
- 51.Lipkus IM, Lyna PR, Rimer BK. Colorectal cancer risk perceptions and screening intentions in a minority population. JAMA. 2000;92:492–500. [PMC free article] [PubMed] [Google Scholar]
- 52.Gerrard M, Gibbons FX, Reis-Bergan M. The effect of risk communication on risk perceptions: the significance of individual differences. J Natl Cancer Inst Monogr. 1999;25:94–100. doi: 10.1093/oxfordjournals.jncimonographs.a024217. [DOI] [PubMed] [Google Scholar]
- 53.Rawl SM, Menon U, Champion VL, et al. Do benefits and barriers differ by stage of adoption for colorectal cancer screening? Health Edu Res. 2005 doi: 10.1093/her/cyg110. [DOI] [PubMed] [Google Scholar]
- 54.Vernon SW. Participation in colorectal cancer screening: a review. J Natl Cancer Inst. 1997;89:1406–22. doi: 10.1093/jnci/89.19.1406. [DOI] [PubMed] [Google Scholar]
- 55.Greiner KA, Born W, Nollen N, et al. Knowledge and perceptions of colorectal cancer screening among urban African Americans. J Gen Int Med. 2005;20:977–83. doi: 10.1111/j.1525-1497.2005.00165.x. [DOI] [PMC free article] [PubMed] [Google Scholar]
- 56.Green PM, Kelly BA. Colorectal cancer knowledge, perceptions, and behaviors in African Americans. Cancer Nurs. 2004;27:206–15; quiz 216–7. doi: 10.1097/00002820-200405000-00004. [DOI] [PubMed] [Google Scholar]
- 57.McAlearney AS, Reeves KW, Dickinson SL, et al. Racial differences in colorectal cancer screening practices and knowledge within a low-income population. Cancer. 2008;112:391–8. doi: 10.1002/cncr.23156. [DOI] [PMC free article] [PubMed] [Google Scholar]
- 58.Maxwell AE, Bastani R, Crespi CM, et al. Behavioral mediators of colorectal cancer screening in a randomized controlled intervention trial. Prev Med. 2011;52:167–73. doi: 10.1016/j.ypmed.2010.11.007. [DOI] [PMC free article] [PubMed] [Google Scholar]
- 59.Jerant A, Sohler N, Fiscella K, et al. Tailored interactive multimedia computer programs to reduce health disparities: opportunities and challenges. Patient Edu Counsel. 2011;85:323–30. doi: 10.1016/j.pec.2010.11.012. [DOI] [PMC free article] [PubMed] [Google Scholar]