Background: The physiological functions of the PRL phosphatases are poorly understood.
Results: PRL2 deficiency causes placental insufficiency, decreased spongiotrophoblast proliferation, and growth retardation.
Conclusion: PRL2 plays an important role in placental development by down-regulating PTEN and activating Akt.
Significance: This study provides the first evidence of an essential function for PRL2 and offers a biochemical basis for PRLs as oncoproteins to repress PTEN expression.
Keywords: Akt, Cell Growth, Oncogene, Placenta, Protein Phosphatase, Pten, PRL Phosphatases, PRL2
Abstract
The PRL (phosphatase of regenerating liver) phosphatases are implicated in the control of cell proliferation and invasion. Aberrant PRL expression is associated with progression and metastasis of multiple cancers. However, the specific in vivo function of the PRLs remains elusive. Here we show that deletion of PRL2, the most ubiquitously expressed PRL family member, leads to impaired placental development and retarded growth at both embryonic and adult stages. Ablation of PRL2 inactivates Akt and blocks glycogen cell proliferation, resulting in reduced spongiotrophoblast and decidual layers in the placenta. These structural defects cause placental hypotrophy and insufficiency, leading to fetal growth retardation. We demonstrate that the tumor suppressor PTEN is elevated in PRL2-deficient placenta. Biochemical analyses indicate that PRL2 promotes Akt activation by down-regulating PTEN through the proteasome pathway. This study provides the first evidence that PRL2 is required for extra-embryonic development and associates the oncogenic properties of PRL2 with its ability to negatively regulate PTEN, thereby activating the PI3K-Akt pathway.
Introduction
The PRL2 (phosphatase of regenerating liver) phosphatases constitute a novel class of small, prenylated phosphatases (PRL1, -2, and -3) that share a high degree (>76%) of sequence identity (1–3). Unlike most protein phosphatases that counteract the activity of protein kinases, the PRLs play a positive role in signaling and possess oncogenic properties (4, 5). PRL1 was originally identified as an immediate early gene induced during liver regeneration after partial hepatectomy (1). Subsequently, PRL1 as well as the closely related PRL2 and -3 were found to be elevated in numerous tumor cell lines, and cells expressing high levels of PRLs exhibited enhanced proliferation and anchorage-independent growth (1, 2, 6–9). Recent studies revealed that elevated PRL expression is also associated with cell invasion and tumor metastasis. PRL3 was initially found overexpressed in liver metastases of colorectal cancer, whereas its expression in primary tumors and normal colorectal epithelium was undetectable (10). Since then, up-regulation of PRLs has been shown in many types of late stage tumors and/or metastatic lesions from colorectal, gastric, breast, cervical, pancreatic, prostate, melanoma, Hodgkin lymphoma, and lung cancer (5, 11–15).
Thus it appears that an excess of PRL is a key contributor to the acquisition of the proliferative and metastatic properties of cancer cells. Available biochemical data suggest that PRLs promote cell proliferation and migration through a number of signaling pathways, including the Rho family of small GTPases, Src, ERK1/2, and PI3K (9, 12, 13, 16). However, our current understanding of PRLs came primarily from studies with cultured cells aberrantly or ectopically expressing PRLs. Thus the exact biological function for these phosphatases remains elusive. Among the three PRL isoforms, PRL2 is the most abundantly and ubiquitously expressed in adult human tissues, whereas PRL1 has a somewhat more restricted pattern of expression, with an overall lower level than PRL2 in the same tissues or cell types (3, 17, 18). PRL3 is primarily expressed in heart and skeletal muscle (3, 19). To investigate the physiological role of the PRLs, we generated mice lacking PRL2. We report that PRL2 deficiency causes growth retardation in both embryos and adult mice. The embryonic growth retardation is associated with placental insufficiency resulting from placental hypotrophy in PRL2 mutant mice. Severe cell loss is observed in the spongiotrophoblast and decidual layers of PRL2−/− placenta, leading to altered structure and reduced labyrinth volume, which impairs nutrient transport. We show that loss of PRL2 leads to an increase in PTEN, which in turn inactivates Akt, leading to reduced cell proliferation in PRL2−/− placenta. Together, these results provide the first evidence that PRL2 is required for extra-embryonic development by promoting cell proliferation via the PI3K-Akt signaling pathway.
EXPERIMENTAL PROCEDURES
Generation of PRL2 Knock-out Mice
Heterozygous gene trap embryonic stem (ES) cells (AQ0673; 129P2/OlaHsd; Sanger Institute) containing an insertional mutation in mouse Prl2 gene were injected into blastocysts from C57BL/6J mice, and the resulting chimeric males with successful germline transmission of the mutant allele were intercrossed with C57BL/6J females to generate F1 offspring. Genotyping of F1 offspring was performed by PCR. Primer sequences are listed in supplemental Table 1. F1 mice with heterozygous PRL2 mutation and their offspring used in this study are all on a C57BL6/129P2 mixed genetic background.
RNA Extraction, Quantitative RT-PCR, and in Situ Hybridization
Total RNA was extracted from tissues or cell lines using Trizol reagent (Invitrogen) and treated with DNase I (Promega). Reverse transcription was performed using the SuperScript III one-step RT-PCR system (Invitrogen) at 55 °C with gene-specific primers (supplemental Table 1). Quantitative PCR was performed using SYBR Green I master mix on a LightCycler 480 (Roche Applied Science), with RPL7 as the housekeeping gene control. In situ hybridization was performed as described (20). The PRL2 probe was amplified from mouse PRL2 cDNA using primers listed in supplemental Table 1. The Tpbp probe was a generous gift of Dr Haibin Huang. Antisense riboprobes were generated with digoxigenin-UTP using the digoxigenin RNA labeling system (Roche Applied Science) according to the manufacturer's guidelines and hybridized with paraffin-embedded (for Tpbp) or frozen (for PRL2) placental sections followed by detection with alkaline phosphatase-conjugated anti-digoxigenin antibody (Roche Applied Science).
Histology
Tissues were fixed in 4% paraformaldehyde overnight at 4 °C, embedded in paraffin, serially sectioned (7 μm), and stained with H&E and periodic acid-Schiff (PAS) according to standard methods. For immunohistochemistry, deparaffined sections were boiled in 10 mm sodium citrate (pH 6.0) for 10 min to unmask antigen. Sections were then incubated with diluted antibodies (1:50–1:100) at 4 °C overnight. Signals were detected by VECTASTAIN Elite ABC kit and developed using diaminobenzidine substrate from Vector Laboratories (Burlingame, CA). For apoptosis, TUNEL staining was performed using ApopTag fluorescein in situ apoptosis detection kit (Millipore) following the manufacturer's instructions. For PAS staining, tissues were fixed in ethanol:formalin (9:1) solution and paraffin-embedded. After oxidation by periodic acid, sections were immersed in Schiff's reagent for 20 min. Images were captured on a Leica DM2500 stereomicroscope. All images are representative of at least three samples.
Nutrient Transport Assay
Mice pregnant for 16.5 days were anesthetized with an intraperitoneal injection of 20 μl/g Avertin. An abdomen incision was made, and 3.5 μCi of [14C]mannitol in 150 μl of PBS was injected into the inferior vena cava. 5 min later, uterus was removed. Fetuses were dissected out and lysed at 55 °C overnight in 4 ml of Biosol (National Diagnostics, Atlanta, GA). Aliquots of fetal lysates were added to scintillation liquid for counting using a Beckman LS 6500 scintillation counter (GMI Inc.). Average counting of PRL2−/− embryos was calculated as the percentage of that of wild type within the same litter. Percentage values of all litters were then used to calculate a mean.
Cell Culture and Stable Clone Selection
HEK293 cells were grown in Dulbecco's modified Eagle's medium (DMEM) supplemented with 10% fetal bovine serum (Invitrogen), penicillin (50 units/ml), and streptomycin (50 μg/ml) under a humidified atmosphere containing 5% CO2. Mouse PRL2 cDNA was inserted into pCMV-FLAG expression vector and co-transfected with pcDNA3.1/Hygro(+) into HEK293 cells using Lipofectamine 2000 (Invitrogen) according to the manufacturer's recommendations. 24 h after transfection, 200 μg/ml hygromycin was added to the culture medium. Stable clones were picked after 2 weeks of selection.
Cell Migration Assay
Cells were serum-starved overnight, harvested with trypsin-EDTA, and washed twice with serum-free DMEM. Cells (5 × 10⁵) were then suspended in 1 ml of serum-free DMEM and added to the upper insert of the Transwell (Corning Costar, Cambridge, MA). The lower well was added with 3 ml of DMEM medium plus 10% fetal bovine serum. The migration was allowed for 16 h at 37 °C. Migratory cells were collected by trypsinization and counted with a hemocytometer.
Cell Proliferation Assay
5 × 10³cells were plated in each well of 96-well plates in DMEM medium with 10% fetal bovine serum. Seventy-two hours later, cells were incubated with 3-(4,5-dimethylthiazol-2-yl)-2,5-diphenyltetrazolium bromide substrate (500 μg/ml) for 4 h. The culture medium was then removed, and 100 μl dimethyl sulfoxide (DMSO) was added to each well followed by a 30 min incubation at room temperature. The optical density was measured spectrophotometrically at 540 nm. Each experiment was repeated at least three times.
Western Blot Analyses
Tissues or cultured cells were lysed with radioimmune precipitation buffer supplied with phosphatase and protease inhibitor mixture (Roche Applied Science). Equal amounts of protein were resolved by SDS-PAGE, transferred to nitrocellulose membrane and subjected to immunoblotting. Anti-PRL2 antibody was a kind gift of Dr. Qi Zeng. All other antibodies were from Cell Signaling Technology.
Cycloheximide Chase Experiment
2 × 10⁵ cells were seeded into each well of a 12-well plate and cultured overnight. 100 μg/ml cycloheximide was added to the plates, and the cells were lysed at 0, 6, 12, 24, and 36 h after cycloheximide treatment. The cell lysates were analyzed by immunoblotting to detect PTEN and actin protein signals, the density of which was measured using ImageJ, and the ratio of PTEN/actin was calculated for each sample and plotted as -folds of time 0 for each cell line.
In Vitro PI3K Kinase Assay
Wild-type or PRL2−/− placentas at E12.5 were lysed in 20 mm Tris-HCl, pH 7.4, 137 mm NaCl, 1 mm CaCl2, 1 mm MgCl2, 1% Nonidet P-40, with phosphatase and proteinase inhibitor mixtures (Roche Applied Science). 4 mg of protein lysate from each placenta was subjected to immunoprecipitation using anti-p85 antibody (Millipore). To analyze the PI3K activity of the immunoprecipitants, the beads were incubated in class I PI3K reaction buffer (Echelon) with 5 mm DTT, 10 μm phosphatidylinositol 4,5-bisphosphate diC8 (Echelon), 100 μm ATP, and 10 μCi of [γ-32P]ATP (3,000 Ci/mmol) (PerkinElmer Life Sciences) at 37 °C for 3 h. The reaction was terminated by the addition of EDTA to 5 mm, and the phospholipids were separated on a TLC plate as described (21) followed by exposing to x-ray film. The position of phosphatidylinositol 3,4,5-trisphosphate diC8 on the TLC plate was determined by phosphatidylinositol 3,4,5-trisphosphate diC8 standard (Echelon). The density of 32P-labeled phosphatidylinositol 3,4,5-trisphosphate product in each reaction was determined by ImageJ.
RESULTS
Generation of PRL2-deficient Mice
PRL2 knock-out mice were generated using a gene trap ES cell clone (AQ0673) obtained from Sanger Institute, in which a gene trap cassette pGT01 was inserted into the first intron of the mouse Prl2 gene (Fig. 1A). The single insertion site was confirmed by Southern blot and sequencing analyses. Injection of the ES cells into C57BL/6 blastocysts produced chimeric mice with successful germline transmission. Cross-mating of F1 PRL2+/− mice gave offspring with all three genotypes (Fig. 1B). Targeted ablation of PRL2 expression was confirmed by quantitative RT-PCR (Fig. 1C) and Western blot (Fig. 1D). No compensatory change in PRL1 and -3 expression was observed in PRL2-deficient mice (Fig. 1E).
FIGURE 1.
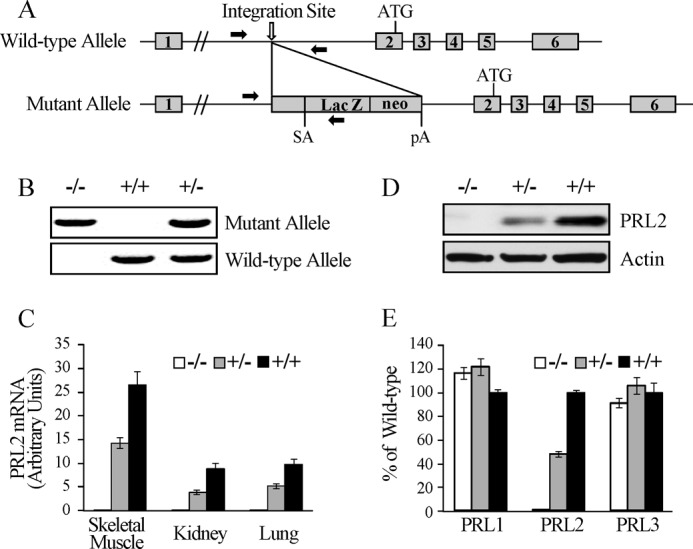
Generation and characterization of PRL2 knock-out mice. A, structure of the mouse PRL2 locus and the mutant allele containing the pGT01 gene trap cassette. The exons and the initiation codon (ATG) of PRL2 are indicated. Lac Z and neo: expression units of the β-galactosidase and neomycin resistance genes. pA, polyadenylation signal. SA, splice acceptor. Solid arrows indicate primer sites for PCR genotyping. B, representative PCR amplification fragments using primers indicated in A for genotyping. C, quantitative RT-PCR analysis of PRL2 mRNA expression in tissues from PRL2+/+, PRL2+/−, and PRL2−/− mice. n = 3 per group. D, Western blot analyses of PRL2 protein levels in skeletal muscle from PRL2+/+, PRL2+/−, and PRL2−/− mice. E, quantitative RT-PCR analysis of PRL1, PRL2, and PRL3 mRNA expression in E16.5 embryos with PRL2+/+, PRL2+/−, or PRL2−/− genotypes (n = 3 per genotype). The results were presented as the percentage of the wild type ± S.E.
PRL2−/− Mice Are Growth-retarded
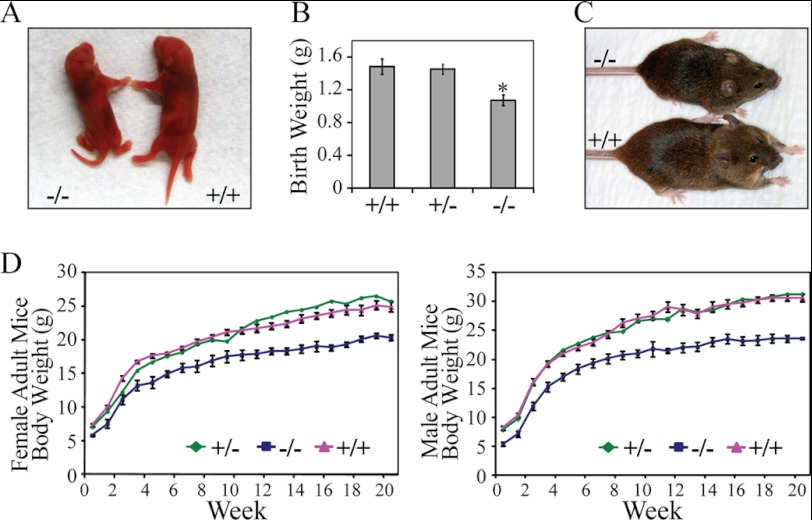
Examination of about 500 pups from PRL2+/− intercrossing showed a Mendelian ratio among wild-type, heterozygous, and homozygous mice. Although viable, PRL2−/− newborns were 20% smaller when compared with their wild-type littermates (Fig. 2, A and B). Although the body weight of heterozygous mice was not different from that of the wild type, homozygous mutant mice maintained a smaller size throughout their adulthood (Fig. 2, C and D). The heart, liver, lung, kidney, spleen, thymus, and testis from PRL2−/− mice weighed below normal. However, with the exception of testis and spleen, the organ/whole body weight ratio was similar between PRL2−/− and the wild type (supplemental Fig. S1). Histological examination did not reveal significant differences between wild-type and PRL2 mutant mice in these proportionally smaller organs (supplemental Fig. S2). No measurable difference in metabolites and electrolytes was detected from blood samples of wild-type and PRL2−/− mice (supplemental Fig. S3). The levels of growth axis hormones (growth hormone, thyroid-stimulating hormone, and IGF1) and other pituitary hormones (luteinizing hormone and ACTH) were normal in PRL2−/− mice (supplemental Fig. S4), indicating that the effect of PRL2 deletion on body mass is unlikely a result of reduced hormone production. The mechanism by which PRL2 deficiency causes postnatal growth reduction is under investigation. Collectively, PRL2−/− mice are growth-retarded at birth and are 20% smaller than their wild-type littermates throughout adulthood.
FIGURE 2.
PRL2 mutant mice are growth-retarded. A, gross appearance of newborn PRL2 mutant and wild-type littermates. B, body weight of PRL2+/+ (n = 6), PRL2+/− (n = 15), and PRL2−/− (n = 6) mutant newborn mice (mean ± S.E. *, p < 0.01). C, gross appearance of 6-week-old PRL2 mutant and wild-type littermates. D, body weight of PRL2+/+, PRL2+/−, and PRL2−/− mice (males, n = 9, 12, and 10, respectively; females, n = 10, 11, and 11, respectively) from 1 to 21 weeks of age. Data represent mean for PRL2+/− mice and mean ± S.E. for PRL2+/+and PRL2−/− mice (p < 0.01 for all time points except 1 week female).
Placental Hypotrophy and Insufficiency in PRL2−/− Mice
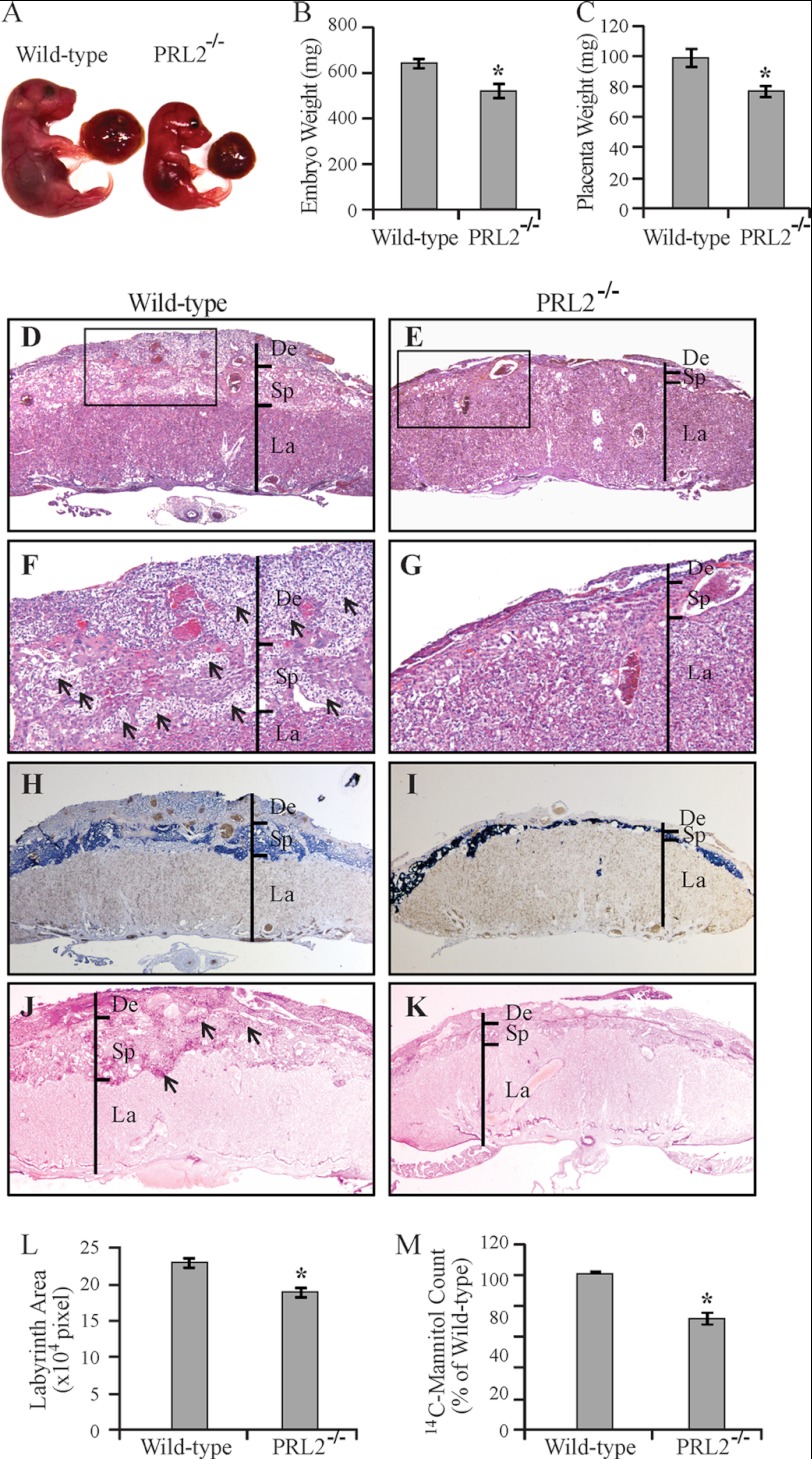
The lower body weight of PRL2−/− mice at birth suggests growth restriction during embryonic development. Timed mating between heterozygous male and female mice was performed, and the embryos were harvested at E16.5. The weight of PRL2−/− embryos was 81% of that of the wild-type littermates (Fig. 3, A and B). In addition, the placental weight of the PRL2−/− embryos was reduced to 78% of that of the wild-type littermates (Fig. 3, A and C), indicating impaired growth and development of both the placenta and the embryo in PRL2−/− mice.
FIGURE 3.
Placental hypotrophy and insufficiency in PRL2−/− mice. A, embryos and their connected placentas of a PRL2−/− mouse and its wild-type littermate at E16.5. B, weight of wild-type and PRL2−/− embryos at E16.5 (n = 9 for each genotype). *, p < 0.005. C, weight of wild-type and PRL2−/− placentas at E16.5 (n = 9 for each genotype). *, p < 0.01. D–K, histological examination of wild-type and PRL2−/− placentas at E16.5. D and E, H&E staining at 25×. F and G, H&E staining at 100×. Arrows designate islands of glycogen cells. H and I, in situ hybridization using Tpbp probe marking spongiotrophoblast cells (dark blue) and glycogen cells (light blue). J and K, PAS staining for glycogen-containing cells (pink signal). Arrows designate islands of glycogen cells. De, deciduas; Sp, spongiotrophoblast; La, labyrinth. L, labyrinth area on the midline section (the largest section of continuous sections) from PRL2−/− or wild-type placentas was measured using ImageJ (n = 6 for each genotype). Data represent mean ± S.E. *, p < 0.01. M, [14C]mannitol transported by PRL2−/− or wild-type placentas. Data are presented as mean (percentage of wild type) ± S.E. n = 6 litters, *, p < 0.005.
Defects in placental development can negatively impact the ability of the placenta to transport nutrients, thus leading to restricted fetal growth or even embryonic death (22). H&E staining revealed that PRL2−/− placenta had severely reduced decidua and spongiotrophoblast layers (Fig. 3, D and E). Large islands of glycogen cells in the spongiotrophoblast layer of wild-type placenta, readily recognizable by their vacuolated appearance, were almost absent in PRL2 mutant placenta. In addition, massive invasion of glycogen cells in the decidual layer in wild-type placenta was not observed in mutant placenta, likely accounting for the lost volume of the decidual layer in PRL2 mutant mice (Fig. 3, F and G). These structural defects were corroborated by marker analyses. In situ hybridization for mRNA expression of Tpbp (23), a gene specifically expressed in spongiotrophoblast and glycogen cells, confirmed that the spongiotrophoblast and decidual layers were much thinner in PRL2−/− placenta (Fig. 3, H and I). The number of spongiotrophoblast cells, the dark blue cells located in the spongiotrophoblast layer, was much decreased in PRL2−/− placenta. In addition, glycogen cells identified as light blue Tpbp-positive cells (Fig. 3, H and I) or pink cells with PAS-positive staining (Fig. 3,J and K) in spongiotrophoblast and decidual layers were dramatically reduced in PRL2-deficient placenta.
No appreciable change was observed in the density or organization of trophoblasts in the labyrinth layer of PRL2−/− placenta, based on staining with alkaline phosphatase (supplemental Fig. S5, A and B), which is expressed only in trophoblast lining maternal blood sinus. There also appeared to be no alteration in fetal vascular structure based on CD31 staining of the endothelial cells (supplemental Fig. S5, C and D). However, the area of the labyrinth layer in PRL2−/− placenta mid-section was 20% smaller than that in the wild type (Fig. 3L), suggesting that the PRL2−/− labyrinth has a smaller volume. To determine the functional consequence from the structural defects in PRL2−/− placenta, we assessed the nutrient transport capacity of wild-type and PRL2-deficient placentas within the same uterine horn by measuring the transfer of [14C]mannitol from the maternal blood stream to the embryos within 5 min, when transfer is essentially unidirectional without backflux (24). When compared with the wild type, the amount of [14C]mannitol transferred by mutant placentas was reduced by 29% (Fig. 3M). Taken together, PRL2 deficiency decreases the number of spongiotrophoblast and glycogen cells, causing substantially reduced spongiotrophoblast and decidual layers as well as labyrinth volume. These structural defects in PRL2−/− placenta impair nutrient transport, which may lead to embryonic growth retardation.
Spongiotrophoblast and Glycogen Cell Loss Occurs at Midgestational Stage due to Reduced Cell Proliferation
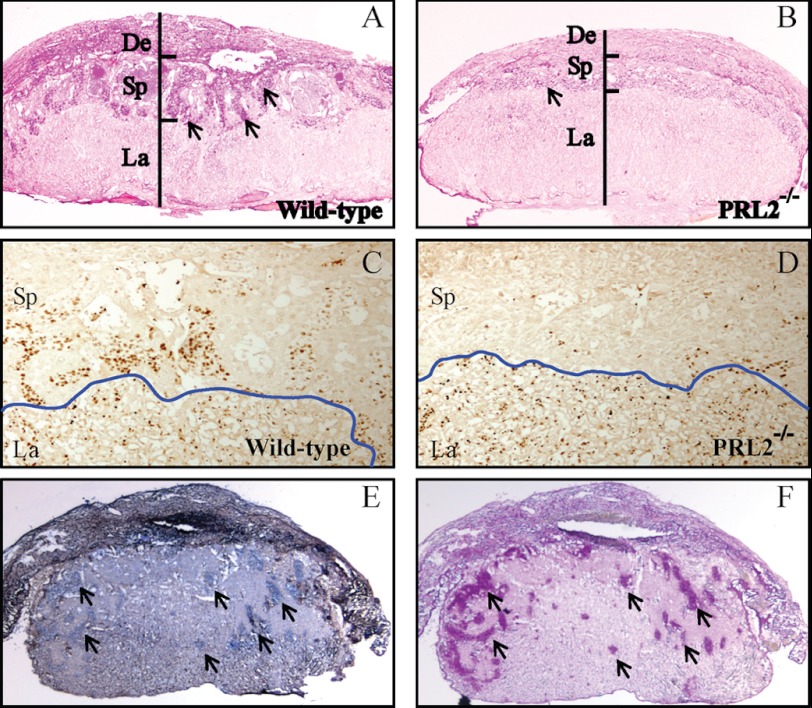
To investigate at what gestational stage the spongiotrophoblast cell loss occurs, we analyzed the wild-type and mutant placenta at E12.5, a time point when the three-layer placenta is just established and glycogen cells start to differentiate (25, 26). Although not as pronounced as those observed at E16.5, the spongiotrophoblast and decidual layers of mutant placenta were already thinner than the wild type at E12.5 (Fig. 4, A and B). Thus significant loss of spongiotrophoblast and glycogen cells in the spongiotrophoblast layer of PRL2−/− mice occurred at or before E12.5.
FIGURE 4.
PRL2 mutant placenta has significantly lower amount of spongiotrophoblast and glycogen cells due to reduced proliferation. A–D, histological examination of wild-type and PRL2−/− placentas at E12.5. A and B, PAS glycogen staining. Arrows designate islands of glycogen cells. C and D, immunohistochemistry using antibody against Ki67 to monitor proliferating cells. The blue line shows the boundary between labyrinth and spongiotrophoblast layers. De, deciduas; Sp, spongiotrophoblast; La, labyrinth. E, in situ hybridization using PRL2 probe showing PRL2 mRNA expression on frozen section of E12.5 wild-type placenta. Arrows show PRL2-positive cells in the decidual layer. F, PAS glycogen staining on the section adjacent to E. Arrows show glycogen-containing cells. Note the overlap of PRL2-positive cells and glycogen cells.
To determine whether the cell loss in the spongiotrophoblast layer is due to increased apoptosis, TUNEL assays were performed on wild-type and PRL2−/− placenta at E12.5 (supplemental Fig. S6, A–C). There was no difference in the number of apoptotic cells in wild-type and PRL2 mutant placenta, indicating that PRL2 deficiency does not induce cell apoptosis. In contrast, marked reduction in the number of proliferating cells was observed in the mutant spongiotrophoblast layer (Fig. 4, C and D). Thus decreased cell proliferation may be responsible for the reduced cell number and compromised development of the spongiotrophoblast layer in mutant PRL2 placenta. In situ hybridization showed that PRL2 mRNA is present in all types of trophoblast cells in wild-type placenta at E12.5 and highly enriched in glycogen cells (Fig. 4, E and F). Consequently, decreased cell proliferation in spongiotrophoblast layer is likely a direct effect of PRL2 deficiency in these cells.
PRL2 Deficiency Results in Decreased Akt Phosphorylation in the Placenta
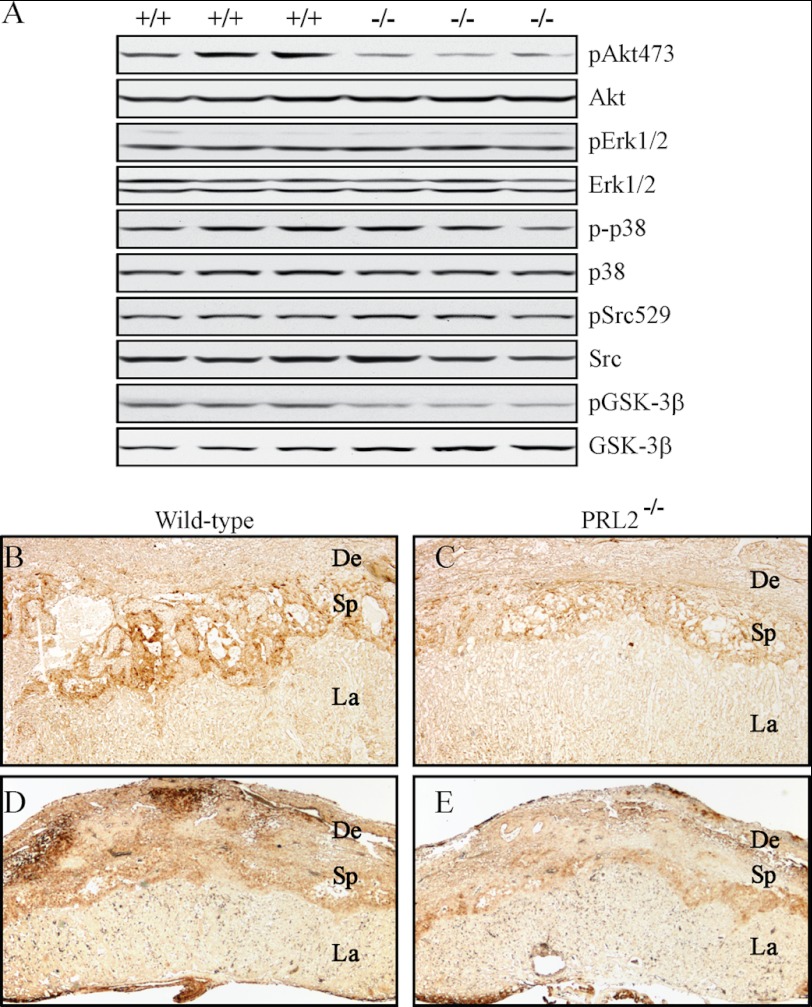
To define the mechanism by which PRL2 deficiency decreases cell proliferation, we analyzed the activation status of several previously implicated PRL-mediated pathways in cell culture studies. As shown in Fig. 5A, Western blot of lysates prepared from wild-type and PRL2−/− placenta showed that the phosphorylation levels of Src, ERK1/2, and p38 are not altered in PRL2 mutant mice. In contrast, Akt phosphorylation is 70% lower in the PRL2−/− samples. This result is confirmed by immunohistochemical staining of wild-type and mutant placenta using antibodies against phosphorylated Akt (Fig. 5, B and C). Consistent with the decreased cell proliferation in the spongiotrophoblast layer, the signal for phospho-Akt in the spongiotrophoblast layer of PRL2−/− placenta is much weaker than that in the wild-type placenta. Furthermore, decreased (64%) phosphorylation of GSK3β, a well established Akt substrate, was also evident in mutant PRL2 placenta by both Western blot (Fig. 5A) and immunohistochemistry in the spongiotrophoblast layer (Fig. 5, D and E). A decrease in GSK3β phosphorylation is expected to activate GSK3β, which in turn phosphorylates and inhibits glycogen synthase, leading to reduced glycogen production in PRL2 mutant placenta. These results suggest that PRL2 deficiency impairs placental development by inactivating Akt. Interestingly, the retarded fetal and placental growth observed in PRL2−/− mice is reminiscent of the phenotype observed in mice with Akt1 deficiency (27). Akt1−/− placenta exhibits significant hypotrophy with marked reduction of the decidual layer and nearly complete loss of glycogen-containing cells in the spongiotrophoblast layer.
FIGURE 5.
Activation of Akt was reduced in PRL2-deficient placenta. A, analyses of phospho (p) and total protein levels of signaling molecules by Western blot using tissue lysates isolated from E12.5 PRL2−/− or wild-type placentas. B–E, immunohistochemical analyses of E12.5 PRL2−/− or wild-type placentas for phospho-Akt473 (B and C) or phospho-GSK3β (D and E) levels. De, deciduas; Sp, spongiotrophoblast; La, labyrinth.
Overexpression of PRL2 in HEK293 Cells Enhances EGF- and IGF2-induced Akt Activation
Development of spongiotrophoblast and glycogen cells is regulated by EGF and IGF2. Egfrwa2 homozygous mice have smaller embryo and placenta featuring a reduced spongiotrophoblast layer and loss of spongiotrophoblast and glycogen cells (28). IGF2-null mice also showed growth retardation of both fetus and placenta with a marked reduction in the number of glycogen cells (29). The strikingly similar phenotypes between epidermal growth factor receptor (EGFR) hypomorphic/IGF2-null and PRL2−/− mice and the decreased Akt phosphorylation in PRL2−/− placenta prompted us to examine whether PRL2 modulates EGF- and/or IGF2-induced Akt activation. When compared with vector control, HEK293 cells stably expressing FLAG-tagged PRL2 displayed a higher proliferation rate and increased migration (Fig. 6, A and B), as well as a higher basal Akt phosphorylation (Fig. 6C). Furthermore, PRL2 expression prolonged the EGF-induced Akt activation, whereas elevated Akt phosphorylation was observed in PRL2-expressing cells upon IGF2 stimulation (Fig. 6D). The data indicate that overexpression of PRL2 augments EGF- and IGF2-mediated Akt activation and suggest that PRL2 deficiency could abrogate EGF- or IGF2-mediated Akt activation in the PRL2 mutant placenta, causing impaired placental development.
FIGURE 6.
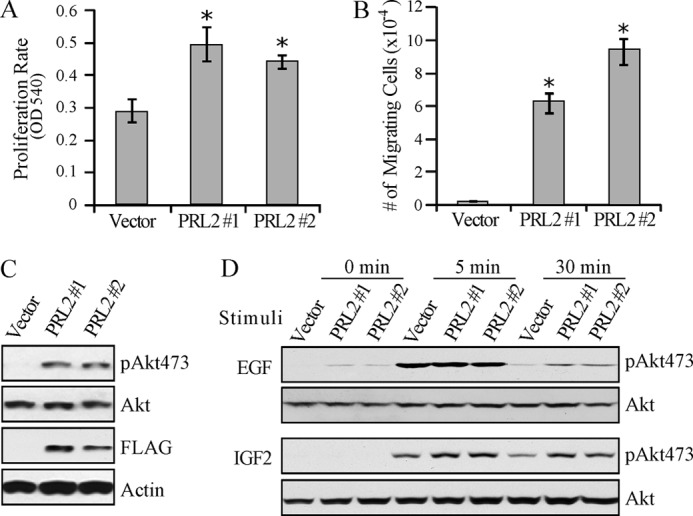
PRL2 overexpression enhanced EGF- and IGF2-induced Akt activation in HEK293 cells. A, proliferation rate of HEK293-PRL2 stable cell lines (PRL #1 and #2) and vector control cells. Cell numbers were determined after a 72-h culture by the 3-(4,5-dimethylthiazol-2-yl)-2,5-diphenyltetrazolium bromide assay measured as optical density at 540 nm (OD 540). Data represent mean of three experiments ± S.E. *, p < 0.01. B, migration rate of HEK293-PRL2 and vector control cells determined by the Transwell migration assay. Cells that migrated to the lower chamber were collected and counted with a hemocytometer. Data represent mean of three experiments ± S.E. *, p < 0.001. C, Western blot showing FLAG-tagged PRL2 expression and Akt phosphorylation in HEK293-PRL2 cells. pAkt473, phospho-Akt473. D, responsiveness of HEK293-PRL2 and vector control cells to EGF and IGF2. Cells were serum-starved overnight, stimulated with 2 ng/ml EGF or 5 ng/ml IGF2 for the indicated times, lysed, and subjected to Western blot for phosphorylated Akt and total Akt signals. pAkt473, phospho-Akt473.
PRL2 Activates Akt by Down-regulating PTEN Expression
As a key component of the PI3K pathway, Akt is activated by PI3K and repressed by PTEN. To determine whether the decreased Akt phosphorylation in PRL2−/− placenta is due to reduced PI3K activity, we measured the kinase activity of PI3K immunoprecipitated from placentas. No difference in PI3K activity was observed between the wild-type and PRL2−/− placenta (supplemental Fig. S7). We then examined whether PRL2 controls the level of PTEN, a negative regulator of Akt. Overexpression of PRL2 in HEK293 cells led to a 40% decrease in PTEN, whereas deletion of PRL2 gave rise to a 1.7-fold increase in PTEN in PRL2-deficient placenta (Fig. 7A). Taken together, the results suggest that PRL2 promotes Akt activation by down-regulating PTEN.
FIGURE 7.
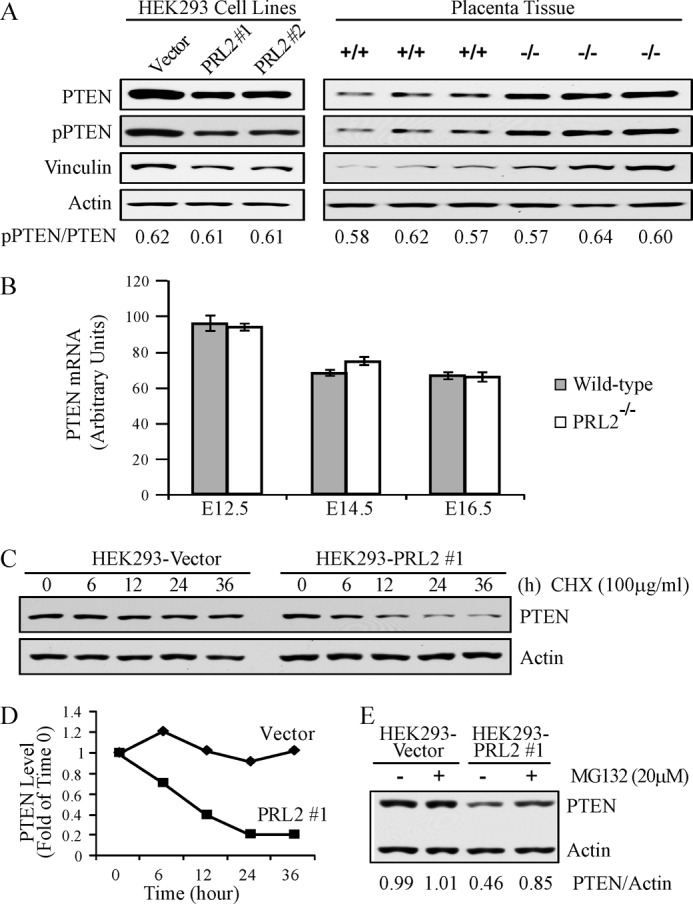
PRL2 destabilized PTEN protein by reducing vinculin expression. A, lysates from E12.5 PRL2−/− or wild-type placentas as well as HEK293-PRL2 stable cell lines (PRL2 #1 and #2) and their vector controls were analyzed by Western blot for PTEN, phospho-PTEN (pPTEN), and vinculin expression. B, PTEN mRNA levels in PRL2−/− or wild-type placentas at E12.5, E14.5, and E16.5 were determined by quantitative RT-PCR (n = 5 for each genotype at each stage). Data represent mean ± S.E. C, HEK293-PRL2 stable cell line and its vector control were treated with cycloheximide (CHX) at 100 μg/ml for the indicated times, and cell lysates were analyzed for PTEN and actin protein levels by Western blot. Data represent three independent experiments. D, quantification of the results in C. PTEN and actin signals were measured using ImageJ. The ratio of PTEN/actin was determined for each sample and plotted as -folds of time 0 for each cell line. E, HEK293-PRL2 cell line and its vector control were treated with 20 μm MG132 for 6 h. Cells were lysed, and PTEN and actin protein levels were analyzed by Western blot. PTEN and actin signals were measured using ImageJ, and the ratio of PTEN/actin was determined. Data are representative of three independent experiments.
PTEN can be regulated at both mRNA and protein levels. To determine whether PRL2 influences PTEN transcription, we measured PTEN mRNA by quantitative RT-PCR. Fig. 7B shows that PTEN mRNA levels were similar in wild-type and mutant placenta at developmental stages from E12.5 to E16.5. Thus PRL2 deficiency-induced up-regulation of PTEN may occur at the post-transcriptional level. To determine whether PRL2 affects PTEN protein stability, PRL2-transfected or control cells were treated with cycloheximide, which blocks protein synthesis. As shown in Fig. 7, C and D, PRL2 overexpression promotes PTEN degradation, reducing its half-life from more than 36 h to around 10 h. Treatment with 20 μm of the proteasome inhibitor MG132 did not significantly affect PTEN level in control cells, but did potently increase PTEN in PRL2-expressing cells (Fig. 7E). Collectively, the results indicate that PRL2 down-regulates PTEN through the proteasomal pathway. It follows that PRL2 deficiency leads to elevated PTEN level as observed in PRL2−/− placenta.
Phosphorylation of PTEN at Ser-380, Thr-382, and Thr-383 enhances PTEN stability by protecting it from the proteasome-mediated degradation (30). Because PRL2 is a protein phosphatase, we tested the hypothesis that PRL2 destabilizes PTEN by removing phosphates from these sites. We analyzed PTEN phosphorylation at the Ser-380/Thr-382/Thr-383 cluster and the total PTEN protein in vector control- and PRL2-expressing cells, as well as in wild-type and PRL2−/− placenta (Fig. 7A). The ratios of phospho-PTEN/total PTEN were found to be constant as the levels of PRL2 varied. Moreover, no appreciable changes in PTEN phosphorylation were observed when PTEN immunoprecipitated from HEK293 cells was treated with recombinant PRL2 (supplemental Fig. S8). Thus it appears that PRL2 does not control PTEN phosphorylation.
PTEN protein stability could also be regulated by its interacting proteins such as MAGI2 (31). PTEN forms a complex with MAGI2 and β-catenin at cell adherens junction, which prevents PTEN from degradation, and this complex is maintained by the adherens junction component vinculin. In vinculin-null cells, the complex is disrupted and PTEN level is reduced (32). This led us to examine whether PRL2 altered the expression of vinculin. Lysates from wild-type and PRL2−/− placenta, as well as vector- and PRL2-transfected cells, were analyzed for vinculin by Western blot. The results showed that vinculin is up-regulated in PRL2-deficient placenta and down-regulated in PRL2 overexpressing cells (Fig. 7A). Thus one mechanism by which PRL2 down-regulates PTEN may be via inhibition of vinculin expression, which disrupts the PTEN-MAGI2-β-catenin complex, exposing PTEN for degradation.
DISCUSSION
Despite a wealth of data obtained in cultured cells supporting a role for PRLs in tumorigenesis and metastasis, there is little evidence that these enzymes play important physiological roles in mammals. We provide the first genetic evidence of an essential function for a member of this subfamily of phosphatases in placental development and fetal growth. PRL2 deficiency impairs glycogen-containing cell proliferation, leading to reduced spongiotrophoblast and decidual layers in the placenta. These structural defects cause placental hypotrophy and insufficiency, likely responsible for the fetal growth retardation. The placental development and fetal growth phenotypes observed in PRL2−/− mice are reminiscent of mice carrying an Akt1-null mutation (27). Interestingly, Akt activity in the PRL2-null placenta is notably lower than in the wild-type counterpart (Fig. 5). Given the importance of IGF2 in embryonic growth (33) and our results showing that PRL2 augments IGF2-induced Akt activation, the embryonic growth restriction in PRL2−/− mice may also be caused by impairment in IGF2 signaling, in addition to placental dysfunction.
Akt is a major downstream effector of PI3K pathway, which promotes proliferation and survival. PTEN is one of the most common tumor suppressors frequently lost in human cancer and mutated in inherited cancer predisposition syndromes. PTEN negatively regulates Akt activation by converting phosphatidylinositol triphosphate (PI(3,4,5)P3) into phosphatidylinositol 4,5-bisphosphate (PI(4,5)P2) (34). Thus down-regulation of PTEN is expected to activate PI3K-Akt signaling, which has been associated with the development of cancer. We discovered that PTEN level is elevated in PRL2-deficient placenta, consistent with the decreased Akt activity and glycogen cell proliferation. Conversely, increased PRL2 expression in HEK293 cells reduces PTEN level, which promotes Akt activation and cell proliferation. Moreover, overexpression of PRL3 in the DLD1 colorectal cancer cell line also results in decreased PTEN protein and increased Akt phosphorylation (16). Taken together, our results suggest that PRL2 activates Akt by down-regulating PTEN. In support of our finding that PRL2 functions as a negative regulator of PTEN, “Super-PTEN” transgenic mouse lines with higher PTEN expression also show reduced body size due to decreased cell proliferation (35). Recent studies reveal that even a subtle reduction of PTEN expression can substantially increase tumor formation in mice (36). Given the strong cancer susceptibility to subtle variations in PTEN dosage, the ability of PRL2 to repress PTEN expression provides a biochemical basis for it to serve as an oncogene. Our data suggest that PRL2 down-regulates PTEN through the proteasomal pathway, likely via inhibition of vinculin expression, which disrupts the PTEN-MAGI2-β-catenin complex, exposing PTEN for degradation. Ongoing efforts are devoted to understand the exact mechanism by which PRL2 controls PTEN stability. The PRL2−/− mice offer a powerful system to define the roles of PRL in both development and tumorigenesis.
This work was supported, in whole or in part, by National Institutes of Health Grants CA69202 (to Z. Y. Z.), HL85098 (to W. S.), and HD42024 (to S. J. R.). This work was also supported by an Indiana University Collaborative Research Grant (IUCRG) pilot grant.
This article was selected as a Paper of the Week.

This article contains supplemental Table 1 and Figs. S1–S8.
- PRL
- phosphatase of regenerating liver
- PTEN
- phosphatase and tensin homologue deleted on chromosome 10
- PAS
- periodic acid-Schiff
- GSK3β
- glycogen synthase kinase 3β
- PI
- phosphatidylinositol
- E
- embryonic day.
REFERENCES
- 1. Diamond R. H., Cressman D. E., Laz T. M., Abrams C. S., Taub R. (1994) PRL-1, a unique nuclear protein-tyrosine phosphatase, affects cell growth. Mol. Cell Biol. 14, 3752–3762 [DOI] [PMC free article] [PubMed] [Google Scholar]
- 2. Cates C. A., Michael R. L., Stayrook K. R., Harvey K. A., Burke Y. D., Randall S. K., Crowell P. L., Crowell D. N. (1996) Prenylation of oncogenic human PTPCAAX protein-tyrosine phosphatases. Cancer Lett. 110, 49–55 [DOI] [PubMed] [Google Scholar]
- 3. Zeng Q., Hong W., Tan Y. H. (1998) Mouse PRL-2 and PRL-3, two potentially prenylated protein-tyrosine phosphatases homologous to PRL-1. Biochem. Biophys. Res. Commun. 244, 421–427 [DOI] [PubMed] [Google Scholar]
- 4. Stephens B. J., Han H., Gokhale V., Von Hoff D. D. (2005) PRL phosphatases as potential molecular targets in cancer. Mol. Cancer Ther. 4, 1653–1661 [DOI] [PubMed] [Google Scholar]
- 5. Bessette D. C., Qiu D., Pallen C. J. (2008) PRL PTPs: mediators and markers of cancer progression. Cancer Metastasis Rev. 27, 231–252 [DOI] [PubMed] [Google Scholar]
- 6. Wang J., Kirby C. E., Herbst R. (2002) The tyrosine phosphatase PRL-1 localizes to the endoplasmic reticulum and the mitotic spindle and is required for normal mitosis. J. Biol. Chem. 277, 46659–46668 [DOI] [PubMed] [Google Scholar]
- 7. Wang Q., Holmes D. I., Powell S. M., Lu Q. L., Waxman J. (2002) Analysis of stromal-epithelial interactions in prostate cancer identifies PTPCAAX2 as a potential oncogene. Cancer Lett. 175, 63–69 [DOI] [PubMed] [Google Scholar]
- 8. Werner S. R., Lee P. A., DeCamp M. W., Crowell D. N., Randall S. K., Crowell P. L. (2003) Enhanced cell cycle progression and down-regulation of p21Cip1/Waf1 by PRL tyrosine phosphatases. Cancer Lett. 202, 201–211 [DOI] [PubMed] [Google Scholar]
- 9. Liang F., Liang J., Wang W. Q., Sun J. P., Udho E., Zhang Z. Y. (2007) PRL3 promotes cell invasion and proliferation by down-regulation of Csk leading to Src activation. J. Biol. Chem. 282, 5413–5419 [DOI] [PubMed] [Google Scholar]
- 10. Saha S., Bardelli A., Buckhaults P., Velculescu V. E., Rago C., St Croix B., Romans K. E., Choti M. A., Lengauer C., Kinzler K. W., Vogelstein B. (2001) A phosphatase associated with metastasis of colorectal cancer. Science 294, 1343–1346 [DOI] [PubMed] [Google Scholar]
- 11. Zeng Q., Dong J. M., Guo K., Li J., Tan H. X., Koh V., Pallen C. J., Manser E., Hong W. (2003) PRL-3 and PRL-1 promote cell migration, invasion, and metastasis. Cancer Res. 63, 2716–2722 [PubMed] [Google Scholar]
- 12. Fiordalisi J. J., Keller P. J., Cox A. D. (2006) PRL tyrosine phosphatases regulate Rho family GTPases to promote invasion and motility. Cancer Res. 66, 3153–3161 [DOI] [PubMed] [Google Scholar]
- 13. Achiwa H., Lazo J. S. (2007) PRL-1 tyrosine phosphatase regulates c-Src levels, adherence, and invasion in human lung cancer cells. Cancer Res. 67, 643–650 [DOI] [PubMed] [Google Scholar]
- 14. Hardy S., Wong N. N., Muller W. J., Park M., Tremblay M. L. (2010) Overexpression of the protein-tyrosine phosphatase PRL-2 correlates with breast tumor formation and progression. Cancer Res. 70, 8959–8967 [DOI] [PubMed] [Google Scholar]
- 15. Wang Y., Lazo J. S. (2012) Metastasis-associated phosphatase PRL-2 regulates tumor cell migration and invasion. Oncogene 31, 818–827 [DOI] [PMC free article] [PubMed] [Google Scholar]
- 16. Wang H., Quah S. Y., Dong J. M., Manser E., Tang J. P., Zeng Q. (2007) PRL-3 down-regulates PTEN expression and signals through PI3K to promote epithelial-mesenchymal transition. Cancer Res. 67, 2922–2926 [DOI] [PubMed] [Google Scholar]
- 17. Zhao Z., Lee C. C., Monckton D. G., Yazdani A., Coolbaugh M. I., Li X., Bailey J., Shen Y., Caskey C. T. (1996) Characterization and genomic mapping of genes and pseudogenes of a new human protein-tyrosine phosphatase. Genomics 35, 172–181 [DOI] [PubMed] [Google Scholar]
- 18. Dumaual C. M., Sandusky G. E., Crowell P. L., Randall S. K. (2006) Cellular localization of PRL-1 and PRL-2 gene expression in normal adult human tissues. J. Histochem. Cytochem. 54, 1401–1412 [DOI] [PMC free article] [PubMed] [Google Scholar]
- 19. Matter W. F., Estridge T., Zhang C., Belagaje R., Stancato L., Dixon J., Johnson B., Bloem L., Pickard T., Donaghue M., Acton S., Jeyaseelan R., Kadambi V., Vlahos C. J. (2001) Role of PRL-3, a human muscle-specific tyrosine phosphatase, in angiotensin-II signaling. Biochem. Biophys. Res. Commun. 283, 1061–1068 [DOI] [PubMed] [Google Scholar]
- 20. Franco D., de Boer P. A., de Gier-de Vries C., Lamers W. H., Moorman A. F. (2001) Methods on in situ hybridization, immunohistochemistry and β-galactosidase reporter gene detection. Eur. J. Morphol. 39, 169–191 [DOI] [PubMed] [Google Scholar]
- 21. Okada T., Hazeki O., Ui M., Katada T. (1996) Synergistic activation of PtdIns 3-kinase by tyrosine-phosphorylated peptide and βγ-subunits of GTP-binding proteins. Biochem. J. 317, 475–480 [DOI] [PMC free article] [PubMed] [Google Scholar]
- 22. Rossant J., Cross J. C. (2001) Placental development: lessons from mouse mutants. Nat. Rev. Genet. 2, 538–548 [DOI] [PubMed] [Google Scholar]
- 23. Lescisin K. R., Varmuza S., Rossant J. (1988) Isolation and characterization of a novel trophoblast-specific cDNA in the mouse. Genes Dev. 2, 1639–1646 [DOI] [PubMed] [Google Scholar]
- 24. Constância M., Hemberger M., Hughes J., Dean W., Ferguson-Smith A., Fundele R., Stewart F., Kelsey G., Fowden A., Sibley C., Reik W. (2002) Placental-specific IGF-II is a major modulator of placental and fetal growth. Nature 417, 945–948 [DOI] [PubMed] [Google Scholar]
- 25. Coan P. M., Conroy N., Burton G. J., Ferguson-Smith A. C. (2006) Origin and characteristics of glycogen cells in the developing murine placenta. Dev. Dyn. 235, 3280–3294 [DOI] [PubMed] [Google Scholar]
- 26. Watson E. D., Cross J. C. (2005) Development of structures and transport functions in the mouse placenta. Physiology 20, 180–193 [DOI] [PubMed] [Google Scholar]
- 27. Yang Z. Z., Tschopp O., Hemmings-Mieszczak M., Feng J., Brodbeck D., Perentes E., Hemmings B. A. (2003) Protein kinase Bα/Akt1 regulates placental development and fetal growth. J. Biol. Chem. 278, 32124–32131 [DOI] [PubMed] [Google Scholar]
- 28. Dackor J., Caron K. M., Threadgill D. W. (2009) Placental and embryonic growth restriction in mice with reduced function epidermal growth factor receptor alleles. Genetics 183, 207–218 [DOI] [PMC free article] [PubMed] [Google Scholar]
- 29. Lopez M. F., Dikkes P., Zurakowski D., Villa-Komaroff L. (1996) Insulin-like growth factor II affects the appearance and glycogen content of glycogen cells in the murine placenta. Endocrinology 137, 2100–2108 [DOI] [PubMed] [Google Scholar]
- 30. Torres J., Pulido R. (2001) The tumor suppressor PTEN is phosphorylated by the protein kinase CK2 at its C terminus: implications for PTEN stability to proteasome-mediated degradation. J. Biol. Chem. 276, 993–998 [DOI] [PubMed] [Google Scholar]
- 31. Valiente M., Andrés-Pons A., Gomar B., Torres J., Gil A., Tapparel C., Antonarakis S. E., Pulido R. (2005) Binding of PTEN to specific PDZ domains contributes to PTEN protein stability and phosphorylation by microtubule-associated serine/threonine kinases. J. Biol. Chem. 280, 28936–28943 [DOI] [PubMed] [Google Scholar]
- 32. Subauste M. C., Nalbant P., Adamson E. D., Hahn K. M. (2005) Vinculin controls PTEN protein level by maintaining the interaction of the adherens junction protein β-catenin with the scaffolding protein MAGI-2. J. Biol. Chem. 280, 5676–5681 [DOI] [PubMed] [Google Scholar]
- 33. Baker J., Liu J. P., Robertson E. J., Efstratiadis A. (1993) Role of insulin-like growth factors in embryonic and postnatal growth. Cell 75, 73–82 [PubMed] [Google Scholar]
- 34. Maehama T., Dixon J. E. (1998) The tumor suppressor, PTEN/MMAC1, dephosphorylates the lipid second messenger, phosphatidylinositol 3,4,5-trisphosphate. J. Biol. Chem. 273, 13375–13378 [DOI] [PubMed] [Google Scholar]
- 35. Garcia-Cao I., Song M. S., Hobbs R. M., Laurent G., Giorgi C., de Boer V. C., Anastasiou D., Ito K., Sasaki A. T., Rameh L., Carracedo A., Vander Heiden M. G., Cantley L. C., Pinton P., Haigis M. C., Pandolfi P. P. (2012) Systemic elevation of PTEN induces a tumor-suppressive metabolic state. Cell 149, 49–62 [DOI] [PMC free article] [PubMed] [Google Scholar]
- 36. Alimonti A., Carracedo A., Clohessy J. G., Trotman L. C., Nardella C., Egia A., Salmena L., Sampieri K., Haveman W. J., Brogi E., Richardson A. L., Zhang J., Pandolfi P. P. (2010) Subtle variations in Pten dose determine cancer susceptibility. Nat. Genet. 42, 454–458 [DOI] [PMC free article] [PubMed] [Google Scholar]


