

Abstract
Interactions of the drug carbamazepine with the serum protein α1-acid glycoprotein (AGP) were examined by high-performance affinity chromatography (HPAC). Frontal analysis studies with an immobilized AGP column and control column indicated carbamazepine had both low affinity interactions with the support and high affinity interactions with AGP. When a correction was made for binding to the support, the association equilibrium constant measured at pH 7.4 and 37°C for carbamazepine with AGP was 1.0 (± 0.1) × 105 M−1, with values that ranged from 5.1 to 0.58 × 10⁵ M−1 in going from 5 to 45°C. It was found in competition studies that these interactions were occurring at the same site that binds propranolol on AGP. Temperature studies indicated that the change in enthalpy was the main driving force for the binding of carbamazepine to AGP. These results provide a more complete picture of how carbamazepine binds to AGP in serum. This report also illustrates how HPAC can be used to examine biological interactions and drug-protein binding in situations in which significant interactions for an analyte are present with both the chromatographic support and an immobilized ligand.
Keywords: Alpha 1-acid glycoprotein (AGP), Carbamazepine, Biointeraction analysis, Drug-protein binding, High-performance affinity chromatography
1. Introduction
Biointeraction analysis by high-performance affinity chromatography (HPAC) (i.e., an technique also known as “analytical affinity chromatography”, “quantitative affinity chromatography”, or “biointeraction chromatography”) makes use of a liquid chromatographic column that contains an immobilized affinity ligand to study a biological interaction [1–6]. This method has been used with HPLC-based systems in many recent studies to characterize drug interactions with serum proteins like human serum albumin (HSA), α1-acid glycoprotein (AGP) and lipoproteins [1–4,6–11]. Advantages of this approach include its speed, precision, its ease of automation, and its ability to work with small amounts of a target solute. This approach has also been found in many studies to give good agreement with solution-based methods for drug-protein binding studies [1–4,6–11].
Carbamazepine (see Figure 1) is an anticonvulsant and mood stabilizing drug that has a typical therapeutic concentration of 4–12 µg/mL. Carbamazepine been reported to have a relatively high affinity for AGP (~104-105 M−1) and a lower affinity for HSA (~103 M−1) [12–17]. This binding to plasma proteins generally involves 70–80% of the total carbamazepine that is present in blood [12]. AGP accounted for 20–30% of this binding [13]; however, the relative extent of this contribution can increase by several fold at low doses of carbamazepine or in disease states that give rise to elevated levels of AGP, such as inflammation and epilepsy [13,16,17].
Figure 1.

Structure of carbamazepine (i.e., 5H-dibenzo[b,f]azepine-5-caboxamide).
This study will use HPAC to examine the binding of carbamazepine to AGP. This work will make use of a recently-developed method for gently immobilizing AGP that has been shown to give good correlation with soluble AGP when used in drug binding studies [9,10]. This report will first use the method of frontal affinity chromatography (or “frontal analysis”) to obtain the association equilibrium constants and binding capacities for carbamazepine on the AGP column. Competitive binding zonal elution studies using propranolol as a site-selective probe for AGP will also be used to examine this binding. The results will then be compared to those obtained previously by other methods. This process will demonstrate how HPAC can be used in analyzing such a system in determining both the affinity and location of drug binding sites on a protein such as AGP. The data obtained should also provide a more complete picture of how carbamazepine binds to AGP and competes with other drugs for this protein in blood.
2. Theory
2.1. Frontal Affinity Chromatography
One tool that can be used to characterize the binding of a drug with an immobilized protein in a column is frontal affinity chromatography. As shown in Figure 2(a), this approach involves the continuous application of a known concentration of the desired analyte (i.e., carbamazepine) to a column containing an immobilized ligand (AGP) while the amount of analyte that passes non-retained through the column is monitored. As the ligand becomes saturated with the applied analyte, the result is a breakthrough curve which contains information on the amount of active ligand in the column and the association equilibrium constants for the analyte with this ligand [2,5,6].
Figure 2.
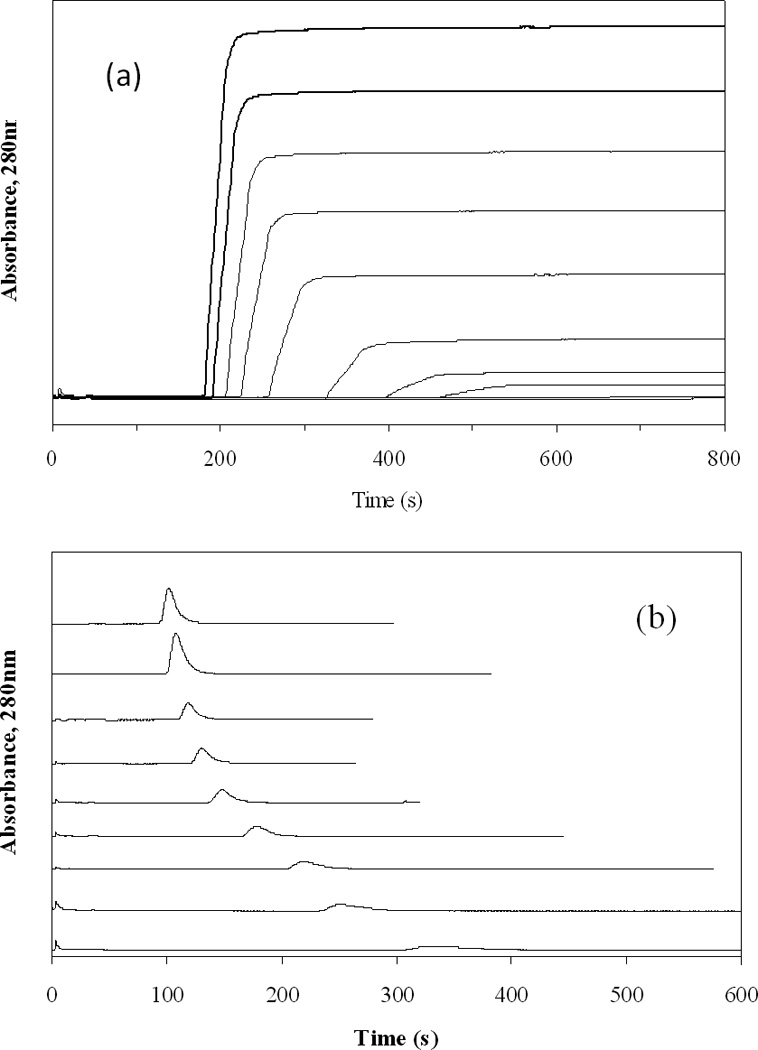
(a) Typical frontal analysis curves obtained for carbamazepine with immobilized AGP at pH 7.4 and 37°C and (b) competitive zonal elution studies obtained at pH 7.4 and 37°C for the injection of a trace amount S-propranolol into mobile phases containing known concentrations of carbamazepine as a competing agent. The concentrations of applied carbamazepine in (a) were (from left-to-right) 21.8, 18.2, 14.6, 10.9, 7.3, 3.6, 1.46, 0.73, 0.073, and 0.036 µM, respectively. The mobile phase concentrations of carbamazepine in (b) were (from left-to-right) 21.8, 18.2, 14.6, 10.9, 7.3, 3.6, 1.46, 0.73, 0.073, 0.036 and 0 µM. Other conditions are given in the text.
If there is relatively fast, reversible 1:1 interactions between an applied analyte (A) and immobilized ligand (L) during an experiment such as shown in Figure 2(a), Eqn. (1) can then be used to relate the apparent moles of analyte it takes to reach the mean point of the breakthrough curve (mLapp) to the applied concentration of the analyte.
| (1) |
In this equation, [A] is the molar concentration of analyte applied to the column, KA is the association equilibrium constant for the binding of A to L, and mLtot is the total number of moles of active L present in the column. This equation predicts for a system with single binding site that a double-reciprocal plot of 1/mLapp versus 1/[A] will give a linear response, where the inverse of the intercept provides the value of mLtot and the ratio of the intercept-to-slope gives KA [2].
An expanded version of Eqn. (1) is required if more than one type of binding site or ligand for A is present in a column. For example, if the column contains two classes of binding sites on a ligand (i.e., represented here by the symbols L1 and L2), Eqns. (2) and (3) can be used to relate the measured value of mLapp to the concentration of A that is being applied to the column [2,18].
| (2) |
| (3) |
In these equations mL1,tot and mL2,tot are total moles of L1 and L2 in the column, while KA1 and KA2 are association equilibrium constant for A with these binding agents. Unlike the one-site system represented by Eqn. (1), the two-site system in Eqn. (3) would not be expected to produce a linear response over all analyte concentrations in plots made of 1/mLtot versus 1/[A] (Note: the response of Eqn. (3) does approach a linear response at low analyte concentrations for a two-site system, but deviations from linearity will occur at high values of [A]) [18]. However, by using either Eqns. (2) and (3) it is still possible to examine frontal analysis data for a two-site system and to obtain quantitative information on the amount of each site (as represented by mL1,tot and mL2,tot) and their association equilibrium constants (KA1 and KA2).
2.2. Competition Studies based on Zonal Elution
Another approach that can be utilized in examining the binding of an analyte with an immobilized ligand is zonal elution. An example of such an experiment is shown in Figure 2(b). In this technique a small amount of analyte is typically injected onto the column in the presence of a known concentration of competing agent, I, while the retention factor of the analyte A (kA) is measured. If there is a relatively fast, reversible interaction of A and I with a single common binding site on L, the change in kA as the concentration of I is varied can be described by Eqn. (4).
| (4) |
In this equation, [I] is the molar concentration of I in the mobile phase, while KA and KI are the association equilibrium constants for the binding of A and I, respectively, at their common site on L. The term mLtot is the total moles of active sites for which A and I compete in their binding and VM is the column void volume. This relationship predicts that a plot of 1/kA versus [I] should give a linear response for the direct competition of A and I at a single site, in which the ratio of the slope and intercept provides the value of KI for the competing agent at its site of competition with A [2,19]. If allosteric interactions or multi-site competition is present between A and I, then deviations from linearity will occur in these plots. Similar expressions to Eqn. (4) can be derived for these more complex systems, such as for columns that have multiple binding sites for A and I or binding sites for A at which it does not compete with I [2].
Further information on the binding of an analyte at a given region on a ligand can be obtained by preparing a van’t Hoff plot according to Eqn. (5), making it possible to characterize the changes in enthalpy (ΔH) and entropy (ΔS) for the interaction [2].
| (5) |
In these expressions, ΔG is the total change in Gibbs free energy, R is the gas law constant, and T is the absolute temperature. To use this type of relationship, a plot of ln Ka versus 1/T is made for data acquired at multiple temperatures for the analyte at a given binding site. The intercept of this plot and the known value of R can then be used to find the change in entropy for this interaction, while the corresponding change in enthalpy can be found by using R and the slope of the plot [2].
3. Materials and Methods
3.1. Materials
The AGP (prepared from pooled human serum) was purchased from Sigma (St. Louis, MO) and had purity of at least 99.0%, as confirmed by SDS-PAGE. The carbamazepine and S-propranolol were also obtained from Sigma. The Nucleosil Si-300 silica (7 µm diameter, 300 Å pore size) was purchased from Alltech (Deerfield, IL). All other chemicals were of the purest grades available. All solutions were prepared using water from a Nanopure purification system (Barnstead, Dubuque, IA).
3.2. Apparatus
The chromatographic system consisted of a CM3000 solvent delivery system from Milton Roy (Riviera Beach, FL), a System Gold 118 solvent system from Beckman, two LabPro injection valves (Rohnert Park, FL), and a UV/Vis variable wavelength absorbance detector from LDC/Thermoseparations (Riviera Beach, FL). Samples were injected using a LabPro injection valve equipped with a 25 µL sample loop. Data were collected and processed using LabView 5.1 software from National Instruments (Austin, TX). The temperature of the columns and mobile phases was controlled using a PolyScience circulating water bath (VWR, Buffalo Grove, IL) and a water jacket from Alltech. All columns were packed using an HPLC column slurry packer from Alltech.
3.3. Methods
Nucleosil Si-300 silica was converted into a hydrazide-activated form by using a previously-described procedure [9,20]. Prior to its immobilization to this support, AGP was oxidized under mild conditions with periodic acid. This oxidation involved the reaction of 5.0 mg/mL AGP at 4°C and pH 7.0 with 10 mM periodic acid for 10 min, also as described previously [9]. Under such conditions, it has been found that there are up to five usable aldehyde groups generated per AGP molecule. These conditions have been shown to allow AGP to retain its drug binding activity while still providing a sufficient number of aldehyde groups for attachment of the oxidized AGP to hydrazide-activated silica [9]. After oxidation, the treated AGP solution was put into a dialysis bag and allowed to dialyze for 2 h at 4°C against 2 L of pH 7.0, 20 mM acetate buffer containing 0.15 M sodium chloride. This step was followed by three similar two-hour dialysis cycles against 2 L portions of pH 7.0, 0.10 M potassium phosphate buffer.
A 10 mL portion of the resulting AGP solution (containing approximately 5 mg/mL AGP) was mixed with 0.5 g of the hydrazide-activated silica and shaken at 4°C for 3 days. This support was then washed several times with 0.10 M, pH 7.0 phosphate buffer and water. After immobilization, the silica was reacted with an excess of glyceraldehyde to remove any remaining hydrazide groups [20]. The amount of immobilized AGP was determined by comparing the absorbance at 280 nm for the solution of AGP in the reaction slurry before and after immobilization. A control support was prepared in the same manner but with no AGP being added to the hydrazideactivated silica during the immobilization step.
The AGP support and control support were downward slurry-packed at 28 MPa (4000 psi) into separate 50 × 4.6 mm I.D. stainless steel columns using pH 7.4, 0.067 M phosphate buffer as the packing solution. The columns were stored in pH 7.4, 0.067 M phosphate buffer at 4° C when not in use. The immobilized AGP column was used over the course of three months and approximately 150 sample injections or 4,000 column volumes of the mobile phase. During this time, less than a 5% decrease in carbamazepine retention was noted, as measured by repeated zonal elution experiments at 37°C. Similar stability with AGP column has been noted in a previous report [9].
All mobile phases and analyte solutions were prepared using pH 7.4, 0.067 M potassium phosphate buffer. Prior to use, all mobile phases were filtered through a 0.45 µm cellulose acetate filter and degassed under vacuum for 10 min. The carbamazepine samples and solutions were prepared by diluting a 50 µM stock solution of this drug in pH 7.4, 0.067 M phosphate buffer. The propranolol samples and solutions were prepared by dissolving 50 µM S-propranolol in the pH 7.4 phosphate buffer. All working solutions were stored at 4°C and used within two days of preparation. Elution of carbamazepine and S-propranolol was detected by monitoring their absorbance at 280 or 225 nm, respectively. Although LC/MS has been used with frontal affinity chromatography and volatile buffers for screening drug candidates and ranking their relative affinities for ligands [1,6], the use of a pH 7.4 phosphate buffer to closely mimic physiological conditions for quantitative drug-protein binding studies made absorbance measurements a better choice as the detection method in this current report [1].
Frontal affinity chromatography was performed at 1.0 mL/min by continuously applying solutions containing 0.036 to 36 µM carbamazepine to the AGP column or control column in a pH 7.4, 0.067 M potassium phosphate buffer. The retained carbamazepine was later eluted by passing only the pH 7.4, 0.067 M phosphate buffer through the same columns. The amount of carbamazepine needed to saturate the column was determined by integration of the resulting breakthrough curves after correcting for the void time of the system (i.e., the latter being determined by injecting sodium nitrate on the column). Identical studies were performed on the control column to correct for non-specific binding of carbamazepine to the support. The resulting data were fit to various binding models, such as those represented by Eqns. (1)–(3), by using DataFit 8.1 software (Oakdale Engineering, Oakdale, PA, USA).
The mobile phase for the zonal elution competition studies was pH 7.4, 0.067 M potassium phosphate buffer that contained various concentrations of a competing agent. In the first set of zonal elution studies, 20 µL samples of a 5 µM solution of S-propranolol were injected in the presence of mobile phases containing 0 to 26 µM carbamazepine. In the second group of studies, 20 µL samples of 5 µM carbamazepine were injected in the presence of mobile phases containing 0 to 4.0 µM of S-propranolol. At each concentration of competing agent, three replicate injections of the desired analyte were made. The flow rates used for sample injection ranged from 0.8 to 2.0 mL/min (giving typical backpressures of 350 to 700 psi), with no significant changes in the retention factors being noted for carbamazepine or propranolol under this range of conditions. There was also no observed change in retention with small variations in the amount of injected carbamazepine or propranolol, indicating that linear elution conditions were present during these experiments. The retention times for carbamazepine and propranolol were calculated using PeakFit 4.12 (Jandel Scientific, Rafael, CA). The column void volume was determined by making injections of sodium nitrate. All elution times were corrected for the extra-column volume of the chromatographic system, as determined by making injections of sodium nitrate when no column was present.
4. Results and Discussion
4.1. Studies of Carbamazepine-AGP Binding by Frontal Affinity Chromatography
The binding of carbamazepine to the immobilized AGP column was first examined by using frontal affinity chromatography. Figure 2(a) shows breakthrough curves that were obtained for carbamazepine at pH 7.4 and at 37°C on the AGP column. Similar results were obtained at the other temperatures examined in this study. As is shown by this figure, the mean positions of the breakthrough curves shifted to shorter times as the concentration of applied carbamazepine was increased in the mobile phase. This shift was related to the moles of binding sites in the column, the concentration of applied carbamazepine, and the association equilibrium constants for carbamazepine at its binding sites in the column [2,5]. The breakthrough curve results obtained at various temperatures and concentrations of carbamazepine on the control column and AGP column are summarized in Tables 1 and 2. Examples of such data are also provided in Figures 3(a) and 3(b).
Table 1.
Association equilibrium constants and binding capacities measured for carbamazepine on a control column containing hydrazide-activated silica
| Temperature (°C) | Association equilibrium constant, KA (x 104 M−1) |
Binding capacity, mLtot (x 10−8 mol) |
|---|---|---|
| 5 | 6.5 (± 1.5) | 4.0 (± 0.1) |
| 15 | 5.7 (± 1.4) | 4.5 (± 0.2) |
| 25 | 3.7 (± 0.8) | 5.0 (± 0.1) |
| 37 | 2.4 (± 0.4) | 5.2 (± 0.1) |
| 45 | 1.9 (± 0.5) | 4.1 (± 0.1) |
All of these results were determined in pH 7.4, 0.067 M potassium phosphate buffer. Numbers in parentheses represent ± 1 S.D.
Table 2.
Association equilibrium constants and binding capacities estimated for carbamazepine on an immobilized AGP after correcting for secondary interactions with the support
| Temperature (°C) | Association equilibrium constant, KA (x 105 M−1) |
Binding capacity, mLtot (x 10−9 mol) |
|---|---|---|
| 5 | 5.1 (± 0.7) | 7.5 (± 0.2) |
| 15 | 3.1 (± 0.7) | 9.4 (± 0.7) |
| 25 | 1.6 (± 0.2) | 12.7 (± 0.1) |
| 37 | 1.0 (± 0.1) | 11.8 (± 0.1) |
| 45 | 0.58 (± 0.17) | 10.3 (± 0.2) |
All of these results were determined in pH 7.4, 0.067 M potassium phosphate buffer. Numbers in parentheses represent ± 1 S.D.
Figure 3.

Double-reciprocal plots prepared using data from frontal analysis curves obtained at 37°C and pH 7.4 for (a) carbamazepine on a control column containing hydrazide-activated silica and (b) carbamazepine on an AGP column. Other conditions are given in the text. These results were obtained in triplicate, with a typical precision of ± 5–6% (1 S.D.). The solid lines show best-fit response that was obtained when fitting Eqn. (1) to the entire data set in (a) or data the obtained between 0.073 and 22.0 µM carbamazepine in (b). The correlation coefficient for both of these best-fit lines was 0.999 (n = 9) over the given ranges of concentrations.
Figure 3(b) gives the plot of 1/mLapp versus 1/[Carbamazepine] that was prepared for the AGP column using the frontal analysis data. According to Eqn. (1), this type of graph should have given a linear response if there was only a single type of the binding site presented for carbamazepine on the immobilized AGP column. However, non-linear behavior was instead observed, suggesting that there were at least two different types of binding for carbamazepine with the AGP column. Similar non-linear behavior on the AGP column was seen for the same types of graphs that were prepared at all of the other temperatures examined in this study. As shown in the next section, it was found in work with both the control column and AGP column that one of these interactions was due to non-specific interactions of carbamazepine with the support, while the other involved specific interactions of carbamazepine with AGP.
4.2 Corrections for Non-specific Interactions of Carbamazepine
It was found in work with the control column that the curvature for the AGP column data in Figure 3(b) was a result of a non-specific binding of carbamazepine to the support material. This non-specific binding was further characterized by conducting frontal analysis experiments for carbamazepine on the control column. The resulting plot for the control column that was made according to Eqn. (1) at 37°C is shown in Figure 3(a). In this case, a good fit was obtained to a model with a single type of binding site, with a correlation coefficient of 0.999 for n = 9. Similar fits were obtained for the other temperatures that were examined in this study (correlation coefficients, 0.997–0.999 for n = 6 to 8). It was possible from the slopes and intercepts of this plot to obtain the apparent association equilibrium constant and moles of binding regions for carbamazepine due to these secondary interactions. The resulting values that were determined are summarized in Table 1.
The results obtained for the binding of carbamazepine to the support were next used to correct for such binding in the AGP column. This was done by using a two-site model in which one of the two sites represented binding by carbamazepine to the support. A typical fit that was initially obtained by this approach is shown in Figure 4 for a plot that was made according to Eqn. (2). In this particular case, the association equilibrium constant for the low affinity interactions with the support was fixed as the same value as measured on the control column but the best-fit binding capacity of these interaction was allowed to vary. It was now found that plots made according to Eqn. (2) and a two-site model gave a good fit to the data obtained on the AGP column at each of the temperatures studied. The correlation coefficients for these plots ranged from 0.997 to 0.999 (n = 6 to 9) and residual plots gave only random variations about the best-fit response (e.g., see inset in Figure 4).
Figure 4.

Fit of frontal analysis data for carbamazepine on an AGP column to a two-site model. This example was obtained using the results for the AGP and control columns in Figure 3. These results were obtained in triplicate, with a typical precision of ± 5–6% (1 S.D.). The best-fit line was obtained by using Eqn. (2) along with the association equilibrium constant and estimated moles of binding regions for one of the two sites based on values measured for carbamazepine on the control column in Figure 3(b). The correlation coefficient for this fit was 0.999 (n = 9). The inset shows the residual plot for this fit, in which the residual values on the y-axis represent the difference between the actual and best-fit response at a given concentration of carbamazepine.
It was found in these studies that the moles of low affinity sites due to interactions of carbamazepine with the support gave a result that was an average of 77% of initial value determined for the control support in the absence of immobilized AGP. This result agreed with calculations based on the known amount of immobilized AGP and the estimated surface area of this protein, as based on its reported diffusion coefficient and corresponding hydrated radius (i.e., 6.3 × 10⁻⁷ cm2/s and 34 Å, respectively) [21]. It was then possible to use this correction factor of 77% for the binding capacity of the support in the presence of AGP to calculate and subtract the expected contribution of the support for all breakthrough results obtained on the AGP column.
The association equilibrium constants that were measured by this approach for the binding of carbamazepine with AGP are summarized in Table 2. These values ranged from 5.8 × 10⁴ M−1 at 45°C to 5.1 × 10⁵ M−1 at 5°C. This range is comparable to values of 104–105 M−1 that have previously been reported for carbamazepine with soluble AGP [13,16,22]. Earlier work with serum and equilibrium dialysis suggested that AGP was binding to carbamazepine with an affinity of 2.4 × 10⁴ M−1 [22]. A value of 5.3 × 10⁴ M−1 has been measured at 25°C using ultrafiltration and soluble AGP, while a value of 1.7 × 10⁴ M−1 has been reported at 37°C using soluble AGP and equilibrium dialysis [13,16].
4.3. Competition of Carbamazepine with Propranolol for AGP
Zonal elution studies were used to examine the competition between carbamazepine and propranolol on the AGP column. This was of interest because propranolol is known to have a single binding site on AGP and has well-characterized association equilibrium constants for this interaction [10,23–26]. This made propranolol useful as a site-selective probe to see if carbamazepine was binding to the same region on AGP.
Figure 5 gives the results of an experiment in which carbamazepine was placed in the mobile phase as a competing agent and S-propranolol was injected as the analyte. In this case a plot of 1/k for S-propranolol versus the concentration of carbamazepine gave a linear relationship with a correlation coefficient of 0.991 (n = 6). This confirmed the presence of competition between carbamazepine and propranolol on the AGP column. From the slope and intercept of this plot it was determined that the association equilibrium constant for carbamazepine at this site of competition was 4.5 (± 0.3) × 104 M−1. This value was consistent with the range of association equilibrium constants estimated for the binding of carbamazepine with AGP in the frontal analysis studies. This result, and the good fit of the competition data to the one-site model represented in Eqn. (4), indicated that the competition between carbamazepine and propranolol was occurring at the binding site for propranolol on AGP.
Figure 5.

Competition and zonal elution studies examining the retention of S-propranolol on an AGP column as various concentrations of carbamazepine were placed into the mobile phase. These measurements were made at 37°C and pH 7.4. Other conditions are given in the text. The error bars represent a range of ± 1 S.D. The solid line shows the best-fit response that was obtained when fitting Eqn. (4) to the entire data set, giving a correlation coefficient of 0.991 (n = 6).
4.4 Temperature Dependence of Carbamazepine-AGP Binding
Further information on the interactions of carbamazepine with AGP was obtained by examining the temperature dependence of this binding. For instance, the data obtained by frontal affinity chromatography in Table 2 shows that the association equilibrium constant for this interaction decreased as the temperature was raised from 5 to 45°C. A similar trend has been noted for the binding of carbamazepine to HSA [15] and in the binding of other compounds to AGP [9]. This trend was analyzed in a more quantitative fashion by preparing a van’t Hoff plot to estimate the changes in enthalpy (ΔH) and entropy (ΔS) for carbamazepine-HSA binding. Figure 6 shows the result that was obtained when the data in Table 2 were plotted according to Eqn. (5). This plot gave a linear relationship over the temperature range of 5 to 45°C, with a correlation coefficient of 0.995 (n = 5).
Figure 6.

Van’t Hoff plot prepared using the association equilibrium constants measured for the binding of carbamazepine with AGP. The best-fit line was obtained when fitting Eqn. (5) to the entire data set, giving a correlation coefficient of 0.996 (n = 5).
The values of ΔH and ΔS for the binding of carbamazepine with AGP were determined from the slopes and intercept of Figure 6. Using this process, values of −39.4 (± 1.9) kJ/mol for ΔH and −32.2 (± 6.3) J/(mol·K) for ΔS were obtained. The calculated value of ΔG at 37°C was −29.4 (± 2.7) kJ/mol. Combining this information made it possible to determine that the enthalpy term made up most of the change in energy at 37°C (ΔH = −39.4 kJ/mol), which indicated that the binding of carbamazepine to AGP at this temperature was an enthalpy-driven process. This interaction was accompanied by a smaller but unfavorable entropy term (–TΔS = 10.0 kJ/mol) at 37°C, which represented a decrease in entropy of the system as carbamazepine was bound by AGP.
5. Conclusions
In this work, the biological interactions of carbamazepine with AGP were evaluated by HPAC. Frontal analysis gave nonlinear binding behavior for carbamazepine on the AGP column indicating more than one type of binding site was present. Work with a control column indicated that one group of these sites was due to the support material in the column, which made it possible to correct for such binding in the AGP column data. It was found with the corrected results that carbamazepine had single site binding to AGP and an association equilibrium constant that ranged from 0.58 × 10⁵ M−1 at 45°C to 5.1 × 10⁵ M−1 at 5°C. These values were in good agreement with general range of affinities that has been previously noted for carbamazepine with soluble AGP. Competition studies indicated that carbamazepine was interacting at the same binding site as propranolol on AGP. In addition, it was found in temperature studies that this reaction is mainly an enthalpy-driven process. These results provide a more complete picture of how carbamazepine binds to AGP in serum. In addition, this work demonstrated how HPAC can be used to provide detailed information on a drug-protein interaction. It was also shown how HPAC can be used to examine biological interactions in situations in which significant interactions for an analyte are present with both the chromatographic support and an immobilized ligand. The approach used in this study is not limited to carbamazepine and AGP but can also be used to examine the binding of other solutes and ligands.
Acknowledgements
This work was support by the National Institutes of Health (NIH) under grant R01 GM044931. This work was performed in facilities renovated under NIH grant RR015468-01.
Abbreviations
- AGP
α1-acid glycoprotein
- HPAC
high-performance affinity chromatography
- HSA
human serum albumin
References
- 1.Hage DS, Jackson A, Sobansky MR, Schiel JE, Yoo MJ, Joseph KS. J. Sep. Sci. 2009;32:835–853. doi: 10.1002/jssc.200800640. [DOI] [PMC free article] [PubMed] [Google Scholar]
- 2.Chen J, Hage DS. Ch.22. In: Hage DS, editor. Handbook of Affinity Chromatography. 2nd edn. New York: Taylor & Francis; 2006. [Google Scholar]
- 3.Winzor DJ. Ch. 23. In: Hage DS, editor. Handbook of Affinity Chromatography. 2nd edn. New York: Taylor & Francis; 2006. [Google Scholar]
- 4.Patel S, Wainer IW, Lough WJ. Ch. 24. In: Hage DS, editor. Handbook of Affinity Chromatography. 2nd edn. New York: Taylor & Francis; 2006. [Google Scholar]
- 5.Chaiken IM. Analytical Affinity Chromatography. Boca Raton: CRC Press; 1987. [Google Scholar]
- 6.Schiel JE, Joseph KS, Hage DS. Ch. 4. In: Grinsberg N, Grushka E, editors. Advances in Chromatography. Vol. 48. New York: Taylor & Francis; 2009. [Google Scholar]
- 7.Domenici E, Bertucci C, Salvadori P, Motellier S, Wainer IW. Chirality. 1990;2:263–268. doi: 10.1002/chir.530020412. [DOI] [PubMed] [Google Scholar]
- 8.Chen J, Hage DS. Nature Biotechnol. 2004;22:1445–1448. doi: 10.1038/nbt1022. [DOI] [PubMed] [Google Scholar]
- 9.Xuan H, Hage DS. Anal. Biochem. 2005;346:300–310. doi: 10.1016/j.ab.2005.08.025. [DOI] [PubMed] [Google Scholar]
- 10.Mallik R, Xuan H, Guiochon G, Hage DS. Anal. Biochem. 2008;376:154–156. doi: 10.1016/j.ab.2008.01.035. [DOI] [PMC free article] [PubMed] [Google Scholar]
- 11.Chen S, Sobansky MR, Hage DS. Anal. Biochem. 2010;397:107–114. doi: 10.1016/j.ab.2009.10.017. [DOI] [PMC free article] [PubMed] [Google Scholar]
- 12.Bertilsson L. Clin. Pharmacokinet. 1978;3:128–143. doi: 10.2165/00003088-197803020-00003. [DOI] [PubMed] [Google Scholar]
- 13.MacKichan JJ, Zola EM. Br. J. Clin. Pharmacol. 1984;18:487–493. doi: 10.1111/j.1365-2125.1984.tb02496.x. [DOI] [PMC free article] [PubMed] [Google Scholar]
- 14.Lai CM, Moore P, Quon CY. Res. Commun. Mol. Pathol. Pharmacol. 1995;88:51–62. [PubMed] [Google Scholar]
- 15.Kim HS, Hage DS. J. Chromatogr. B. 2005;816:57–66. doi: 10.1016/j.jchromb.2004.11.006. [DOI] [PubMed] [Google Scholar]
- 16.Contin M, Riva R, Albani F, Perucca E, Lamontanara G, Baruzzi A. Eur. J. Clin. Pharmacol. 1985;29:211–214. doi: 10.1007/BF00547424. [DOI] [PubMed] [Google Scholar]
- 17.Kodama Y, Kuranari M, Tsutsumi K, Okamoto T, Kodama H, Yasunaga F, Fujii I, Takeyama M. Int. J. Clin. Pharmacol. Ther. 1994;32:618–621. [PubMed] [Google Scholar]
- 18.Tweed SA, Loun B, Hage DS. Anal. Chem. 1997;69:4790–4798. doi: 10.1021/ac970565m. [DOI] [PubMed] [Google Scholar]
- 19.Loun B, Hage DS. J. Chromatogr. B. 1995;665:303–314. doi: 10.1016/0378-4347(94)00547-i. [DOI] [PubMed] [Google Scholar]
- 20.Ruhn PF, Garver S, Hage DS. J. Chromatogr. A. 1994;669:9–19. doi: 10.1016/0021-9673(94)80332-3. [DOI] [PubMed] [Google Scholar]
- 21.Kalous V, Poncova M. Coll. Czech. Chem. Comm. 1965;30:737–744. [Google Scholar]
- 22.MacKichan JJ, Zola EM. Br. J. Clin. Pharmacol. 1984;18:487–493. doi: 10.1111/j.1365-2125.1984.tb02496.x. [DOI] [PMC free article] [PubMed] [Google Scholar]
- 23.Wong AK, Hsia JC. Can. J. Biochem. Cell Biol. 1983;61:1114–1116. doi: 10.1139/o83-142. [DOI] [PubMed] [Google Scholar]
- 24.Mueller WE, Stillbauer AE. Naunyn-Schmiedeberg's Arch. Pharmacol. 1983;322:170–173. doi: 10.1007/BF00512392. [DOI] [PubMed] [Google Scholar]
- 25.Glasson S, Zini R, d'Athis P, Tillement JP, Boissier JR. Mol. Pharmacol. 1980;17:187–191. [PubMed] [Google Scholar]
- 26.Primozic S, McNamara PJ. J. Pharm. Sci. 1985;74:473–475. doi: 10.1002/jps.2600740421. [DOI] [PubMed] [Google Scholar]