

Abstract
Adverse effects on health mediated by increased plasma FFA concentrations are well established and older individuals are particularly susceptible to these effects. We sought to determine the effects of the amount of dietary fat on increasing the plasma FFA concentrations as a result of “spillover” of dietary fat into the plasma FFA pool during the postprandial period in older men. Healthy, older participants (63–71 y old) were studied in a randomized, crossover design following ingestions of low (LF) and moderate (MF) amounts of [1,1,1-13C]-triolein-labeled fat, corresponding to 0.4 and 0.7 g of fat/kg body weight, respectively. Spillover of dietary fatty acids into plasma during the 8-h postprandial period (AUC; mmol · L−1 · h) after MF ingestion was 1.2 times greater than that after LF ingestion (2.8 ± 0.4 vs. 1.2 ± 0.1; P < 0.05). The spillover of dietary fatty acids following the MF, but not the LF, ingestion was correlated with the percent body fat (rs = −0.89) and percent body fat-free mass (rs = 0.94) of the men (P < 0.05). After adjusting to the amount of ingested fat, the spillover of dietary fatty acids in the MF trial was disproportionally higher than that in the LF trial (P < 0.05), but the corresponding postprandial plasma TG responses did not differ between trials. In conclusion, spillover of dietary lipid into plasma is disproportionally increased at higher doses of dietary fat and this response is inversely related to adiposity in healthy men of advanced age.
Introduction
Because of the characteristic long duration of the responses associated with the absorption and disposal of dietary fat (i.e., up to 8 h), people spend the largest portion of each day in a state associated with postprandial lipid metabolism. Fasting-state metabolic responses, therefore, associated largely with the metabolism of endogenous fat, are not a direct reflection of dynamic circumstances associated with the metabolism of exogenous (i.e., dietary) fat consumed in various amounts. Dietary fat is traditionally studied with respect to its effects on plasma TG concentrations in the postprandial period. However, increasing the amount of ingested fat stimulates an increase of not only TG but also FFA in plasma and specifically FFA originating from the ingested fat. These dietary fatty acids appear in plasma because not all of the fatty acids released by the action of lipoprotein lipase on chylomicron-TG at the level of the capillary endothelium are directly taken up by the tissues. Some of these dietary fatty acids reenter into the circulation and contribute to the plasma FFA pool, a phenomenon termed “spillover” (1, 2).
To date, the physiological importance of the spillover of dietary fatty acids into plasma in health and disease is not known (3). However, it is known that increased plasma FFA concentrations are associated with increased risk for cardiovascular disease (4, 5). In this context, increased spillover of dietary lipid into plasma during the postprandial period contributing to increased plasma FFA concentrations becomes of clinical importance, especially when considering the overall increase in fat in the Western diet. Increased plasma FFA concentrations are of particular importance for the older segment of the population, because old age is already a risk factor for cardiovascular disease (6, 7). Furthermore, there is evidence for greater susceptibility to FFA-mediated adverse effects on health, such as insulin resistance (8), with aging.
In young individuals, ingestion of a relatively moderate amount of dietary fat (i.e., 0.6 g · kg body weight−1) results in postprandial plasma FFA concentrations similar to those following a low amount of dietary fat (i.e., 0.2 g · kg body weight−1) (9). We have shown that after ingestion of a moderate amount of dietary fat (0.7 g · kg body weight−1), older men respond with an apparently greater increase in the postprandial plasma FFA concentrations compared with younger men, an effect observed together with greater postprandial spillover of dietary lipid (10). We hypothesized that the postprandial spillover of dietary lipid induced by the ingestion of a moderate amount of dietary fat in older men can be attenuated by lowering the amount of ingested fat. The postprandial concentration of plasma TG is largely determined by the capacity to clear circulating TG. Because this capacity is maintained in older age (11), we also hypothesized that there is a more pronounced increase in plasma FFA concentrations compared with TG concentrations with the low-to-moderate increase in dietary fat.
Participants and Methods
Participants.
Exclusion criteria for participation included smoking, BMI >30 kg/m2, hypertension, diabetes, heart disease, peripheral vascular disease, history of liver or kidney disease, and use of any prescribed or over-the-counter medications. All participants who agreed to take part in the study underwent screening, which included a medical history report, physical examination, resting electrocardiogram, and routine blood and urine tests. All participants that were finally accepted to the study were determined to be healthy based on these screening procedures. Body composition was determined using bioelectrical impedance analysis (BIA6; Biodynamics BIA 310e). BIA was performed in the morning, and the participants had to adhere to specific standard instructions (12, 13) that included an overnight fast (i.e., no food, caffeine, alcohol), arriving adequately hydrated, and avoiding getting to the laboratory using means that require increased physical effort (i.e., walking, riding a bicycle). Upon arrival to the laboratory (∼0800 h), compliance with these instructions was verbally verified and the participants urinated prior to the BIA. The physical and clinical characteristics of those who participated in the study are shown in Table 1. All participants were Caucasian males. The study protocol was approved by the Institutional Review Board at Arizona State University. Consent was obtained from each participant after a full explanation of the purpose, nature, and risk of all procedures used.
TABLE 1.
Physical and clinical characteristics of the participants1
| Age, y | 67 ± 1 (63–71) |
| Weight, kg | 86 ± 2 (77–93) |
| Height, cm | 181 ± 2 (175–188) |
| BMI, kg/m2 | 26 ± 1 (24–28) |
| Body fat, % | 26 ± 1 (24–29) |
| Fat-free mass, kg | 63 ± 2 (58–69) |
| Plasma lipids, mmol/L | |
| TG | 0.8 ± 0.1 (0.4–1.1) |
| Total cholesterol | 4.7 ± 0.6 (3.1–6.7) |
| HDL-C | 1.4 ± 0.1 (0.8–1.8) |
| LDL-C | 2.3 ± 0.5 (0.7–3.7) |
| Plasma glucose, mmol/L | 5.0 ± 0.2 (4.3–5.7) |
| Plasma insulin, pmol/L | 42 ± 12 (22–98) |
| SBP, mm Hg | 127 ± 3 (11–135) |
| DBP, mm Hg | 75 ± 4 (64–90) |
Values are means ± SEM (range), n = 6. DBP, diastolic blood pressure; HDL-C, HDL-cholesterol; LDL-C, LDL-cholesterol; SBP, systolic blood pressure;.
Experimental protocol.
The participants took part in 2 fat-meal trials that were initiated in the morning following a 10-h overnight fast. The fat-meal trials were performed at least 1 wk apart in the Clinical Research Unit, employing a randomized, crossover design. The only difference between the 2 study days was the amount of fat ingested by each participant. Dietary fat was provided in the form of heavy whipping cream: low (LF) and moderate (MF) fat ingestions corresponding to 0.4 and 0.7 g · kg body weight−1, respectively. Some of the data related to the ingestion of the moderate amount of dietary fat were previously reported (10). Depending on the participant’s weight, 33–39 g of fat was ingested in the LF trial and 54–65 g was ingested in the MF trial. The macronutrient composition of the whipping cream was as follows (100 g): energy, 345 kcal; protein, 2.1 g; carbohydrate, 2.8 g; fat, 37.0 g; saturated fat, 23.0 g; monounsaturated fat, 10.7 g; polyunsaturated fat, 1.4 g.
During both trials, participants were asked to abstain from physical exercise, maintain their regular diet, and avoid alcohol consumption for 3 d prior to the fat-meal trial. Compliance with the instructions was verbally verified upon arrival at the Clinical Research Unit. Participants rested in bed for the duration of each fat-meal trial. First, an i.v. catheter was inserted into an antecubital vein of an arm for blood sampling and a baseline blood sample was collected under postabsorptive conditions ∼45 min later, followed immediately by the fat ingestion, which was completed within 15 min. The ingested fat was enriched with either 4 mg · kg body weight−1 (LF) or 7 mg · kg body weight−1 (MF) [1,1,1-13C]-triolein (Cambridge Isotope Laboratories) to track the fate of the ingested fat into the plasma FFA pool and its complete oxidation to CO2.
Blood samples were collected and gas exchange was monitored (TrueMax 2400 metabolic cart with ventilated hood; Parvo Medics) at the baseline and at 2-h intervals during the 8-h postprandial period. Part of the collected plasma was used for the separation of the chylomicron fraction of the plasma using a density-gradient ultracentrifugation procedure, as we previously described (10). Expired air samples were collected at the 2-h intervals for the determination of the 13C isotopic enrichment of expired CO2.
Analyses of samples.
Commercially available analytical procedures were used for the determinations of the plasma concentrations of TG (Sigma-Aldrich), FFA, and 3-hydroxybutyrate (3-HB; Wako Chemicals) as well as insulin (ALPCO Diagnostics). For the measurement of 13C-oleate enrichment in plasma lipids, TG from the chylomicron fraction of plasma and plasma FFA were isolated using TLC, as we previously described (10). The 13C-oleate enrichment of these plasma lipids (i.e., FAME) was determined using GC-MS (Thermo Scientific Trace GC Ultra-DSQ GC-MS system; Thermo Scientific) by selected ion monitoring of m/z 296 and 297 and expressed as tracer:tracee ratio (TTR). The collected expired air was analyzed for 13CO2 enrichment using a Finnigan BreathMat gas isotope ratio mass spectrometer by Metabolic Solutions (Metabolic Solutions).
Calculations.
The contribution of ingested lipid to the plasma FFA pool (i.e., relative dietary fatty acid spillover) was calculated by dividing the measured 13C-oleate TTR of plasma FFA by the 13C-oleate TTR of the ingested fat and expressed as a percent (1). The 13C-oleate enrichment of the ingested fat was calculated based on the precisely weighed amount of the heavy whipping cream, containing 9.3% oleic acid by weight (determined using a dietary analysis software), and the precisely weighed amount of labeled oleic acid added into the whipping cream. The concentration of plasma FFA from the ingested fat (FFAi) (i.e., absolute dietary fatty acid spillover) was calculated based on the percent contribution of ingested lipid to the plasma total FFA (FFAt). The concentration of plasma FFA from endogenous sources (FFAe) was calculated as the difference between the FFAt and FFAi. The rate of oxidation of the ingested fat was calculated based on the 13C enrichment of expired CO2 and the VCO2 production (L/min) using the formula below (10):
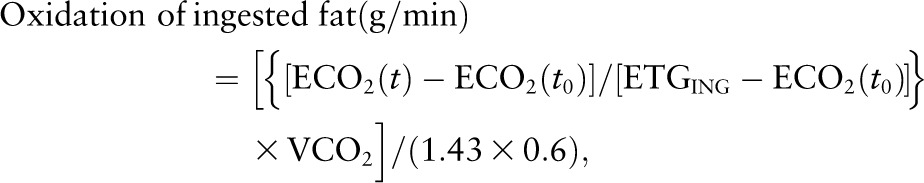 |
where ECO2(t) represents the enrichment of breath CO2 at time t (end of each 2-h period) and ECO2(t0) the enrichment of breach CO2 at time zero. ETGING corresponds to the ingested fat 13C enrichment, 1.43 to the amount of CO2 (L/g) associated with the oxidation of fat, and 0.6 is the acetate correction factor (14). ETGING was calculated based on the precisely weighed amounts of the ingested whipping cream/fat and the tracer added, as previously described by others (15). Fat oxidation was expressed in μmol · kg FFM−1 · min−1 based on the molecular weight of triolein (885 g/mol) and the FFM of the participants.
The responses of the variables of interest during the 8-h postprandial period were expressed as the incremental AUC (i.e., AUC relative to baseline).
Statistical analyses.
Minitab 15.1 statistical software was used for the statistical analyses. Given the small sample size, differences between the LF and MF trials for the variables of interest were compared using the nonparametric Wilcoxon’s Signed Rank test, because this test does not make any assumptions about the distribution of the data. Relations between variables were assessed using Spearman’s correlation coefficient (rs). Data are provided as both mean ± SEM and median (first quartile – third quartile). Significance was accepted at P <0.05.
Results
Plasma FFA.
Postabsorptive concentrations of FFA in plasma did not differ between the LF and MF trials. Figure 1A depicts the mean plasma FFAt concentrations during the 8-h postprandial period in the MF and LF trials. The mean postprandial plasma FFA response (AUC; mmol · L−1 · h) was 1.9 times greater in the MF trial [median: 2.2 (1.8 – 2.7)] than in the LF trial [median: 0.7 (0.4 – 1.3); P < 0.05; mean ± SEM data are depicted in the inset in Fig. 1A].
FIGURE 1.

Changes in plasma total (A), dietary (B), and endogenously produced (C) FFA concentrations in healthy older men following ingestion of LF and MF meals. The insets show the corresponding calculated AUC (mmol · L−1 · h) relative to baseline. Data are mean ± SEM, n = 6. *Different from LF, P < 0.05. LF, low fat; MF, moderate fat.
Figure 1B depicts the response of the plasma FFA concentrations originating from the ingested fat. The mean postprandial response (AUC; mmol · L−1 · h) was 1.3 times greater in the MF trial [median: 2.8 (1.8 – 3.8)] compared with the LF trial [median: 1.2 (1.0 – 1.5); P < 0.05; mean ± SEM data are depicted in the inset in Fig. 1B]. AUC (mmol · L−1 · h) for the plasma FFAe did not differ between the 2 trials (Fig. 1C). This was expected based on the experimental design (i.e., ingestion of mainly fat).
Relationship of spillover of dietary fat with physiologic variables.
The variability in the AUC values describing the response of plasma FFAi (i.e., spillover of dietary fat) in the MF trial was larger compared with that in the LF trial. The spillover of dietary fat was correlated with the percent body fat and the percent fat-free mass of the men during the MF trial (both P < 0.05) but not during the LF trial (Fig. 2). There was a trend for the spillover of dietary fat to correlate with the postabsorptive plasma FFA concentrations in the MF trial (rs = 0.77; P = 0.07) but not in the LF trial (rs = 0.14).
FIGURE 2.

Correlations between percentages of body fat (A,C) or fat-free mass (B,D) of healthy older men and plasma spillover of dietary fat in the 8-h period after ingestion of low (A,B) or moderate fat (C,D) meals.
Plasma TG.
The postabsorptive concentrations of TG in plasma did not differ between the LF and MF trials. The mean AUC (mmol · L−1 · h) describing the postprandial increase in plasma TG concentrations in the MF trial [median: 1.5 (0.8–2.6)] was ∼50% larger than that in the LF trial [median: 0.9 (0.6–1.9); P < 0.05; mean ± SEM data are depicted in the inset in Fig. 3].
FIGURE 3.

Change in plasma TG concentrations in healthy older men following ingestion of LF and MF meals. The inset shows the corresponding calculated AUC (mmol · L−1 · h) relative to baseline. Data are mean ± SEM, n = 6. *Different from LF, P < 0.05. LF, low fat; MF, moderate fat.
Changes in postprandial FFA and TG concentrations relative to the amount of ingested fat.
When the postprandial plasma FFA response (i.e., AUC; mmol · L−1 · h) was adjusted (i.e., divided) to the amount of fat ingested by each participant (g · kg body weight−1), the mean calculated ratio was 76% higher in the MF trial [mean: 3.3 ± 0.5; median: 3.2 (2.6 – 3.9)] compared with the LF trial [mean: 1.8 ± 0.4; median: 1.7 (0.9–3.0); P < 0.05]. However, the corresponding ratios for the postprandial plasma TG response did not differ between the MF [mean: 217 ± 54; median: 192 (106–328)] and the LF [mean: 242 ± 55; median: 196 (136–395)] trials.
Incorporation of the ingested tracer into the expired CO2 and oxidation of the ingested lipid.
The mean 13C enrichment of breath CO2 increased in both trials following the ingestion of the [1,1,1-13C]-triolein–labeled fat (data not shown). The rate of oxidation of the ingested lipid during the 8-h postprandial period and the percent of ingested fat that was oxidized in each trial are depicted in Supplemental Figure 1. The oxidation of ingested fat (g) did not differ between the MF [mean: 19.8 ± 2.6; median: 18.5 (14.3–25.4)] and LF [mean: 15.8 ± 2.6; median: 15.3 (10.2–19.9)] trials.
Incorporation of the ingested tracer into the plasma chylomicron-TG and FFA.
Figure 4A depicts the response of 13C-oleate enrichment of chylomicron-TG and Figure 4B depicts that of 13C-oleate enrichment of plasma FFA during the postprandial period. The calculated percent contribution of the ingested fat to the plasma FFA pool was higher in the MF trial [mean: 42 ± 3; median: 45 (33–47)] than in the LF trial [mean: 22 ± 2; median: 24 (16–27); P < 0.05].
FIGURE 4.

Change in isotope 13C-oleate enrichment of plasma chylomicron-TG (A) and FFA (B) in healthy older men following ingestion of LF and MF meals. The insets show the corresponding calculated AUC (% · h) relative to baseline. Data are mean ± SEM, n = 6. *Different from LF, P < 0.05. LF, low fat; MF, moderate fat.
Plasma insulin and 3-HB.
Postabsorptive plasma insulin concentrations did not differ between the 2 trials. Also, there was no difference between the AUC values describing the postprandial plasma insulin responses in the LF and MF trials (Supplemental Fig. 2).
The postabsorptive plasma 3-HB concentrations (μmol · L−1) were not different between the MF [mean: 66 ± 37; median: 33 (22–89)] and LF [mean: 53 ± 16; median: 45 (21–76)] trials. The mean postprandial plasma 3-HB response (AUC; mmol · L−1 · h) was 66% higher in the MF trial [mean: 1.5 ± 0.1; median: 1.6 (1.1–1.7)] compared with the LF trial [mean: 0.9 ± 0.1; median: 0.8 (0.7–1.1); P < 0.05].
Discussion
By challenging postprandial lipid metabolism in a dose-response manner, we showed that the spillover of dietary lipid into plasma disproportionately increases with the increase in the dose of ingested fat in older men. Increased spillover at a moderate dose of ingested fat was inversely correlated with the percentage of body fat. The present study also showed that the metabolic capacity to dispose of dietary fatty acids is lower than the capacity to regulate plasma TG metabolism during the postprandial period in older men.
Although the isotopic enrichment of the ingested fat was by design similar in the 2 trials, the isotopic enrichment of chylomicron-TG, which represents ingested fat, was lower in the LF than in the MF trial. Relatively larger “contamination” of the smaller chylomicron-TG amount with a given amount of endogenous/unlabeled TG from hepatic origin in the LF compared with the MF trial, and in association with the density-gradient ultracentrifugation used for the separation of plasma chylomicrons, may in part be responsible for this difference. However, physiological responses, such as a relatively lower rate of chylomicron-TG clearance following the larger amount of ingested fat, which the present study was not designed to investigate, are also expected to have played a role in the observed differences in the isotopic enrichment of chylomicron-TG between the 2 trials.
The absolute amount of dietary lipid spilled over into the circulation during the postprandial period was largely comparable across men at the lower dose of ingested fat, but it differed among men at the larger dose of ingested fat. An interesting observation at the larger dose of ingested fat was that the postprandial spillover of dietary fatty acids was greater in men with lower percent body fat. This association cannot be readily explained in the context of the health benefits associated with leaner body phenotype and when considering the evidence linking increased plasma FFA concentrations to increased risk for disease (4, 5, 8). Nevertheless, this association is in agreement with recent data by McQuaid et al. (16) for greater spillover of dietary lipid in leaner participants. Subcutaneous fat together with the splanchnic bed (17) are the major sources of postprandial spillover of dietary lipids into plasma during the postprandial period, because there is minimal spillover of dietary fatty acids from muscle (18). It is tempting to speculate that increased adipose tissue provides the potential/capacity for an overall greater postprandial uptake of chylomicron-TG–liberated fatty acids when increased amounts of dietary fat are ingested, thus minimizing spillover of dietary fatty acids into plasma. Support for this notion is provided by evidence showing that transgenic mice with expanded fat mass have more efficient disposal of dietary fat (19). Also, in men with a specific genetic phenotype characterized by a body fat-reducing allele of the locus near IRS1, low percent body fat is linked to increased, rather than decreased, risk for cardiovascular and metabolic diseases (20). It is apparent from the data in the present study that we are at only the beginning of our understanding of the relationship between spillover of dietary lipid and adiposity and how their interactions may contribute to increased disease risk.
There is a lack of evidence about the effects of varied amounts of ingested fat on the postprandial spillover of this fat into plasma (17). The present study fills that gap and it documents for the first time, to our knowledge, that reducing the amount of ingested fat reduces the extent of dietary fatty acid spillover into the plasma and its effects on expanding the plasma FFA pool. Increased concentrations of plasma FFA have been linked not only to increased risk for cardiovascular disease (4, 5) but also to impaired glucose metabolism (21, 22), hypertension (23), and systemic inflammation (24). Assuming adverse health outcomes as a result of increased plasma FFA concentrations (4, 5), consuming low amounts of dietary fat can minimize the extent to which this dietary fat contributes to the postprandial FFA concentrations and thus health-related risks in older men. Furthermore, whereas the plasma TG concentration as expected increased more following the higher dose of ingested fat, this increase was less pronounced compared with that of the plasma FFA when these responses were evaluated relative to the amount of ingested fat. In this regard, a low capacity to dispose of dietary fatty acids may be more clinically relevant than the concentration of the postprandial plasma TG with respect to the development and progression of advanced, age-related, adverse health conditions.
We focused our studies in healthy older men and therefore these findings are limited to men with normal clinical characteristics and BMI in the normal to overweight (i.e., not obese) range. Because glucose ingestion (25) and the associated insulin response (26–28) as well as protein ingestion (29) are all known to modify postprandial lipid responses, postprandial fat metabolism can be altered in various ways that depend largely on the specific amount, quality, and unique interactions of macronutrients ingested. Therefore, postprandial plasma lipid responses were evaluated following ingestion of mainly fat to describe changes associated with the postprandial metabolism of fat per se. We estimated instead of measuring the stable isotopic enrichment of the ingested fat, which can be considered a limitation in the present studies. However, similar to previous reports (15), this approach is considered adequate for addressing the purposes of this study.
In conclusion, when considering dietary practices for older men, low fat consumption minimizes the contribution of dietary lipid to the plasma FFA pool and this may decrease health risks mediated by increased plasma FFA concentrations. Interestingly, higher percent body fat in older men with BMI in the normal-to-overweight range relates to decreased accumulation of dietary lipid into the plasma FFA pool when large amounts of fat are consumed, a relationship that deserves further investigation.
Acknowledgments
The authors thank Yu-Hui H. Chang, Mayo Clinic Arizona Section of Biostatistics, for assistance with the statistical analyses, and Jeffrey L. Alexander, A.T. Still University, for assistance with the screening of the study participants. The authors gratefully thank Ken Kirschner for skillful technical assistance with the plasma chemistry measurements and GC-MS analyses. G.M.P. conducted the research, analyzed the data, and wrote the paper; C.M. designed and conducted the research; L.J.M. designed the research; and C.S.K. designed and conducted the research, analyzed the data, wrote the paper, and had primary responsibility for the final content. All authors read and approved the final manuscript.
Footnotes
Supported in part by Arizona State University funds (C.S.K.) and by NIH (R21DK082820) and American Diabetes Association (1-09-CR-39) grants (C.M.).
Supplemental Figures 1 and 2 are available from the “Online Supporting Material” link in the online posting of the article and from the same link in the online table of contents at http://jn.nutrition.org.
Abbreviations used: BIA, bioelectrical impedance analysis; FFAe, FFA from endogenous sources; FFAi, FFA from the ingested fat; FFAt, total FFA; 3-HB, 3-hydroxybutyrate; LF, low fat; MF, moderate fat; TTR, tracer:tracee ratio.
Literature Cited
- 1.Barrows BR, Timlin MT, Parks EJ. Spillover of dietary fatty acids and use of serum nonesterified fatty acids for the synthesis of VLDL-triacylglycerol under two different feeding regimens. Diabetes. 2005;54:2668–73 [DOI] [PubMed] [Google Scholar]
- 2.Miles JM, Nelson RH. Contribution of triglyceride-rich lipoproteins to plasma free fatty acids. Horm Metab Res. 2007;39:726–9 [DOI] [PubMed] [Google Scholar]
- 3.Lambert JE, Parks EJ. Postprandial metabolism of meal triglyceride in humans. Biochim Biophys Acta. 2012;1821:721–6 [DOI] [PMC free article] [PubMed] [Google Scholar]
- 4.Frayn KN, Williams CM, Arner P. Are increased plasma non-esterified fatty acid concentrations a risk marker for coronary heart disease and other chronic diseases? Clin Sci (Lond). 1996;90:243–53 [DOI] [PubMed] [Google Scholar]
- 5.Pilz S, Marz W. Free fatty acids as a cardiovascular risk factor. Clin Chem Lab Med. 2008;46:429–34 [DOI] [PubMed] [Google Scholar]
- 6.Grundy SM, Pasternak R, Greenland P, Smith S, Jr, Fuster V. AHA/ACC scientific statement: assessment of cardiovascular risk by use of multiple-risk-factor assessment equations: a statement for healthcare professionals from the American Heart Association and the American College of Cardiology. J Am Coll Cardiol. 1999;34:1348–59 [DOI] [PubMed] [Google Scholar]
- 7.Mensah GA, Brown DW. An overview of cardiovascular disease burden in the United States. Health Aff (Millwood). 2007;26:38–48 [DOI] [PubMed] [Google Scholar]
- 8.Einstein FH, Huffman DM, Fishman S, Jerschow E, Heo HJ, Atzmon G, Schechter C, Barzilai N, Muzumdar RH. Aging per se increases the susceptibility to free fatty acid-induced insulin resistance. J Gerontol A Biol Sci Med Sci. 2010;65:800–8 [DOI] [PMC free article] [PubMed] [Google Scholar]
- 9.Shishehbor F, Roche HM, Gibney MJ. The effect of low and moderate fat intakes on the postprandial lipaemic and hormonal responses in healthy volunteers. Br J Nutr. 1999;81:25–30 [PubMed] [Google Scholar]
- 10.Puga GM, Meyer C, Everman S, Mandarino LJ, Katsanos CS. Postprandial lipemia in the elderly involves increased incorporation of ingested fat in plasma free fatty acids and small (Sf 20–400) triglyceride-rich lipoproteins. Am J Physiol Endocrinol Metab. 2011;301:E356–61 [DOI] [PMC free article] [PubMed] [Google Scholar]
- 11.Aberg W, Thorne A, Olivecrona T, Nordenstrom J. Fat oxidation and plasma removal capacity of an intravenous fat emulsion in elderly and young men. Nutrition. 2006;22:738–43 [DOI] [PubMed] [Google Scholar]
- 12.Utter AC, Nieman DC, Ward AN, Butterworth DE. Use of the leg-to-leg bioelectrical impedance method in assessing body-composition change in obese women. Am J Clin Nutr. 1999;69:603–7 [DOI] [PubMed] [Google Scholar]
- 13.Chittawatanarat K, Pruenglampoo S, Kongsawasdi S, Chuatrakoon B, Trakulhoon V, Ungpinitpong W, Patumanond J. The variations of body mass index and body fat in adult Thai people across the age spectrum measured by bioelectrical impedance analysis. Clin Interv Aging. 2011;6:285–94 [DOI] [PMC free article] [PubMed] [Google Scholar]
- 14.Sidossis LS, Coggan AR, Gastaldelli A, Wolfe RR. A new correction factor for use in tracer estimations of plasma fatty acid oxidation. Am J Physiol. 1995;269:E649–56 [DOI] [PubMed] [Google Scholar]
- 15.Knuth ND, Horowitz JF. The elevation of ingested lipids within plasma chylomicrons is prolonged in men compared with women. J Nutr. 2006;136:1498–503 [DOI] [PubMed] [Google Scholar]
- 16.McQuaid SE, Hodson L, Neville MJ, Dennis AL, Cheeseman J, Humphreys SM, Ruge T, Gilbert M, Fielding BA, Frayn KN, et al. Downregulation of adipose tissue fatty acid trafficking in obesity: a driver for ectopic fat deposition? Diabetes. 2011;60:47–55 [DOI] [PMC free article] [PubMed] [Google Scholar]
- 17.Nelson RH, Basu R, Johnson CM, Rizza RA, Miles JM. Splanchnic spillover of extracellular lipase-generated fatty acids in overweight and obese humans. Diabetes. 2007;56:2878–84 [DOI] [PubMed] [Google Scholar]
- 18.Evans K, Burdge GC, Wootton SA, Clark ML, Frayn KN. Regulation of dietary fatty acid entrapment in subcutaneous adipose tissue and skeletal muscle. Diabetes. 2002;51:2684–90 [DOI] [PubMed] [Google Scholar]
- 19.Kim JY, van de Wall E, Laplante M, Azzara A, Trujillo ME, Hofmann SM, Schraw T, Durand JL, Li H, Li G, et al. Obesity-associated improvements in metabolic profile through expansion of adipose tissue. J Clin Invest. 2007;117:2621–37 [DOI] [PMC free article] [PubMed] [Google Scholar]
- 20.Kilpeläinen TO, Zillikens MC, Stancakova A, Finucane FM, Ried JS, Langenberg C, Zhang W, Beckmann JS, Luan J, Vandenput L, et al. Genetic variation near IRS1 associates with reduced adiposity and an impaired metabolic profile. Nat Genet. 2011;43:753–60 [DOI] [PMC free article] [PubMed] [Google Scholar]
- 21.Boden G. Obesity and free fatty acids. Endocrinol Metab Clin North Am. 2008;37:635–46 [DOI] [PMC free article] [PubMed] [Google Scholar]
- 22.Roden M, Price TB, Perseghin G, Petersen KF, Rothman DL, Cline GW, Shulman GI. Mechanism of free fatty acid-induced insulin resistance in humans. J Clin Invest. 1996;97:2859–65 [DOI] [PMC free article] [PubMed] [Google Scholar]
- 23.Umpierrez GE, Smiley D, Robalino G, Peng L, Kitabchi AE, Khan B, Le A, Quyyumi A, Brown V, Phillips LS. Intravenous intralipid-induced blood pressure elevation and endothelial dysfunction in obese African-Americans with type 2 diabetes. J Clin Endocrinol Metab. 2009;94:609–14 [DOI] [PMC free article] [PubMed] [Google Scholar]
- 24.Krogh-Madsen R, Plomgaard P, Akerstrom T, Moller K, Schmitz O, Pedersen BK. Effect of short-term intralipid infusion on the immune response during low-dose endotoxemia in humans. Am J Physiol Endocrinol Metab. 2008;294:E371–9 [DOI] [PubMed] [Google Scholar]
- 25.Cohen JC, Berger GM. Effects of glucose ingestion on postprandial lipemia and triglyceride clearance in humans. J Lipid Res. 1990;31:597–602 [PubMed] [Google Scholar]
- 26.Gormsen LC, Jensen MD, Schmitz O, Moller N, Christiansen JS, Nielsen S. Energy expenditure, insulin, and VLDL-triglyceride production in humans. J Lipid Res. 2006;47:2325–32 [DOI] [PubMed] [Google Scholar]
- 27.Harbis A, Defoort C, Narbonne H, Juhel C, Senft M, Latge C, Delenne B, Portugal H, Atlan-Gepner C, Vialettes B, et al. Acute hyperinsulinism modulates plasma apolipoprotein B-48 triglyceride-rich lipoproteins in healthy subjects during the postprandial period. Diabetes. 2001;50:462–9 [DOI] [PubMed] [Google Scholar]
- 28.Lewis GF, Uffelman KD, Szeto LW, Steiner G. Effects of acute hyperinsulinemia on VLDL triglyceride and VLDL apoB production in normal weight and obese individuals. Diabetes. 1993;42:833–42 [DOI] [PubMed] [Google Scholar]
- 29.Westphal S, Taneva E, Kastner S, Martens-Lobenhoffer J, Bode-Boger S, Kropf S, Dierkes J, Luley C. Endothelial dysfunction induced by postprandial lipemia is neutralized by addition of proteins to the fatty meal. Atherosclerosis. 2006;185:313–9 [DOI] [PubMed] [Google Scholar]