Abstract
Defining the key metabolic pathways that are important for fuel-regulated insulin secretion is critical to providing a complete picture of how nutrients regulate insulin secretion. We have performed a detailed metabolomics study of the clonal β-cell line 832/13 using a gas chromatography-mass spectrometer (GC-MS) to investigate potential coupling factors that link metabolic pathways to insulin secretion. Mid-polar and polar metabolites, extracted from the 832/13 β-cells, were derivatized and then run on a GC/MS to identify and quantify metabolite concentrations. Three hundred fifty-five out of 527 chromatographic peaks could be identified as metabolites by our metabolomic platform. These identified metabolites allowed us to perform a systematic analysis of key pathways involved in glucose-stimulated insulin secretion (GSIS). Of these metabolites, 41 were consistently identified as biomarker for GSIS by orthogonal partial least-squares (OPLS). Most of the identified metabolites are from common metabolic pathways including glycolytic, sorbitol-aldose reductase pathway, pentose phosphate pathway, and the TCA cycle suggesting these pathways play an important role in GSIS. Lipids and related products were also shown to contribute to the clustering of high glucose sample groups. Amino acids lysine, tyrosine, alanine and serine were upregulated by glucose whereas aspartic acid was downregulated by glucose suggesting these amino acids might play a key role in GSIS. In summary, a coordinated signaling cascade elicited by glucose metabolism in pancreatic β-cells is revealed by our metabolomics platform providing a new conceptual framework for future research and/or drug discovery.
Keywords: insulin secretion, islets, metabolism, metabolomics, multivariate analysis
Introduction
As a key regulator of whole body metabolism, the hormone insulin is secreted by pancreatic β-cells as a response to an elevation in nutrients. Defective insulin secretion resulting from dysfunctional β-cells is a major determinant leading to the development of type 2 diabetes.28,49 Understanding how the β-cell secretes insulin is critical to developing novel therapies to treat type 2 diabetes.
A key metabolic pathway regulating insulin release involves an increase in the ATP/ADP ratio leading to an inhibition of ATP-sensitive K+ (KATP) channels, plasma membrane depolarization, activation of voltage-gated Ca2+ channels, and influx of extracellular Ca2+ that leads to insulin granule exocytosis.18 This pathway, often referred to as the KATP channel-dependent pathway, is unable to fully explain the mechanism of GSIS. Studies over the last several decades have suggested that there is an unknown coupling factor that may act independently of KATP channels (referred to as the KATP channel-independent pathway or amplifying pathway).18,19 Strong evidence for the KATP channel-independent pathway(s) of GSIS has been provided by studies showing that glucose can still augment insulin secretion in islets from mice that lack functional KATP channels53 or in conditions where the KATP channels are held open using diazoxide followed by membrane depolarization with high K+.14 Some potential coupling factors that may act in a KATP channel-independent fashion include GTP,9,31,68 glutamate,4,46,47 malonylCoA/LC-CoA8,61 and NADPH.21,23,25,26
Most of these candidate coupling factors were discovered using enzyme based reactions that can only measure one metabolite at a time. However, metabolism itself is a complex network of interdependent chemical reactions catalyzed by highly regulated enzymes. Since β-cells rely on metabolism to regulate insulin secretion it is likely that multiple interconnected metabolic pathways are involved in this process. The discovery of the currently proposed candidate coupling factors was mainly based on manipulation of one single gene or enzyme, which could lead to false-positive or false negative observations. In some instances this has been demonstrated with the publication of contradictory results for some of these proposed coupling factors.5,41,47,52,61,64,73
Thus, the intrinsic disadvantage of the current traditional methods used to study β-cell metabolism requires a more comprehensive and powerful method/technology for reliable reconstruction of the metabolic networks in β-cells in response to experimental perturbations. This goal was, at least partially, fulfilled by the appearance of metabolomic platforms that simultaneously profiles (identify and quantify) a large array of metabolites.65
GC-MS based metabolomics is one of the most efficient metabolomics platforms because of the high separation efficiency to resolve the complex biological mixtures, comprehensive databases and the good reproducibility.10,65,69 As an integrated part of systems biology, metabolomics has certain advantages over other “omics” technologies, since metabolites are the end products of cellular biological process and their level ultimately reflects the most integrated response of a biological system. The net effect of genomic (~25,000 genes), transcriptomic (~100,000 transcripts) and proteomics (~1,000,000 proteins) is reflected in the net changes in metabolite levels in cells.3 Although this technology has been successfully applied in a number of studies including diabetes research,12 the techniques used in metabolomics still require further development. There is still a need for improved metabolite extraction methods that gives a better yield of the diverse chemicals found in cells, improved handling of the wide-ranging concentration of analytes, and improved data mining software to assess the “information-rich” data sets.29
In our study, a robust GC-MS based metabolomics strategy was applied to a clonal β-cell line 832/13 cells. A non-targeted metabolomic analysis was performed to reveal critical metabolic pathways that could play a key role in β-cell stimulus secretion coupling. We show that glucose initiates a series of signaling cascades in β-cells and provide evidence for key up- and downregulated pathways in β-cell metabolism.
Results
Insulin secretion.
Insulin secretion was assessed after incubating cells with low glucose (LG, 2 mM) or high glucose (HG, 16.7 mM) for 2 h. LG treated cells had an insulin output of 129 ± 5 ∝U insulin/mg protein and HG treated cells had an insulin output of 793 ± 80 ∝U insulin/mg protein. The fold increase in insulin output was 6.1 ± 0.6.
Metabolite analysis by GC/MS.
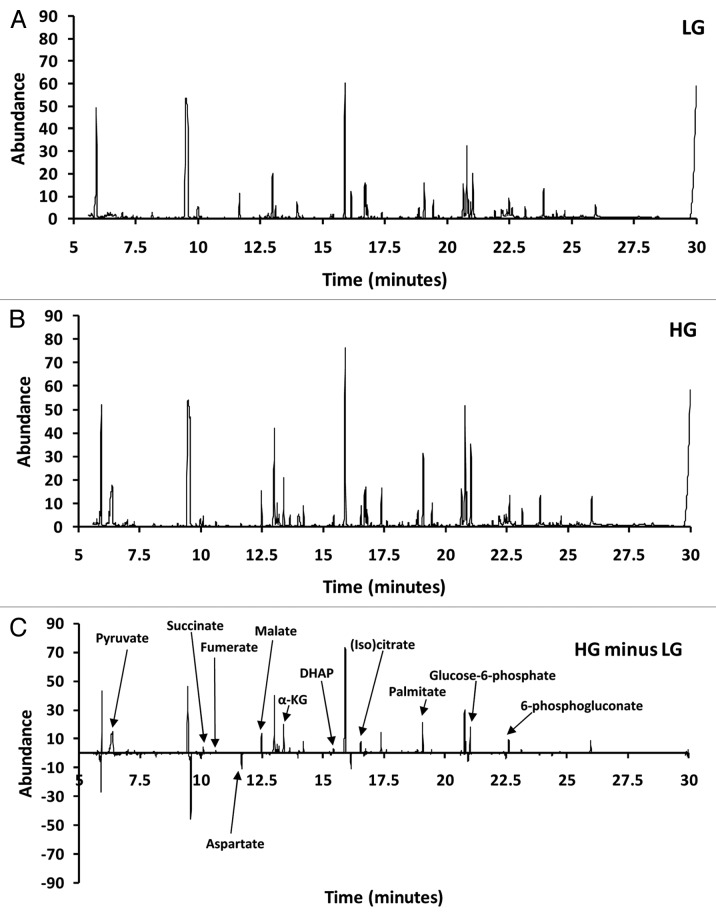
Cells treated with either LG or HG were harvested followed by metabolite extraction and then assessed using GC/MS (GC-Quadrupole MS in EI scan mode). A typical total ion chromatogram (TIC) from 832/13 β-cells is shown in Figure 1A for LG and Figure 1B for HG. Figure 1C shows the net difference (LG chromatogram subtracted from the HG chromatogram). Figure 1C demonstrates that some peaks were positive (upregulated) and others were negative (downregulated). For example, peaks for pyruvate, succinate, fumerate, malate, 〈-ketoglutarate, dihydroxyacetone phosphate (DHAP), (iso)citrate, palmitate, glucose-6-phosphate and 6-phosphoglucanate were all upregulated whereas aspartate was downregulated in response to glucose.
Figure 1. Representative total ion current chromatogram (TIC) of INS-1 832/13 β-cells. (A) TIC for LG. (B) TIC for high glucose (HG). (C) LG TIC subtracted from HG TIC.
Deconvolution and identification.
Deconvolution of the data set by AMDIS identified 527 unique chromatographic peaks (potential metabolites) across all data sets. The Fiehn library identified 152 of the 527 peaks using retention time and mass spectra, and of these identified metabolites 101 were unique (51 of the identified peaks were from metabolites that had multiple derivatization products). The remaining 375 peaks were assessed using the NIST library resulting in the identification of an additional 302 metabolites. Of the 302 identified metabolites 254 were unique metabolites (48 of the identified peaks by NIST were from metabolites that had multiple derivatization products). The remaining 73 peaks could not be identified using either the Fiehn or NIST libraries.
Orthogonal projection to latent structures (OPLS) analysis.
We constructed an OPLS model that accounts for metabolic variations related to high glucose treatment of our cells. The model generated only one principle component (PC1) that describes 92% of the variation in the X and Y matrixes (R2X = 0.92 and R2Y = 0.995). The R2X and R2Y values are a measure of fit, i.e., how well the model fits the X data set. The model also had three orthogonal components (R2Xo = 0.678). A large R2 (close to 1) is a necessary condition for a good model, but it is not sufficient. The Q2 value indicates how well the model (X) predicts new data (Y). A large Q2 (Q2 > 0.5) indicates good predictability. The model had an acceptable predictability of 93.5% (Q2 = 0.935). The orthogonal variation is likely composed technical and biological variation not related to treating cells with either LG or HG.
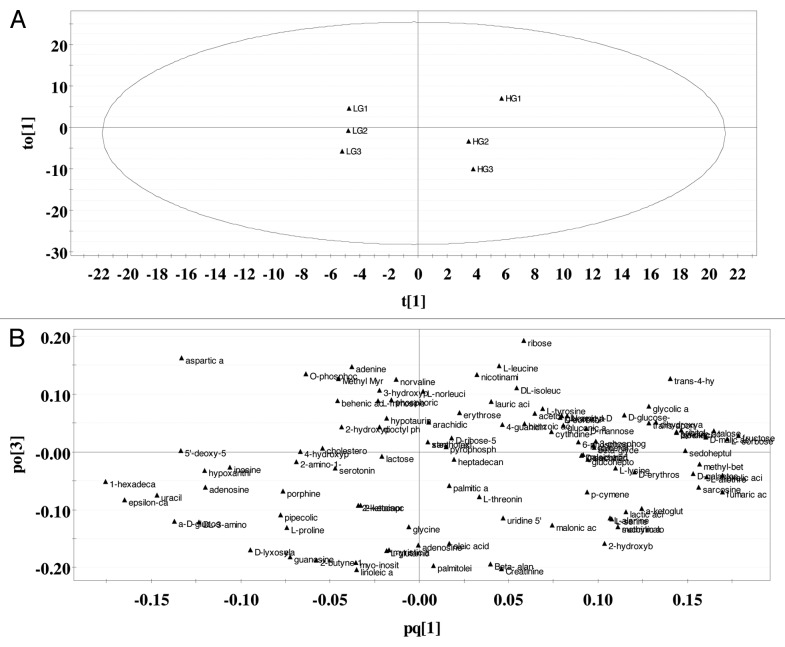
The score plot (Fig. 2A) and the loading plot (Fig. 2B) provide an overview of the OPLS model. For our single-Y OPLS/O2PLS model (a model that contains only one principle component), the score plot shows the first predictive component (PC1) vs. the first orthogonal component in X (Fig. 2A and t1 vs. to1). The score plot shows clustering of the LG data sets and clustering of the HG data sets along t[1]. The loading plot (Fig. 2B) illustrates which metabolites mainly account for the clustering seen in the score plot. In the loading plot, the metabolites furthest away from the origin of the coordinates along the first PC (X-axis) are considered biomarkers contributing most to GSIS.
Figure 2. Score and loading plots generated by OPLS on identified metabolites. (A) Score plot. Ellipse is Hotelling T2 (95% confidence). (B) Loading plot (n = 3).
Coefficient plots.
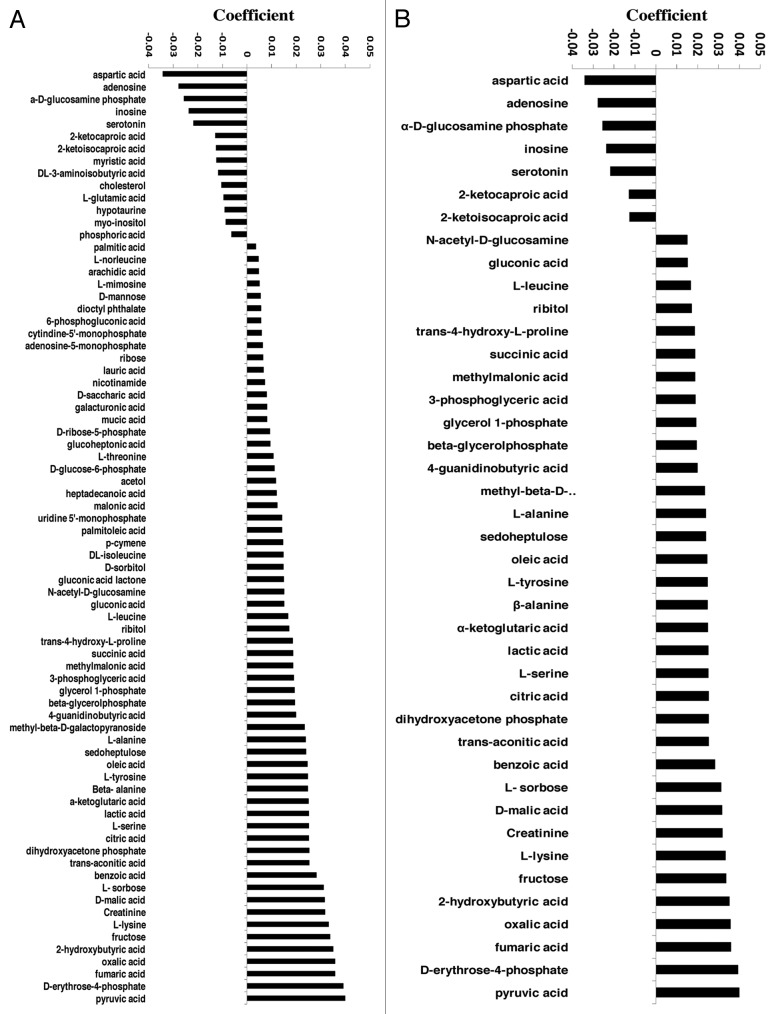
Figures 3A (all variables) and 3B (variables with a regression coefficient of less than 0.015 and greater than 0.015) show that at least 41 metabolites play a significant role in differentiating the 832/13 cells cultured at 2.0 mM glucose from those in 16.7 mM glucose. Among them, seven were negatively associated with GSIS and included aspartic acid, adenosine, 〈-D-glucosamine phosphate, inosine, serotonin, 2-ketocaproic acid and 2 ketoisocaproic acid. The remaining 34 were positively associated with GSIS.
Figure 3. Regression coefficient plots. (A) all variables (B) selected variables (variable coefficients that are less than -0.015 and greater than 0.015). The coefficients have the X-matrix scaled and centered and Y-matrix scaled. The regression coefficients are used for interpreting the influence of the variables in the X-matrix (metabolites) on Y-matrix (insulin secretion) (n = 3).
Metabolic pathway analysis.
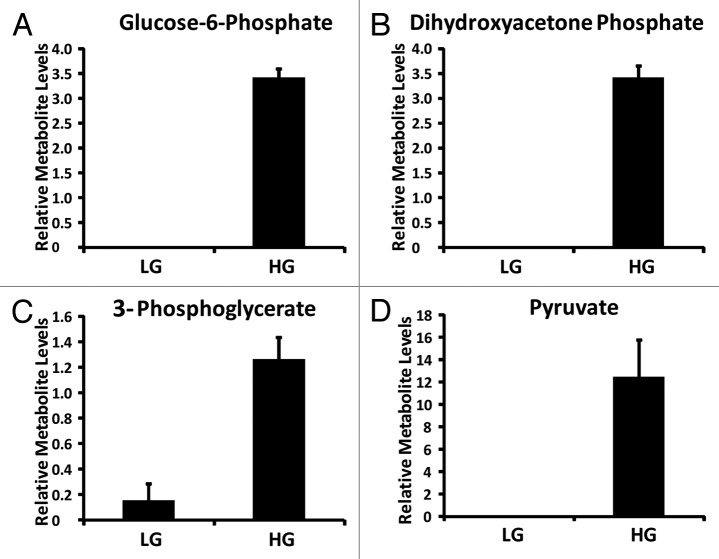
Forty-one metabolites differentiated the response of the 832/13 cells cultured at LG from those cultured at HG (Fig. 3B). These metabolites belong to a number of metabolic pathways including glycolysis, tricarboxylic acid cycle (TCA cycle), amino acid, fatty acid, pentose phosphate pathway and sorbitol-aldose reductase pathway. The coefficient plot confirms that glycolytic intermediates play a critical role in the insulin secretion response of β-cells to glucose. Key glycolytic metabolites identified in the current set of data include glucose-6-phosphate, dihydroxyacetone phosphate, 3-phosphglycerate and pyruvate (Fig. 4).
Figure 4. Relative glycolytic metabolite levels identified from INS-1 832/13 β-cells (LG = 2 mM glucose; HG = 16.7 mM glucose) (n = 3).
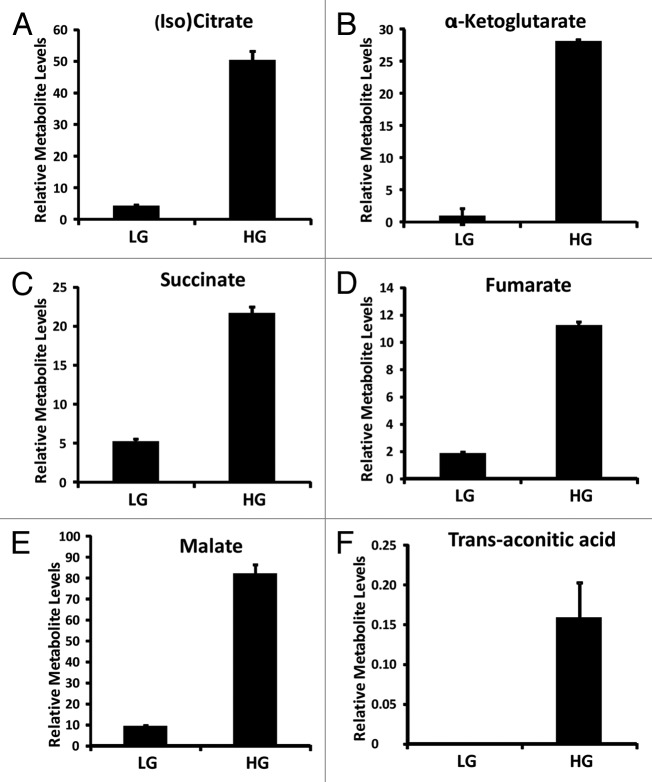
Anaplerosis, which is a net increase in TCA cycle intermediates, has also been suggested to play a key role in the metabolic regulation of insulin secretion.21,26,57 Key TCA cycle metabolites were identified in our OPLS model and include (iso)citrate, 〈-ketoglutarate, succinate, fumarate, malate and trans-aconitic acid (Fig. 5). Oxaloacetate and succinyl-CoA were not detected in our experiments. These TCA metabolites also contributed significantly to the clustering seen in INS-1 832/13 cells cultured at 16.7 mM glucose (Fig. 3B).
Figure 5. Relative TCA metabolite levels identified from INS-1 832/13 β-cells (LG = 2 mM glucose; HG = 16.7 mM glucose) (n = 3).
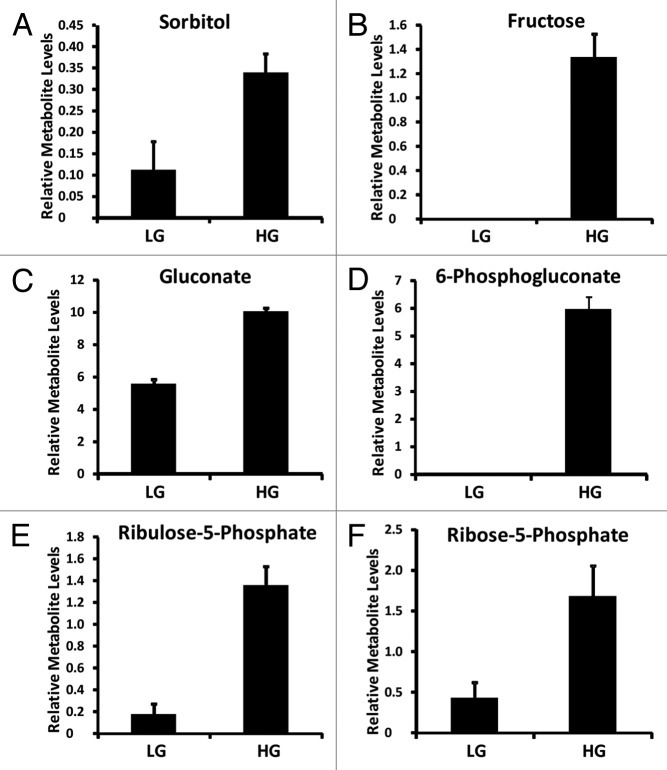
Interestingly, other metabolites were also strongly associated with insulin secretion as seen in our OPLS model coefficient plot (Fig. 3B). For example, sorbitol-aldose reductase pathway intermediates sorbitol, fructose, and pentose phosphate pathway intermediates 6-phosphogluconate, ribulose-5-phosphate, ribose-5-phosphate (Fig. 6).
Figure 6. Relative aldose reductase and pentose phosphate pathway metabolite levels identified from INS-1 832/13 β-cells (LG = 2 mM glucose; HG = 16.7 mM glucose) (n = 3).
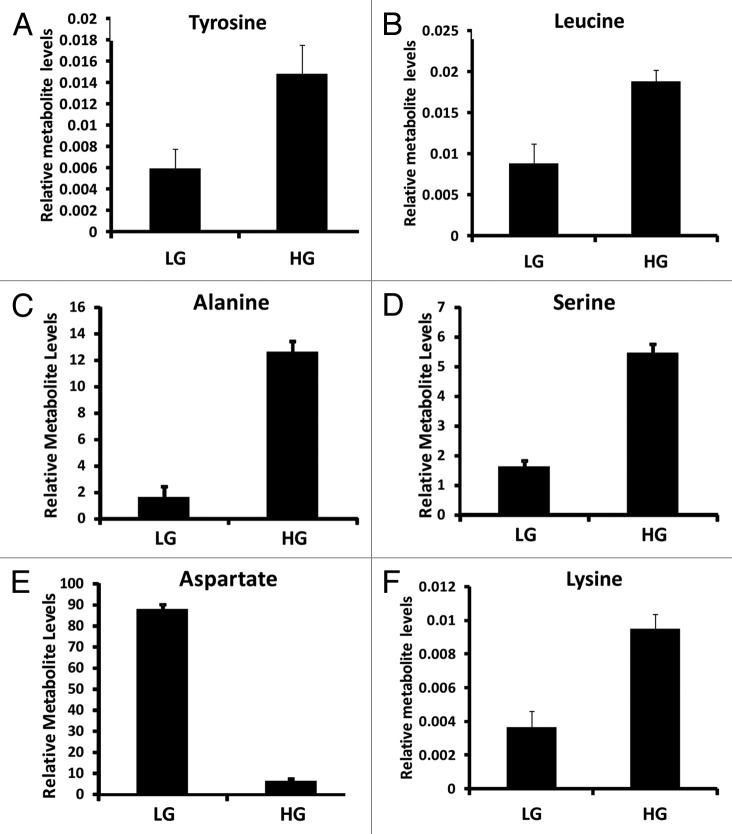
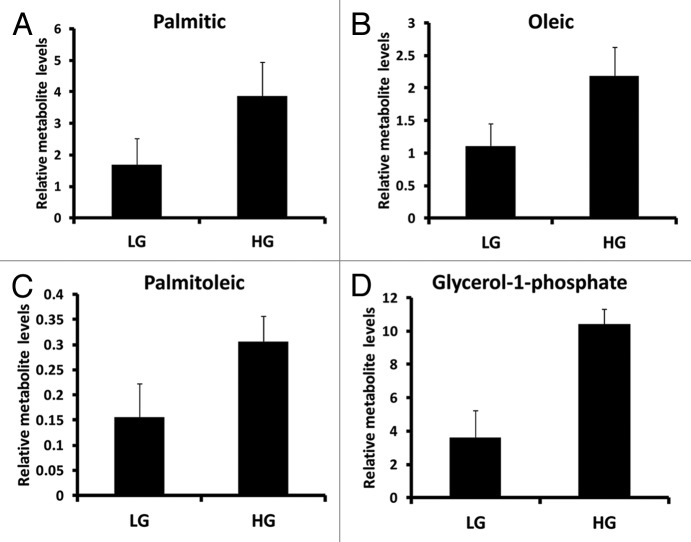
Amino acids leucine, lysine, tyrosine, alanine and serine were positively associated with clustering the INS-1 832/13 cell response to 16.7 mM glucose (Fig. 7). On other hand, aspartic acid was the most negatively associated metabolite contributing to clustering of the response of INS-1 832/13 cells to 16.7 mM glucose (Fig. 7). Intermediates associated with fatty acid metabolism were also identified in our coefficient plot including palmitic acid, oleic acid, palmitoleic acid, glycerol-1-phosphate (Fig. 8).
Figure 7. Relative amino acid metabolite levels identified from INS-1 832/13 β-cells (LG = 2 mM glucose; HG = 16.7 mM glucose) (n = 3).
Figure 8. Relative metabolite levels associated with fatty acid metabolism identified from INS-1 832/13 β-cells (LG = 2 mM glucose; HG = 16.7 mM glucose) (n = 3).
Role of the pentose phosphate pathway and sorbitol-aldose reductase pathway in insulin secretion.
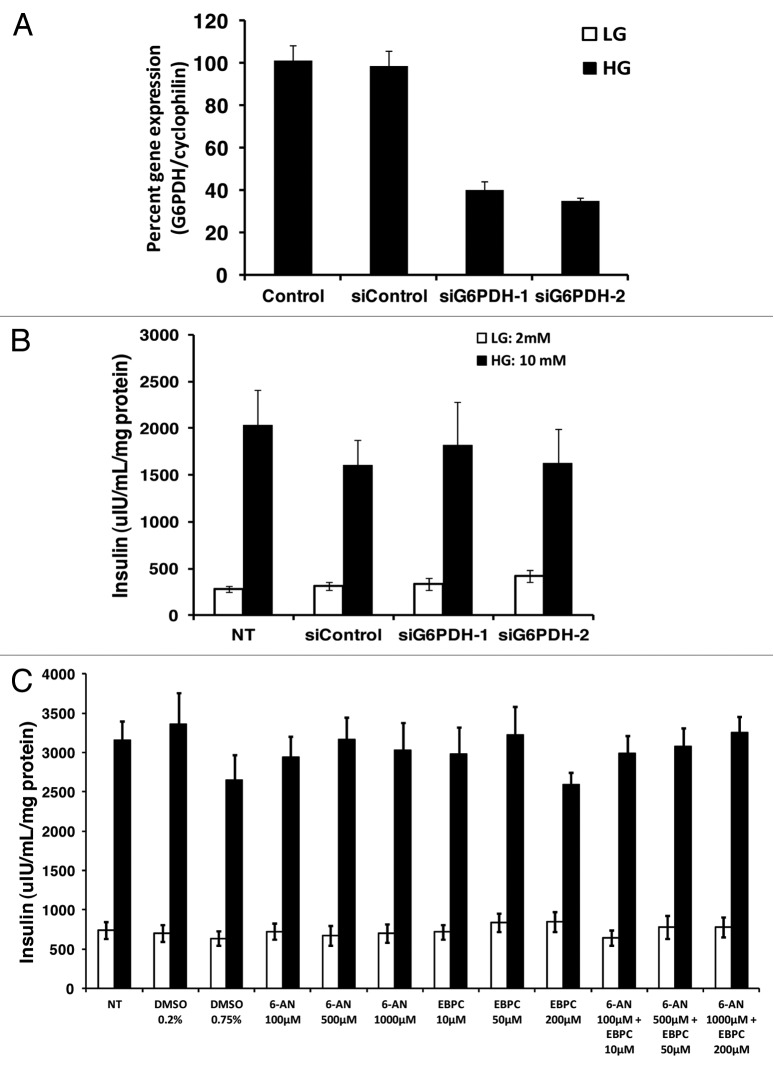
The role of the pentose phosphate pathway and sorbitol-aldose reductase pathway in insulin secretion is controversial.1,15,59,71,74 In order to assess the significance of flux through the pentose phosphate pathway, two siRNAs against the first enzyme in the pentose phosphate pathway, glucose-6-phosphate dehydrogenase (G6PDH), was used to assess the role of this enzyme in GSIS. The first siRNA (siG6PDH-1) and second siRNA (siG6PDH-2) both knockdown G6PDH mRNA by 60 ± 5% and 62 ± 6% respectively (Fig. 9A); however neither siRNA affected GSIS (Fig. 9B). 6-aminonicotinamide (6AN) was also used to inhibit the pentose phosphate pathway. 6-AN is an inhibitor of the NADP+ dependent enzyme, 6-phosphogluconate dehydrogenase.35 As compared with no treatment control or DMSO vehicle control 6-AN had no effect on GSIS at 100, 500, 1,000 ∝M (Fig. 9C). 2,5-Dihydro-4-hydroxy5-oxo-1-(phenylmethyl)-1H-pyrrole-3-carboxylic acid ethyl ester (EBPC), a specific inhibitor of the sorbitol-aldose reductase pathway enzyme aldose reductase, was used to test the role of this pathway in GSIS. 10, 50 and 200 ∝M EBPC had no effect on GSIS (Fig. 9C). It is possible that blocking flux to both of these pathways may also affect insulin secretion so we next tried a combination of both 6-AN and EBPC at 100–1,000 ∝M for 6-AN and 10–200 ∝M of EBPC and none of these combinations inhibited GSIS (Fig. 9C).
Figure 9. Role of the pentose phosphate pathway and sorbitol-aldose reductase pathway in GSIS. (A) percent gene expression after treating cells for 72 h with two siRNAs (siG6PDH-1 and siG6PDH-2) directed against G6PDH (n = 5). (B) effects of the two siRNAs against G6PDH on GSIS (n = 5). (C) Effects of pentose phosphate inhibitor 6-AN, aldose reductase inhibitor EBPC, or a combination of 6-AN and EBPC on GSIS (n = 4). Cells were treated with 6-AN and EBPC during the insulin secretion assay at the concentration indicated in the figure. Low glucose (LG) = 2 mM; high gluocse (HG) = 10 mM.
Discussion
Although GSIS has been extensively studied, the biochemical pathways linked to insulin secretion have not been completely defined. In our study, an unbiased GC-MS based non-targeted metabolomics approach was applied to INS 832/13 cells in order to gain insight into the metabolic regulation of insulin secretion. Overall, 527 chromatographic peaks (or potential metabolites) were detected of which 355 were identified as unique metabolites. Limiting the identification of unique metabolites from the 527 chromatographic peaks was partly due to the fact that some metabolites had multiple active functional groups that could be modified during the derivatization process. Using a combination of two libraries, the Fiehn library which identifies endogenous metabolites and the NIST library which identifies endogenous and exogenous metabolites, led to the identification of 355 unique metabolites. The number of identified metabolites is larger than other studies of β-cells using similar techniques.12,32,67 The most significant metabolites that differentiated low glucose treated cells from those treated with 16.7 mM glucose were identified by supervised pattern recognition using OPLS. Less than 8% of the information is lost during the analysis and there was only one principal component. Our OPLS model forms a good summary of the data set and has good predictability. Among all the metabolites detected by our system, 41 metabolites were found to be strongly associated with the metabolic response of cells to high glucose using our OPLS model.
The unique metabolic phenotype of β-cells allows these cells to sense blood glucose levels. This is formed partly from the expression of a combination of GLUT2 (high Km glucose transporter) and glucose phosphorylating enzyme glucokinase (hexokinase IV, GK).54 GLUT2 and GK allow for a continuous flux of glucose carbon to enter glycolysis in a dose dependent manner. Glycolysis is the first key step in glucose sensing and it has been suggested that signals derived from glycolysis play a role in insulin secretion.25,45 As expected glycolytic intermediates, including glucose-6-phosphate, dihydroxyacetone phosphate, 3-phosphglycerate and pyruvate, were elevated in response to treating cells with 16.7 mM glucose and these glycolytic metabolites were strongly associated with GSIS in our OPLS model. In addition to increased glycolytic flux, several other cytosolic pathways were also shown to be associated with GSIS in our OPLS model. These pathways include the pentose phosphate pathway (PPP), represented by 6-phosphogluconate, ribulose-5-phosphate, ribose-5-phosphate and the sorbitol-aldose reductase pathway (also known as the polyol pathway), represented by sorbitol and fructose in our metabolomics study. A key role for NADPH in regulating insulin release has been suggested (reviewed in refs. 22 and 25) and the PPP is one pathway that may produce NADPH for modulating insulin secretion. PPP plays a role in providing NADPH, ribose-5-phosphate for synthesis of nucleotides and nucleic acids, and erythrose-4-phosphate for synthesis of aromatic amino acids. The role of the PPP in insulin release is still being debated.1,15,59,71,74 The contribution of the PPP to total glucose utilization has been shown to be low in β-cells.17,37,66 Also, the oxidative portion of the PPP contributes a relatively small amount of the total glucose oxidation rate.66 It has been suggested that part of the reason for the low PPP activity in β-cells may be because of the glucose-stimulated increase in the cytosolic NADPH/NADP+ ratio21,63 which is thought to inhibit glucose-6-phosphate dehydrogenase (G6PDH) (the flux-generating enzyme of the PPP).2 Since the activity of the PPP is low, it has been suggested that it contributes very little to the overall generation of NADPH39 as compared with other NADPH producing pathways such as the pyruvate cycling pathways.22,25 However, the overall contribution of this pathway to NADPH production has not yet been directly studied. Interestingly, other studies have suggested that the PPP activity is dependent on glucose concentration and its enzyme transaldolase might be activated by glucose.71
Intravenous (IVGTT) and oral glucose tolerance tests (OGTT) in patients with G6PDH deficiency showed that first phase insulin release was defective in these individuals.50 Also more recently it has been shown that inhibition of G6PDH with siRNAs led to increased ROS, apoptosis, decreased proliferation and impaired insulin secretion.74 The impaired GSIS associated with long-term high glucose treatment of cells could be improved by overexpressing G6PDH.74 G6PDH deficient mice had smaller islets and impaired glucose tolerance which suggests an important role for the PPP in β-cells.74 Since our OPLS model also suggests that metabolites involved in PPP were associated with GSIS and this is consistent with previously published studies12 we performed further studies on the role of this pathway. Using both the PPP inhibitor 6-AN andsiRNAs against G6PDH, our results provide contradictory results suggesting that the PPP pathway is not involved in insulin secretion.
The sorbitol-aldose reductase pathway contributes only a small fraction of the total glucose utilization (both PPP and sorbitol-aldose reductase pathways do not exceed 10% of the overall glucose utilization66). Interestingly, the sorbitol-aldose reductase pathway enzyme, aldose reductase, which has a high Km value for glucose (20–200 mM) 7,51 can be stimulated by ATP and inhibited by ADP by about ± 20% over the physiological concentration range of these nucleotides.7 Another sorbitol-aldose reductase pathway enzyme, sorbitol dehydrogenase activity is also favored by high glucose usually accompanied by lower NADH levels.3,24 Treating cells with high glucose likely stimulates the sorbitol-aldose reductase pathway since glucose stimulates an increase in the NAD+/NADH ratio in β-cells. The sorbitol-aldose reductase pathway has been shown to play a role in GSIS in some studies13 and not in other studies.34,48 In one study, inhibitors of aldehyde and aldose reductases were shown not to inhibit GSIS or glucose metabolism in islets.34 Overexpression of aldose reductase lead to a reduction of the NADPH/NADP+ ratio and this was associated with β-cell apoptosis.16 In combination with the above discussed studies our studies also suggest that this pathway is upregulated in response to glucose in β-cells however it is unlikely this increase is relevant for insulin secretion since a specific inhibitor of aldose reductase does not inhibit GSIS.
To date, the PPP and sorbitol-aldose reductase pathways have only been studied individually, however, there may be potential for cross-talk between these two pathways. The sorbitol-aldose reductase pathway oxidizes NADPH whereas the PPP reduces NADPH which may allow both pathways to facilitate each other’s activity through the cyclic use of NADPH. In addition, increased sorbitol-aldose reductase pathway activity could provide fructose for glycosylation and glycerol production which has been suggested to be important for GSIS.58 Since there is significant flux into these pathways, inhibition of both the PPP and the sorbitol-aldose reductase pathway may promote greater flux through glycolysis and increase insulin secretion however we show that using inhibitors to both pathways does not inhibit insulin secretion. This suggests that although glucose can diverge away from glycolysis into the PPP and sorbitol-aldose reductase pathways this loss of flux into glycolysis does not affect insulin secretion.
The role of lipids in GSIS is controversial with numerous studies suggesting that glucose-stimulated lipid synthesis plays a role in insulin secretion8,55,56 whereas other studies provide evidence against this hypothesis.27,42,44,52,62 Most researchers in the area agree that intracellular levels of citrate, malonyl-CoA, palmitate and LC-CoA’s rise rapidly in β-cells exposed to elevated glucose concentrations. This evidence led to the proposed malonyl-CoA/LC-CoA hypothesis that states that pyruvate carboxylase (PC)-mediated replenishment of oxaloacetate in the TCA cycle facilitates the accumulation and escape of citrate from the mitochondrial matrix into the cytosol for lipid synthesis. The role of lipids in GSIS is supported by our data showing that the levels of palmitic acid, oleic acid, palmitoleic acid and lauric acid are elevated by treating cells with 16.7 mM glucose and were also identified by our OPLS model as significant metabolites contributing to clustering of high glucose treated cells.
Amino acids, leucine, lysine, tyrosine, alanine and serine were also shown to contribute significantly to clustering of high glucose treated cells in our OPLS model of insulin secretion. The significance of these amino acids in insulin secretion may be only to provide sufficient resources for insulin biosynthesis however it is also possible that they could be directly involved in regulating insulin release. Leucine is a known activator of glutamate dehydrogenase (GDH) 11 and increased GDH activity has been suggested to play a key role in GSIS.6 The elevated leucine levels seen in our studies provides further support for this role. One commonly mentioned amino acid associated with GSIS is glutamate. Glutamate was originally proposed as a potential coupling factor linking glucose metabolism to insulin secretion47 however this effect is controversial.41 In our study glutamate was not a significant player in our OPLS model and in fact was negatively associated with insulin release. Less is known about the roles that alanine and serine play in GSIS but our OPLS model suggest there may be a link. Interestingly, a role for these amino acids is supported by in vivo studies showing that alanine and serine induced a strong enhancement of insulin secretion as compared with other amino acids.33
The most significantly reduced metabolite by high glucose treatment was the amino acid aspartate which is consistent with previous studies in references 12, 40 and 60. Aspartate can be transaminated to glutamate by aspartate aminotransaminase. Aspartate aminotransferase plays a role in the malate-aspartate shuttle which shuttles NADH from the cytosol into the mitochondrial matrix and is a key player in the regeneration NAD+ for maintaining flux through glycolysis. High glucose treatment of β-cells may reduce aspartate levels in part due to the higher demand on the malate-aspartate shuttle enzyme aspartate transaminase. Interestingly, the glycerol-phosphate shuttle metabolite dihydroxyacetone phosphate was also positively associated with GSIS in our OPLS model.
Glycolysis-derived pyruvate enters the TCA cycle via one of two pathways, one involving pyruvate dehydrogenase (PDH) and the other involving PC. Pyruvate entering via PDH is oxidized to CO2 generating NADH and FADH2 for ATP synthesis and pyruvate entering via PC is involved in net accumulation of TCA intermediates (anaplerosis).30,37,38,66 All TCA intermediates were positively associated with insulin secretion in our OPLS model. Citrate/isocitrate, 〈-ketoglutarate, succinate, fumarate and malate were elevated by high glucose treatment of cells. The replenishment of TCA intermediates (PC-mediated anaplerosis) appears to be of critical importance for β-cell glucose competence as C13-NMR isotopomer analysis revealed that glucose responsiveness is more stringently associated to anaplerotic substrate flow as opposed to oxidative substrate flux.36 Efficient knockdown of PC activity (by 50% or more) renders clonal β-cells and primary rat islets in a glucose unresponsive state without any changes in the glucose oxidation rate. Interestingly, PC activity was also reported to be reduced by at least 70% in human islets obtained from type 2 diabetics.43
The intrinsic disadvantage of the current traditional methods used to study β-cell metabolism requires a more comprehensive and powerful method/technology for reliable reconstruction of the metabolic networks in β-cells in response to experimental perturbations. In our metabolomics study, a potential limitation is the work uses the clonal cell line, 832/13 cells, in contrast to isolated islets. However, the advantage of using the 832/13 cells is that it is a homogenous preparation of β-cells as compared with islet preparations and obtaining sufficient number of cells is relatively easy. One of the key limitations of the metabolic platforms is detection of low abundance metabolites and we feel that the current methodology presented here improves upon this and provides an important step toward making it easier to use isolated islets in metabolomics studies. However, there is still a need for improved metabolite extraction methods that gives a better yield of the diverse chemicals found in cells, improved handling of the wide-ranging concentration of analytes and improved data mining software to assess the “information-rich” data sets.29
Glucose metabolism plays multiple roles in the regulation of insulin secretion from β-cells. Most of the literature focuses on the role of glycolysis, ATP/ADP ratio, TCA cycle and anaplerosis in insulin secretion however other pathways may also be critical. For example, although it has been previously under-estimated in the past, our study suggests that the sorbitol-aldose reductase pathway and pentose phosphate pathway might play an important role in β-cell stimulus-secretion coupling. There appears to be a coordinated effort in β-cells to increase the activity of a number of metabolic pathways in response to glucose however which pathways are critical for insulin secretion still needs to be investigated. The current metabolomics approach presented in this study allows one to assess the effects of perturbations to β-cell metabolism on most of the key metabolic pathways in a single assay. It is important to have broad assessment of these pathways in response to manipulating metabolic enzymes because of the complex metabolic interconnectivity seen in these cells. This integrating paradigm will provide a new conceptual framework for future research and drug discovery.
Materials and Methods
Reagents
All reagents were purchased from Sigma-Aldrich (St. Louis, MO), unless otherwise stated.
Cell culture
The clonal β-cell line 832/13, derived from the parental INS-1 rat insulinoma cells, was kindly provided by Christopher Newgard.20 832/13 cells were cultured at 37°C and 5% CO2 in RPMI1640 supplemented with 10% fetal bovine serum, 100 U/ml penicillin, 100 ∝g/ml streptomycin, 10 mmol/l HEPES, 2 mmol/l L-glutamine, 1 mmol/l sodium pyruvate and 50 ∝mol/l β-mercaptoethanol.
Insulin secretion assay
Insulin secretion assay was performed as previously described in references 20, 21, 26 and 27. Briefly, 832/13 cells were seeded in 6-well plates with an initial density of 1.0 × 10⁶ cells/well and were grown to confluence. Cells were treated for 2 h with KRB (129 mM NaCl, 10 mM HEPES, 5 mM HCO3, 3.11 mM CaCl2, 0.25% bovine serum albumin and supplemented with 2 mM glucose, pH 7.4) followed by treating cells with 2 h with KRB containing either low glucose (LG, 2 mM) or high glucose (HG, 16.7 mM). After incubating cells the supernatant was taken and insulin was measured by RIA using the Coat-a-Count kit (SIEMENS, Los Angeles, CA).
Extraction and derivatization of metabolites for GC-MS analysis
After the insulin secretion assay, cells were washed once with ice-cold PBS, scraped off the plates followed by centrifugation at 3,500 rpm for 1 min at 4°C. The supernatant was discarded and the cell pellet was resuspended in 100 ∝l of water followed by sonicating for 60 sec (~40 KHz, ~140 W). One ml of methanol was added followed by centrifugation for 5 min at 13,300 rpm. Supernatant was mixed with 5 ∝l of 0.25 mg/ml myristic acid-d27 as an internal standard (IS; used for retention time locking) followed by drying with nitrogen. Derivatization was then performed in two steps: first, carbonyls were protected by methoximation using methoxyamine hydrochloride in pyridine at 50°C for 30 min. Second, acidic groups were silylated with 90 ∝l N-methyl-N-(trimethylsilyl)-trifluoroacetamide (MSTFA) with 1% TMCS at 50°C for 30 min.
GC-MS analysis
One microliter of the derivatized sample was injected in split mode with 1:2 split ratio onto a GC [7890A Agilent, USA; DB-5MS column (30 min × 250 ∝m × 0.25 ∝m)]. Detection was performed with a quadrupole mass spectrometer (5895C Agilent USA). Each sample was run 4 times.
Deconvolution and identification
The Automated Mass Spectral Deconvolution and Identification System software (AMDIS, Version 2.65) was used for peak detection and mass spectrum deconvolution. Target compounds were identified using retention time and by matching mass spectra in either Fiehn GC/MS Metabolomics Retention Time Locking (RTL) Library (Version 2.0f) or NIST library (2008). A known amount internal standard (myristic acid-d27) was used to calculate relative metabolite levels.
Multivariate analysis using principle component analysis (PCA) and orthogonal projection to latent structures (OPLS). The large data sets generated by metabolomics platforms requires specialized tools for analysis such as multivariate statistics.70 We used PCA and the OPLS to model our data set.70,72 Prior to PCA and OPLS analysis, the data set was organized into a X-matrix (metabolite level) and Y-matrix (insulin secretion). Preprocessing of the data was done by unit variance (UV) scaling using the SIMCA P + 12.0 software from Umetrics (San Jose, California). The data set was also preprocessed by log10 transformation to recover false-negative results by increasing the weight of low abundant metabolites and to remove false-positive results by reducing the stronger influence from highly abundant metabolites.
PCA was used to describe all the systematic variation in the X-matrix and Y-matrix.70,72 OPLS is similar to PCA however it is used to find relations between two different matrixes (X and Y). OPLS was used to model the differences seen in the X-matrix (metabolite levels) to a Y-matrix (insulin secretion). The advantage of using OPLS is that sometimes the systematic variation in the X matrix is unrelated to the Y-matrix making the model difficult to interpret. OPLS separates the systematic variation in the X matrix into one that is linearly related to Y (predictive) and one that is unrelated to Y (orthogonal).70,72 Note for OPLS, the orthogonal components have a subscript o, e.g., to1 for the first orthogonal component in X.
Identification of outliers
DModX Plot displays the residual standard deviation (RSD) of the observations in the X space after all the computed dimensions. This RSD is proportional to the distance of the observation to the model hyper plane. Larger DModX than the critical limit indicates that the observation is an outlier in the X space. In the current OPLS model there were no outliers (data not shown).
Coefficient plot
The regression coefficient plot reflects the importance of variables in the model both with respect to Y, i.e., its correlation to all the responses, and with respect to X (the projection). As the coefficient becomes more negative or positive the more influence the variable has on the model.
siRNAs
Two siRNAs were used in these studies (siG6PDH-1, rGrGrA rGrArA rGrCrU rArCrC rArArU rGrGrG rUrArC rUrUA G) and second siRNA (siG6PDH-2, rCrCrA rCrArU rCrUrC rCrUrC rUrCrU rGrUrU rUrCrG rUrGA G).
Acknowledgments
The work was supported by a Canadian Institute of Health Research and Canada foundation for Innovation grants (to J.W.J.).
Glossary
Abbreviations:
- VIP
variable influence on projection
- PCA
principle component analysis
- OPLS
orthogonal projections to latent structures
- GSIS
Glucose stimulated insulin secretion
- ATP
adenosine triphosphate
- ADP
adenosine diphosphate
- LC-CoA
long-chain acyl CoA
- NADPH
nicotinamide adenine dinucleotide phosphate
- PC
pyruvate carboxylase
- PDH
pyruvate dehydrogenase
- TCA
tricarboxylic acid cycle
- PPP
pentose phosphate pathway
- GK
glucokinase
Disclosure of Potential Conflicts of Interest
No potential conflicts of interest were disclosed.
Footnotes
Previously published online: www.landesbioscience.com/journals/islets/article/20141
References
- 1.Ammon HP, Patel TN, Steinke J. The role of the pentose phosphate shunt in glucose induced insulin release: in vitro studies with 6-aminonicotinamide, methylene blue, NAD +, NADH, NADP +, NADPH and nicotinamide on isolated pancreatic rat islets. Biochim Biophys Acta. 1973;297:352–67. doi: 10.1016/0304-4165(73)90083-4. [DOI] [PubMed] [Google Scholar]
- 2.Ashcroft SJ, Randle PJ. Enzymes of glucose metabolism in normal mouse pancreatic islets. Biochem J. 1970;119:5–15. doi: 10.1042/bj1190005. [DOI] [PMC free article] [PubMed] [Google Scholar]
- 3.Bain JR, Stevens RD, Wenner BR, Ilkayeva O, Muoio DM, Newgard CB. Metabolomics applied to diabetes research: moving from information to knowledge. Diabetes. 2009;58:2429–43. doi: 10.2337/db09-0580. [DOI] [PMC free article] [PubMed] [Google Scholar]
- 4.Bertrand G, Ishiyama N, Nenquin M, Ravier MA, Henquin JC. The elevation of glutamate content and the amplification of insulin secretion in glucose-stimulated pancreatic islets are not causally related. J Biol Chem. 2002;277:32883–91. doi: 10.1074/jbc.M205326200. [DOI] [PubMed] [Google Scholar]
- 5.Brown LJ, Longacre MJ, Hasan NM, Kendrick MA, Stoker SW, Macdonald MJ. Chronic reduction of the cytosolic or mitochondrial NAD(P)-malic enzyme does not affect insulin secretion in a rat insulinoma cell line. J Biol Chem. 2009;284:35359–67. doi: 10.1074/jbc.M109.040394. [DOI] [PMC free article] [PubMed] [Google Scholar]
- 6.Carobbio S, Frigerio F, Rubi B, Vetterli L, Bloksgaard M, Gjinovci A, et al. Deletion of glutamate dehydrogenase in beta-cells abolishes part of the insulin secretory response not required for glucose homeostasis. J Biol Chem. 2009;284:921–9. doi: 10.1074/jbc.M806295200. [DOI] [PubMed] [Google Scholar]
- 7.Clements RS, Jr., Winegrad AI. Modulation of mammalian polyol: NADP oxidoreductase activity by ADP and ATP. Biochem Biophys Res Commun. 1969;36:1006–12. doi: 10.1016/0006-291X(69)90304-0. [DOI] [PubMed] [Google Scholar]
- 8.Corkey BE, Glennon MC, Chen KS, Deeney JT, Matschinsky FM, Prentki M. A role for malonyl-CoA in glucose-stimulated insulin secretion from clonal pancreatic beta-cells. J Biol Chem. 1989;264:21608–12. [PubMed] [Google Scholar]
- 9.Detimary P, Van den Berghe G, Henquin JC. Concentration dependence and time course of the effects of glucose on adenine and guanine nucleotides in mouse pancreatic islets. J Biol Chem. 1996;271:20559–65. doi: 10.1074/jbc.271.34.20559. [DOI] [PubMed] [Google Scholar]
- 10.Dettmer K, Aronov PA, Hammock BD. Mass spectrometry-based metabolomics. Mass Spectrom Rev. 2007;26:51–78. doi: 10.1002/mas.20108. [DOI] [PMC free article] [PubMed] [Google Scholar]
- 11.Fahien LA, Macdonald MJ. The complex mechanism of glutamate dehydrogenase in insulin secretion. Diabetes. 2011;60:2450–4. doi: 10.2337/db10-1150. [DOI] [PMC free article] [PubMed] [Google Scholar]
- 12.Fernandez C, Fransson U, Hallgard E, Spégel P, Holm C, Krogh M, et al. Metabolomic and proteomic analysis of a clonal insulin-producing beta-cell line (INS-1 832/13) J Proteome Res. 2008;7:400–11. doi: 10.1021/pr070547d. [DOI] [PubMed] [Google Scholar]
- 13.Gabbay KH, Tze WJ. Inhibition of glucose-induced release of insulin by aldose reductase inhibitors. Proc Natl Acad Sci U S A. 1972;69:1435–9. doi: 10.1073/pnas.69.6.1435. [DOI] [PMC free article] [PubMed] [Google Scholar]
- 14.Gembal M, Gilon P, Henquin JC. Evidence that glucose can control insulin release independently from its action on ATP-sensitive K+ channels in mouse B cells. J Clin Invest. 1992;89:1288–95. doi: 10.1172/JCI115714. [DOI] [PMC free article] [PubMed] [Google Scholar]
- 15.Giroix MH, Sener A, Malaisse WJ. Pentose cycle pathway in normal and tumoral islet cells. FEBS Lett. 1985;185:1–3. doi: 10.1016/0014-5793(85)80728-6. [DOI] [PubMed] [Google Scholar]
- 16.Hamaoka R, Fujii J, Miyagawa J, Takahashi M, Kishimoto M, Moriwaki M, et al. Overexpression of the aldose reductase gene induces apoptosis in pancreatic beta-cells by causing a redox imbalance. J Biochem. 1999;126:41–7. doi: 10.1093/oxfordjournals.jbchem.a022434. [DOI] [PubMed] [Google Scholar]
- 17.Hedeskov CJ, Capito K. The pentose cycle and insulin release in isolated mouse pancreatic islets during starvation. Biochem J. 1975;152:571–6. doi: 10.1042/bj1520571. [DOI] [PMC free article] [PubMed] [Google Scholar]
- 18.Henquin JC. Regulation of insulin secretion: a matter of phase control and amplitude modulation. Diabetologia. 2009;52:739–51. doi: 10.1007/s00125-009-1314-y. [DOI] [PubMed] [Google Scholar]
- 19.Henquin JC, Nenquin M, Ravier MA, Szollosi A. Shortcomings of current models of glucose-induced insulin secretion. Diabetes Obes Metab. 2009;11(Suppl 4):168–79. doi: 10.1111/j.1463-1326.2009.01109.x. [DOI] [PubMed] [Google Scholar]
- 20.Hohmeier HE, Mulder H, Chen G, Henkel-Rieger R, Prentki M, Newgard CB. Isolation of INS-1-derived cell lines with robust ATP-sensitive K+ channel-dependent and -independent glucose-stimulated insulin secretion. Diabetes. 2000;49:424–30. doi: 10.2337/diabetes.49.3.424. [DOI] [PubMed] [Google Scholar]
- 21.Huypens P, Pillai R, Sheinin T, Schaefer S, Huang M, Odegaard ML, et al. The dicarboxylate carrier plays a role in mitochondrial malate transport and in the regulation of glucose-stimulated insulin secretion from rat pancreatic beta cells. Diabetologia. 2011;54:135–45. doi: 10.1007/s00125-010-1923-5. [DOI] [PubMed] [Google Scholar]
- 22.Huypens PR, Huang M, Joseph JW. Overcoming the spatial barriers of the stimulus secretion cascade in pancreatic β-cells. Islets. 2012;4 doi: 10.4161/isl.18338. In press. [DOI] [PubMed] [Google Scholar]
- 23.Ivarsson R, Quintens R, Dejonghe S, Tsukamoto K. in’t Veld P, Renström E, et al. Redox control of exocytosis: regulatory role of NADPH, thioredoxin and glutaredoxin. Diabetes 2005; 54:2132-42; PMID:15983215; 10.2337/diabetes.54.7.2132. [DOI] [PubMed] [Google Scholar]
- 24.Jeffery J, Jörnvall H. Enzyme relationships in a sorbitol pathway that bypasses glycolysis and pentose phosphates in glucose metabolism. Proc Natl Acad Sci U S A. 1983;80:901–5. doi: 10.1073/pnas.80.4.901. [DOI] [PMC free article] [PubMed] [Google Scholar]
- 25.Jensen MV, Joseph JW, Ronnebaum SM, Burgess SC, Sherry AD, Newgard CB. Metabolic cycling in control of glucose-stimulated insulin secretion. Am J Physiol Endocrinol Metab. 2008;295:E1287–97. doi: 10.1152/ajpendo.90604.2008. [DOI] [PMC free article] [PubMed] [Google Scholar]
- 26.Joseph JW, Jensen MV, Ilkayeva O, Palmieri F, Alárcon C, Rhodes CJ, et al. The mitochondrial citrate/isocitrate carrier plays a regulatory role in glucose-stimulated insulin secretion. J Biol Chem. 2006;281:35624–32. doi: 10.1074/jbc.M602606200. [DOI] [PubMed] [Google Scholar]
- 27.Joseph JW, Odegaard ML, Ronnebaum SM, Burgess SC, Muehlbauer J, Sherry AD, et al. Normal flux through ATP-citrate lyase or fatty acid synthase is not required for glucose-stimulated insulin secretion. J Biol Chem. 2007;282:31592–600. doi: 10.1074/jbc.M706080200. [DOI] [PubMed] [Google Scholar]
- 28.Kahn SE, Hull RL, Utzschneider KM. Mechanisms linking obesity to insulin resistance and type 2 diabetes. Nature. 2006;444:840–6. doi: 10.1038/nature05482. [DOI] [PubMed] [Google Scholar]
- 29.Katajamaa M, Oresic M. Data processing for mass spectrometry-based metabolomics. J Chromatogr A. 2007;1158:318–28. doi: 10.1016/j.chroma.2007.04.021. [DOI] [PubMed] [Google Scholar]
- 30.Khan A, Ling ZC, Landau BR. Quantifying the carboxylation of pyruvate in pancreatic islets. J Biol Chem. 1996;271:2539–42. doi: 10.1074/jbc.271.5.2539. [DOI] [PubMed] [Google Scholar]
- 31.Kibbey RG, Pongratz RL, Romanelli AJ, Wollheim CB, Cline GW, Shulman GI. Mitochondrial GTP regulates glucose-stimulated insulin secretion. Cell Metab. 2007;5:253–64. doi: 10.1016/j.cmet.2007.02.008. [DOI] [PMC free article] [PubMed] [Google Scholar]
- 32.Krus U, Kotova O, Spégel P, Hallgard E, Sharoyko VV, Vedin A, et al. Pyruvate dehydrogenase kinase 1 controls mitochondrial metabolism and insulin secretion in INS-1 832/13 clonal beta-cells. Biochem J. 2010;429:205–13. doi: 10.1042/BJ20100142. [DOI] [PubMed] [Google Scholar]
- 33.Kuhara T, Ikeda S, Ohneda A, Sasaki Y. Effects of intravenous infusion of 17 amino acids on the secretion of GH, glucagon, and insulin in sheep. Am J Physiol. 1991;260:E21–6. doi: 10.1152/ajpendo.1991.260.1.E21. [DOI] [PubMed] [Google Scholar]
- 34.Laclau M, Lu F, MacDonald MJ. Enzymes in pancreatic islets that use NADP(H) as a cofactor including evidence for a plasma membrane aldehyde reductase. Mol Cell Biochem. 2001;225:151–60. doi: 10.1023/A:1012238709063. [DOI] [PubMed] [Google Scholar]
- 35.Lange K, Proft ER. Inhibition of the 6-phosphogluconate dehydrogenase in the rat kidney by 6-aminonicotinamide. Naunyn Schmiedebergs Arch Pharmakol. 1970;267:177–80. doi: 10.1007/BF00999399. [DOI] [PubMed] [Google Scholar]
- 36.Lu D, Mulder H, Zhao P, Burgess SC, Jensen MV, Kamzolova S, et al. 13C NMR isotopomer analysis reveals a connection between pyruvate cycling and glucose-stimulated insulin secretion (GSIS) Proc Natl Acad Sci U S A. 2002;99:2708–13. doi: 10.1073/pnas.052005699. [DOI] [PMC free article] [PubMed] [Google Scholar]
- 37.MacDonald MJ. Estimates of glycolysis, pyruvate (de)carboxylation, pentose phosphate pathway, and methyl succinate metabolism in incapacitated pancreatic islets. Arch Biochem Biophys. 1993;305:205–14. doi: 10.1006/abbi.1993.1413. [DOI] [PubMed] [Google Scholar]
- 38.MacDonald MJ. Glucose enters mitochondrial metabolism via both carboxylation and decarboxylation of pyruvate in pancreatic islets. Metabolism. 1993;42:1229–31. doi: 10.1016/0026-0495(93)90118-8. [DOI] [PubMed] [Google Scholar]
- 39.MacDonald MJ. Feasibility of a mitochondrial pyruvate malate shuttle in pancreatic islets. Further implication of cytosolic NADPH in insulin secretion. J Biol Chem. 1995;270:20051–8. [PubMed] [Google Scholar]
- 40.MacDonald MJ. The export of metabolites from mitochondria and anaplerosis in insulin secretion. Biochim Biophys Acta. 2003;1619:77–88. doi: 10.1016/S0304-4165(02)00443-9. [DOI] [PubMed] [Google Scholar]
- 41.MacDonald MJ, Fahien LA. Glutamate is not a messenger in insulin secretion. J Biol Chem. 2000;275:34025–7. doi: 10.1074/jbc.C000411200. [DOI] [PubMed] [Google Scholar]
- 42.Macdonald MJ, Hasan NM, Longacre MJ. Studies with leucine, beta-hydroxybutyrate and ATP citrate lyase-deficient beta cells support the acetoacetate pathway of insulin secretion. Biochim Biophys Acta. 2008;1780:966–72. doi: 10.1016/j.bbagen.2008.03.017. [DOI] [PMC free article] [PubMed] [Google Scholar]
- 43.MacDonald MJ, Longacre MJ, Langberg EC, Tibell A, Kendrick MA, Fukao T, et al. Decreased levels of metabolic enzymes in pancreatic islets of patients with type 2 diabetes. Diabetologia. 2009;52:1087–91. doi: 10.1007/s00125-009-1319-6. [DOI] [PMC free article] [PubMed] [Google Scholar]
- 44.MacDonald MJ, Smith AD, 3rd, Hasan NM, Sabat G, Fahien LA. Feasibility of pathways for transfer of acyl groups from mitochondria to the cytosol to form short chain acyl-CoAs in the pancreatic beta cell. J Biol Chem. 2007;282:30596–606. doi: 10.1074/jbc.M702732200. [DOI] [PubMed] [Google Scholar]
- 45.MacDonald PE, Joseph JW, Rorsman P. Glucose-sensing mechanisms in pancreatic beta-cells. Philos Trans R Soc Lond B Biol Sci. 2005;360:2211–25. doi: 10.1098/rstb.2005.1762. [DOI] [PMC free article] [PubMed] [Google Scholar]
- 46.Maechler P, Gjinovci A, Wollheim CB. Implication of glutamate in the kinetics of insulin secretion in rat and mouse perfused pancreas. Diabetes. 2002;51(Suppl 1):S99–102. doi: 10.2337/diabetes.51.2007.S99. [DOI] [PubMed] [Google Scholar]
- 47.Maechler P, Wollheim CB. Mitochondrial glutamate acts as a messenger in glucose-induced insulin exocytosis. Nature. 1999;402:685–9. doi: 10.1038/45280. [DOI] [PubMed] [Google Scholar]
- 48.Malaisse WJ, Sener A, Mahy M. The stimulus-secretion coupling of glucose-induced insulin release. Sorbitol metabolism in isolated islets. Eur J Biochem. 1974;47:365–70. doi: 10.1111/j.1432-1033.1974.tb03701.x. [DOI] [PubMed] [Google Scholar]
- 49.Marx J. Unraveling the causes of diabetes. Science. 2002;296:686–9. doi: 10.1126/science.296.5568.686. [DOI] [PubMed] [Google Scholar]
- 50.Monte Alegre S, Saad ST, Delatre E, Saad MJ. Insulin secretion in patients deficient in glucose-6-phosphate dehydrogenase. Horm Metab Res. 1991;23:171–3. doi: 10.1055/s-2007-1003644. [DOI] [PubMed] [Google Scholar]
- 51.Moonsammy GI, Stewart MA. Purification and properties of brain aldose reductase and L-hexonate dehydrogenase. J Neurochem. 1967;14:1187–93. doi: 10.1111/j.1471-4159.1967.tb06166.x. [DOI] [PubMed] [Google Scholar]
- 52.Mulder H, Lu D, Finley J, 4th, An J, Cohen J, Antinozzi PA, et al. Overexpression of a modified human malonyl-CoA decarboxylase blocks the glucose-induced increase in malonyl-CoA level but has no impact on insulin secretion in INS-1-derived (832/13) beta-cells. J Biol Chem. 2001;276:6479–84. doi: 10.1074/jbc.M010364200. [DOI] [PubMed] [Google Scholar]
- 53.Nenquin M, Szollosi A, Aguilar-Bryan L, Bryan J, Henquin JC. Both triggering and amplifying pathways contribute to fuel-induced insulin secretion in the absence of sulfonylurea receptor-1 in pancreatic beta-cells. J Biol Chem. 2004;279:32316–24. doi: 10.1074/jbc.M402076200. [DOI] [PubMed] [Google Scholar]
- 54.Newsholme P, Bender K, Kiely A, Brennan L. Amino acid metabolism, insulin secretion and diabetes. Biochem Soc Trans. 2007;35:1180–6. doi: 10.1042/BST0351180. [DOI] [PubMed] [Google Scholar]
- 55.Nolan CJ, Madiraju MS, Delghingaro-Augusto V, Peyot ML, Prentki M. Fatty acid signaling in the beta-cell and insulin secretion. Diabetes. 2006;55(Suppl 2):S16–23. doi: 10.2337/db06-S003. [DOI] [PubMed] [Google Scholar]
- 56.Nolan CJ, Prentki M. The islet beta-cell: fuel responsive and vulnerable. Trends Endocrinol Metab. 2008;19:285–91. doi: 10.1016/j.tem.2008.07.006. [DOI] [PubMed] [Google Scholar]
- 57.Odegaard ML, Joseph JW, Jensen MV, Lu D, Ilkayeva O, Ronnebaum SM, et al. The mitochondrial 2-oxoglutarate carrier is part of a metabolic pathway that mediates glucose- and glutamine-stimulated insulin secretion. J Biol Chem. 2010;285:16530–7. doi: 10.1074/jbc.M109.092593. [DOI] [PMC free article] [PubMed] [Google Scholar]
- 58.Ohtsubo K, Takamatsu S, Minowa MT, Yoshida A, Takeuchi M, Marth JD. Dietary and genetic control of glucose transporter 2 glycosylation promotes insulin secretion in suppressing diabetes. Cell. 2005;123:1307–21. doi: 10.1016/j.cell.2005.09.041. [DOI] [PubMed] [Google Scholar]
- 59.Oliveira HR, Curi R, Carpinelli AR. Glucose induces an acute increase of superoxide dismutase activity in incubated rat pancreatic islets. Am J Physiol. 1999;276:C507–10. doi: 10.1152/ajpcell.1999.276.2.C507. [DOI] [PubMed] [Google Scholar]
- 60.Pillai R, Huypens P, Huang M, Schaefer S, Sheinin T, Wettig SD, et al. Aryl hydrocarbon receptor nuclear translocator/hypoxia-inducible factor-1beta plays a critical role in maintaining glucose-stimulated anaplerosis and insulin release from pancreatic beta-cells. J Biol Chem. 2011;286:1014–24. doi: 10.1074/jbc.M110.149062. [DOI] [PMC free article] [PubMed] [Google Scholar]
- 61.Prentki M, Vischer S, Glennon MC, Regazzi R, Deeney JT, Corkey BE. Malonyl-CoA and long chain acyl-CoA esters as metabolic coupling factors in nutrient-induced insulin secretion. J Biol Chem. 1992;267:5802–10. [PubMed] [Google Scholar]
- 62.Roduit R, Nolan C, Alarcon C, Moore P, Barbeau A, Delghingaro-Augusto V, et al. A role for the malonyl-CoA/long-chain acyl-CoA pathway of lipid signaling in the regulation of insulin secretion in response to both fuel and nonfuel stimuli. Diabetes. 2004;53:1007–19. doi: 10.2337/diabetes.53.4.1007. [DOI] [PubMed] [Google Scholar]
- 63.Ronnebaum SM, Ilkayeva O, Burgess SC, Joseph JW, Lu D, Stevens RD, et al. A pyruvate cycling pathway involving cytosolic NADP-dependent isocitrate dehydrogenase regulates glucose-stimulated insulin secretion. J Biol Chem. 2006;281:30593–602. doi: 10.1074/jbc.M511908200. [DOI] [PubMed] [Google Scholar]
- 64.Ronnebaum SM, Jensen MV, Hohmeier HE, Burgess SC, Zhou YP, Qian S, et al. Silencing of cytosolic or mitochondrial isoforms of malic enzyme has no effect on glucose-stimulated insulin secretion from rodent islets. J Biol Chem. 2008;283:28909–17. doi: 10.1074/jbc.M804665200. [DOI] [PMC free article] [PubMed] [Google Scholar]
- 65.Scalbert A, Brennan L, Fiehn O, Hankemeier T, Kristal BS, van Ommen B, et al. Mass-spectrometry-based metabolomics: limitations and recommendations for future progress with particular focus on nutrition research. Metabolomics. 2009;5:435–58. doi: 10.1007/s11306-009-0168-0. [DOI] [PMC free article] [PubMed] [Google Scholar]
- 66.Schuit F, De Vos A, Farfari S, Moens K, Pipeleers D, Brun T, et al. Metabolic fate of glucose in purified islet cells. Glucose-regulated anaplerosis in beta cells. J Biol Chem. 1997;272:18572–9. doi: 10.1074/jbc.272.30.18572. [DOI] [PubMed] [Google Scholar]
- 67.Spégel P, Malmgren S, Sharoyko VV, Newsholme P, Koeck T, Mulder H. Metabolomic analyses reveal profound differences in glycolytic and tricarboxylic acid cycle metabolism in glucose-responsive and -unresponsive clonal β-cell lines. Biochem J. 2011;435:277–84. doi: 10.1042/BJ20100655. [DOI] [PubMed] [Google Scholar]
- 68.Stark R, Pasquel F, Turcu A, Pongratz RL, Roden M, Cline GW, et al. Phosphoenolpyruvate cycling via mitochondrial phosphoenolpyruvate carboxykinase links anaplerosis and mitochondrial GTP with insulin secretion. J Biol Chem. 2009;284:26578–90. doi: 10.1074/jbc.M109.011775. [DOI] [PMC free article] [PubMed] [Google Scholar]
- 69.Szpunar J. Advances in analytical methodology for bioinorganic speciation analysis: metallomics, metalloproteomics and heteroatom-tagged proteomics and metabolomics. Analyst. 2005;130:442–65. doi: 10.1039/b418265k. [DOI] [PubMed] [Google Scholar]
- 70.Trygg J, Holmes E, Lundstedt T. Chemometrics in metabonomics. J Proteome Res. 2007;6:469–79. doi: 10.1021/pr060594q. [DOI] [PubMed] [Google Scholar]
- 71.Verspohl EJ, Händel M, Ammon HP. Pentosephosphate shunt activity of rat pancreatic islets: its dependence on glucose concentration. Endocrinology. 1979;105:1269–74. doi: 10.1210/endo-105-5-1269. [DOI] [PubMed] [Google Scholar]
- 72.Wiklund S, Johansson E, Sjöström L, Mellerowicz EJ, Edlund U, Shockcor JP, et al. Visualization of GC/TOF-MS-based metabolomics data for identification of biochemically interesting compounds using OPLS class models. Anal Chem. 2008;80:115–22. doi: 10.1021/ac0713510. [DOI] [PubMed] [Google Scholar]
- 73.Xu J, Han J, Long YS, Lock J, Weir GC, Epstein PN, et al. Malic enzyme is present in mouse islets and modulates insulin secretion. Diabetologia. 2008;51:2281–9. doi: 10.1007/s00125-008-1155-0. [DOI] [PMC free article] [PubMed] [Google Scholar]
- 74.Zhang Z, Liew CW, Handy DE, Zhang Y, Leopold JA, Hu J, et al. High glucose inhibits glucose-6-phosphate dehydrogenase, leading to increased oxidative stress and beta-cell apoptosis. FASEB J. 2010;24:1497–505. doi: 10.1096/fj.09-136572. [DOI] [PMC free article] [PubMed] [Google Scholar]


