Abstract
Quantification of bacteriophages by real-time quantitative PCR (qPCR) is an interesting alternative to the traditional plaque assay. Importantly, the method should in principle be able to discriminate between closely related phages that are indistinguishable by most other means. Here, a method is presented that employs qPCR to discriminate and quantify ten closely related lambdoid phages of Escherichia coli str. K-12. It is shown that (1) treatment of samples with DNase efficiently removes non-encapsidated DNA, while the titer of plaque forming units is not affected, (2) individual phage types can be accurately quantified in mixed lysates, and (3) the detection limit corresponds to that of a plaque assay. The method is used to quantify individual phage types that are released from lysogens that carry up to three different prophages.
Keywords: multiple infections, real-time quantitative PCR, bacteriophages, Escherichia coli, bacteriophage lambda, lambdoid bacteriophages, detection, discrimination, quantification, polylysogeny
Introduction
The infection of a bacterial cell by multiple, different bacteriophages (phages) constitutes an important part of phage ecology that influences phage evolution in many ways.1-5 To study interactions among phages, methods are required that can discriminate and quantify different phage types in the same sample. The double agar overlay assay,6 although considered to be the gold standard for phage quantification, falls short of what is required here. Its capability to differentiate phages is limited as it depends on differences in phenotypic markers such as plaque morphology or host range of the phages to be distinguished.5
Real-time quantitative PCR (qPCR) is an interesting alternative and has been successfully used to enumerate phages as well as other microparasites.7-10 Concerning phages, current applications of qPCR fall broadly in two groups, neither of which requires a highly specific assay. Either the specificity of the method is not an issue as samples are expected to contain only one type of phage, or the method has been deliberately adapted to be unspecific such that a broader group of phages is detected.11-13 Here, a method is presented where qPCR is used to achieve the opposite, namely the discrimination of closely related phages in mixed lysates.
To develop and validate this method, a set of ten lambdoid phages of Escherichia coli str. K-12 is used. These phages have been used previously to study the competitive interactions that occur when two prophages are induced in the same lysogenic cell.5 Pairs of these phages can be distinguished by differential plating on bacteria that exclude one phage by its receptor specificity or immunity group. However, this approach fails to discriminate most combinations of three or more phages. This can be overcome by a qPCR approach where individual phages types are specifically targeted.
The assay is based on an earlier protocol,9 a modified version of which has been used previously to quantify variants of phage λ that did not produce plaques or whose plaques were difficult to count.14 It consists of two steps, an initial treatment with DNase to remove phage DNA that is not enclosed in capsids (which would cause an overestimation of the phage titer), and the qPCR itself. While the method performs very robustly, its extension to achieve the discriminatory power to accurately quantify individual phages in mixed samples has never been explored and required further experiments for validation.
Together, these experiments show that the assay detects all viable phages in a sample and clearly discriminates individual phage types. The good correspondence to the plaque assay suggests that the method can be used by digital PCR15 for absolute quantification without an external standard and for the quantification of phages which are difficult or impossible to quantify otherwise (e.g., because they form no or barely visible plaques, or no cells suitable for plating are available).14,16
The method is used to quantify individual phages in lysates that were obtained from the induction of lysogens containing either one, two, or three different lambdoid prophages. Specific pair-wise combinations of these phages have previously been shown to strongly interfere during prophage induction, leading to substantial declines in productivity for both phages involved.5 It is therefore of interest to investigate whether this mutual interference also affects other prophages that partake in the induction, and whether they can mediate the outcome.
The method presented here is hoped to be a useful tool to conduct experiments in the area of phage ecology and evolution. Data on viral diversity in various environments accumulate at a staggering pace,17-20 and it is important to test whether concepts from ecological and evolutionary theory can be applied to understand the processes that give rise to this diversity.21-24 Another field where the application of qPCR is promising is phage therapy, the treatment of bacterial infections with phages. The ability to discriminate different phages will allow better understanding of phage population kinetics when phage cocktails instead of single phages are used.25-27
Materials and Methods
Materials
Bacteria, phages, and reagents
The phages used were all lambdoid phages of Escherichia coli str. K-12 and were described elsewhere (Table 1).5,28-30 They all belong to separate immunity groups, except for phages mEp234, and mEp332, which share the immunity group of phage λ. All phages were kept as prophages in E. coli str. K-12 substr. MG1655.
Table 1. Primers that were validated in this study and the phages against which they are targeted.
| Name | Sequence | Target phage | Target sequence | Product size |
|---|---|---|---|---|
| qPCR_HK022 |
5′-TGCCATCGCCATCAAAACAGGT-3′ 5′-TCATCACGGTTCGCGGTGACA-3′ |
HK022 |
cI |
96 bp |
| qPCR_mEp043 |
5′-ACCCGCACGAACGTTACCCG-3′ 5′-TCCCACGCGGATGGATGGACA-3′ |
mEp043 |
cI |
86 bp |
| qPCR_mEp213 |
5′-TCGCCCTGAACCCTGAGCCA-3′ 5′-GGAGTGAGGCCGTAGAGCCGT-3′ |
mEp213 |
cI |
103 bp |
| qPCR_mEp234 |
5′-GCAATTAGTTGGTGCATGCGGCG-3′ 5′-ATCCCCTACCTCAGCGCGGG-3′ |
mEp234 |
int |
96 bp |
| qPCR_mEp235 |
5′-TCAGGGGAGCACTGCAAAGCC-3′ 5′-GCAGGCTGCCCTTGGCAAGAT-3′ |
mEp235 |
cI |
126 bp |
| qPCR_mEp235b |
5′-GGAACCCAGCGTGCTGTTGC-3′ 5′-CAGGGCGCCAGCTGTAACGA-3′ |
mEp235 |
cro |
120 bp |
| qPCR_mEpX1 |
5′-AAATGGCCCGGCCTGCACTG-3′ 5′-GCACTCGGCGTATCTCCGGC-3′ |
mEpX1 |
cI |
105 bp |
| qPCR_mEpX2 |
5′-TGCTATGACCAAGCTGCCGTTGA-3′ 5′-TCAATGACGGCACCGGTTGGG-3′ |
mEpX2 |
cI |
96 bp |
| qPCR_lambda |
5′-GCGTTACCGTTTCGCGGTGC-3′ 5′-TCGCAGCATTGCCCGTCAGG-3′ |
λ, mEp332 |
orf61 (phage λ) |
120 bp |
| qPCR_Phi80 | 5′-GCACCCCGCTTGAGAAAGCCA-3′ 5′-CTGGAAGGCTGCCACCTCGC-3′ |
Φ80 | cro | 120 bp |
Bacteria were grown in lysogeny broth (LB; 10 gl−1 tryptone, 5 gl−1 yeast extract, 10 gl−1 NaCl). For plates, 1.5% agar was added, for top agar, 0.7%. Lysates were stored in SMG (0.1 M NaCl, 8 mM MgSO4, 50 mM TRIS-HCl pH 7.5, 0.01% gelatin) at 4°C. Prophages were induced with mitomycin C (Sigma, M4287) at a concentration of 5 µg/ml.
DNase treatment was performed with RQ1 RNase-free DNase (Promega, M6101), using 10× reaction buffer (Promega) containing 400 mM TRIS-HCl pH 8.0, 100 mM MgSO4 and 10 mM CaCl2, and stop solution (Promega), containing 20 mM EGTA pH 8.0.
Primer design
Primer3 software as included in Geneious Pro v5.528 was used together with sequence data of all phages29-31 (Refardt D., unpublished data) to select primer pairs that specifically target selected phages (Table 1). Annealing temperature was set to 60°C and product size to ~100 bp. Primers were ordered from Microsynth (Balgach, Switzerland).
Instrument settings and data analysis
Amplification reactions were performed with a 7500 Fast Real-Time PCR System (Applied Biosystems) using default settings including a melt curve. Cycle threshold (ct) values, the number of PCR cycles required to amplify a target to a detectable level, were calculated at a normalized fluorescence emission intensity threshold of ΔRn = 0.1, which corresponded to approximately 5% of the maximum intensity. Statistical analyses were performed using R statistical software version 2.11.0.32
Procedure
Preparation of phage lysates
Inoculate single lysogenic colonies in LB and grow under continued shaking overnight at 37°C. Dilute cultures 1/500 into fresh LB and bring back to exponential growth by incubation for 2 h under continued shaking at 37°C. Induce lysogens by adding 5 μg ml−1 mitomycin C and continue incubation for approximately 4 h at 37°C. Dilute lysates 1/10 in SMG, add a drop of chloroform, and centrifuge at 2700 g for 10 min. Store lysates at 4°C.
Removal of non-encapsidated DNA
Add 2 µl DNase (2 units) and 1.3 µl 10× reaction buffer to 10 µl lysate and incubate for 60 min at 37°C. Inactivate DNase by adding 1.5 µl stop solution and incubating for 30 min at 95°C. Heating also opens phage capsids and makes DNA accessible for amplification. Dilute treated lysates 10-fold in H2O and store at -20°C.
Quantification by qPCR
Amplify samples in 10-µl reaction volumes including 300 nM of each primer, 1× SYBR Green PCR master mix (Applied Biosystems, 4309155), and 1 µl template.
After overnight incubation of cultures, the complete quantification process can be done within one day. Multiple samples can be efficiently processed in parallel by growing cultures in 96-deep-well plates (add a glass bead to each well to ensure proper mixing of cultures and seal plates with breathable film).
Validation of the protocol
Capsid stability
An experiment was conducted to test whether treatment of lysates with DNase causes a change in the titer of plaque forming units. From each phage, 18–24 separate lysates were obtained and quantified using a plaque assay. Lysates where then treated with DNase and quantified again with a plaque assay before the final heat-inactivation step.
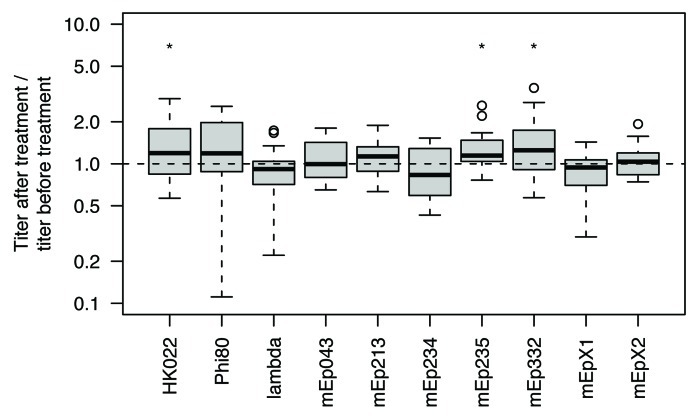
Significant (p < 0.05, Wilcoxon signed-rank test) changes in phage titer were observed in three of ten phages (Fig. 1). Of these, the largest change (+25%) occurred in phage mEp332. This change is moderate when compared with the inter-assay variance, which is typically larger.10 It is concluded that the observed effect is not relevant for quantification.
Figure 1. Ratio of plaque forming units in lysates of different phages after and before treatment with DNase. Eighteen to 24 independently obtained lysates were quantified for every phage.
Efficiency of the DNase treatment
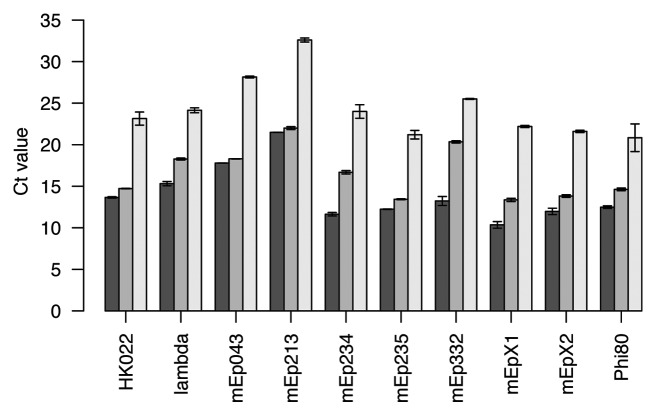
The amount of phage DNA in lysates that is not enclosed in capsids was measured by amplifying 3–6 lysates per phage with qPCR both before and after DNase treatment. Ct values were consistently higher in treated than in untreated samples (Fig. 2). Samples of phage mEp332 showed the largest difference (Δct = 7.1), which corresponds to a 100-fold excess of non-encapsidated phage DNA relative to DNA in virions (assuming an amplification efficiency of 95%).
Figure 2. Amount of DNA as measured by qPCR in lysates that were either not treated with DNase (dark gray bars), treated with DNase (gray bars), or heated to 95°C and then treated with DNase (light gray bars). Error bars are standard errors of 3–6 replicates.
To estimate DNase efficiency, lysates were kept at 95°C for 30 min prior to DNase treatment. When these samples were quantified with qPCR, their ct values were found to be at least 8.4 cycles above those of untreated samples (Fig. 2). Thus, DNase removes at least 99.6% of all accessible DNA (assuming an amplification efficiency of 95%). Together, the results confirm that treatment with DNase efficiently removes non-encapsidated DNA from lysates. Using the numbers obtained, the worst possible case is an overestimation of the titer of phage mEp332 by 3% due to residual non-encapsidated DNA.
Primer specificity
All primers were tested in replicate amplification reactions against lysates of all phages and water controls. Generally, primers were found to only amplify the respective target sequence. After controlling for differences in melting temperature (using a difference of > 1°C from that of the target sequence as criterion for exclusion), 18 of 196 negative controls yielded detectable amplifications that would have been accepted as positive results had they occurred in samples with unknown content. Typically, these arose very late (ct > 35, which corresponds to less than two copies of the target sequence) and inconsistently among replicates. The exception were primers qPCR_mEp235 and qPCR_mEp235b, which very weakly cross-amplified samples of phages λ, mEp332, and mEpX1, and λ, mEp234, and mEp332, respectively. Ct values of these cross-amplifications were all above 30, which corresponds to less than 10 phages. Therefore, these cross-amplifications cause a negligible bias in the quantification of phages. However, detections of very low numbers of phages (in particular phage mEp235) in samples of unknown content must be interpreted with the appropriate caution.
Amplification efficiency
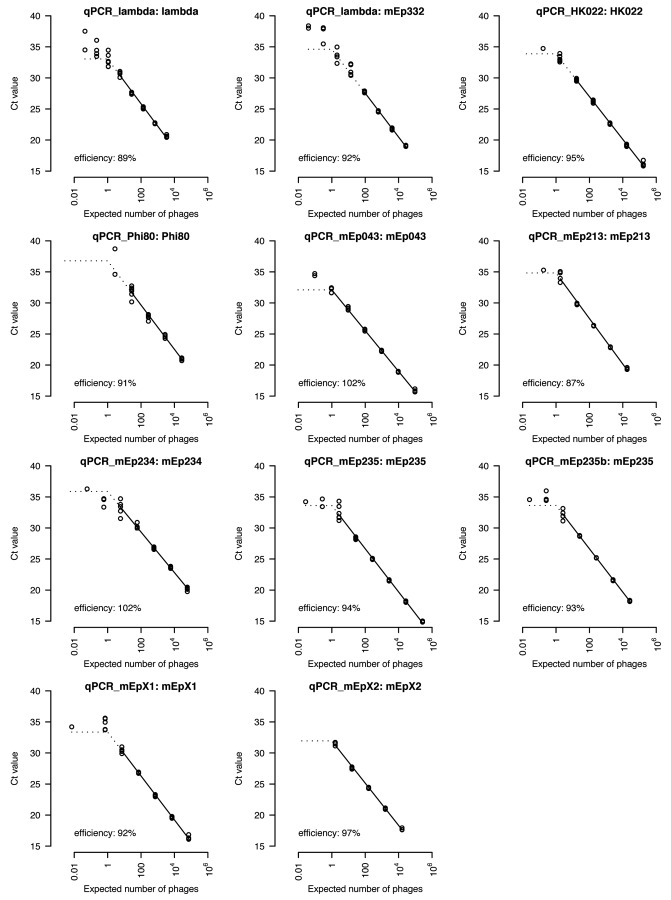
Lysates from all phages were quantified with plaque assays, treated with DNase and then serially diluted down to an expected number of 0.01 phages in the amplification reaction. Standard curves were constructed by amplifying at least four replicates per dilution step (Fig. 3). Amplification efficiencies, estimated by linear regression, were found to be between 87 and 102% and were estimated using the data that are connected by a solid line in Figure 3. This was done to avoid overestimating amplification efficiencies, which occurs when dilution steps are included that contain replicates where no phages were detected.
Figure 3 Standard curves for all primers and their respective target phages. The title of every plot gives the names of the primers and phage that have been used. The solid line connects data points to which a linear regression model has been fitted to calculate amplification efficiency. The regression is then extended by the dotted line down to an expected number of one phage, after which it is continued horizontally to the most diluted sample that has been used. Ideally, all data points should follow this line.
Detection limit
If qPCR is congruent with a plaque assay, a single phage genome per reaction defines the largest obtainable ct value (horizontal dashed lines in Figure 3). When this limit is approached, variation among replicates increases as the actual number of phage genomes follows a Poisson-distribution. Five percent of all samples with an expected number of three phage genomes will be empty. Ten percent of all samples with an expected number of 0.1 phage genomes will contain a single phage genome, the others none.
Analysis of the amplified dilution series revealed that the detection limit was reached when samples contained an expected number between 0.1 and 2.8 phages, depending on phages and primers used. This suggests that results obtained by qPCR are congruent with those of a plaque assay.
Example: Prophage induction in single, double, and triple lysogens
Four triple lysogens (λ/HK022/mEpX2, λ/mEp213/mEp235, λ/mEpX1/mEp235, λ/mEpX1/mEpX2), as well as all possible single and double lysogens of these phages were constructed and validated as described previously.5 Of each lysogen, seven independent lysates were obtained and treated, and the amount of individual phages was quantified by qPCR. To obtain standards against which phages can be quantified, one lysate from each single lysogen was quantified with a plaque assay and used in a dilution series with five steps and two replicates each.
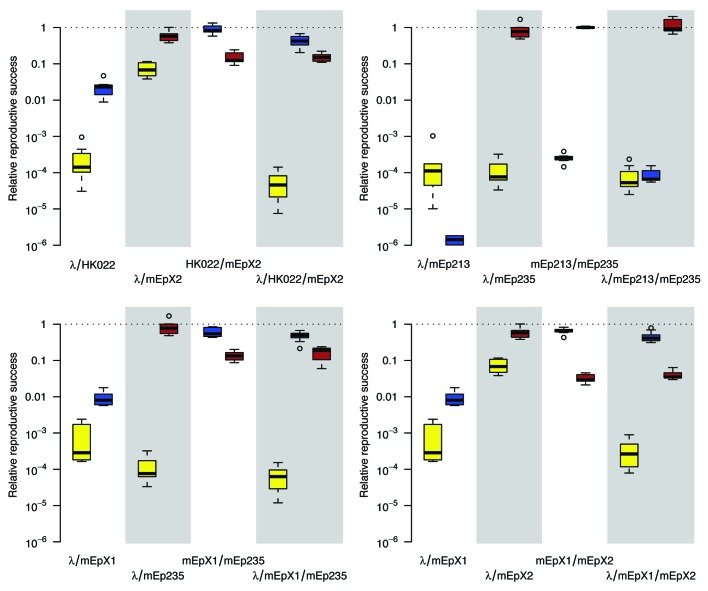
Productivity as measured in single lysogens is interpreted as the baseline performance of a phage.5 All measurements from double and triple lysogens were normalized by expressing them relative to the baseline performance of the respective phage. Results from single and double lysogens were in accordance with an earlier study, where measurements were obtained with a plaque assay.5 Together with the small variation among replicates, this indicates that quantification with qPCR provides reliable results (Fig. 4).
Figure 4. Quantification of phages that are released upon induction of lysogens that carry multiple prophages. Reproductive success of every phage is given relative to that achieved in a single lysogen. Box-plots summarize the results of seven replicates. Colors indicate data from phage λ (yellow), phages HK022, mEp213, or mEpX1 (blue) and phages mEp235 or mEpX2 (brown).
Results were analyzed by first grouping them according to each of the four triple lysogens and the corresponding double lysogens (which corresponds to the four panels in Fig. 4). Data were then log-transformed and analyzed with analysis of variance including a single factor that separated all nine titer measurements in the different lysogens (which corresponds to the nine box-plots in each panel of Fig. 4). Titers of the same phage in lysates from different lysogens were compared with Tukey's HSD test at a 95% confidence level.
The results show that induction of double lysogens that contain phage λ together with either phage HK022, mEp213, or mEpX1, results in lysates where the titer of both phages is strongly reduced. Other double lysogens did not exhibit such a strong interference, as always one phage kept its titer close to its baseline performance.
Interestingly, the negative effect of phage λ on phages HK022, mEp213, and mEpX1, was removed by the addition of either phage mEp235 or mEpX2 (Fig. 4). In these triple lysogens, the titer of phage λ was still strongly reduced, yet the titer of phages HK022, mEp213, or mEpX1 increased about a hundred-fold to a level similar to that of the corresponding double lysogen that does not contain phage λ. The results show that the interaction of multiple prophages can have unexpected outcomes that are not predictable based on observations of individual phages. The mechanism behind these interactions remains to be explained.
Disclosure of Potential Conflicts of Interest
No potential conflicts of interest were disclosed.
Acknowledgments
I thank Michael Dal Molin for help in the laboratory, Sebastian Bonhoeffer for general support, and the Genetic Diversity Centre (GDC) at the Swiss Federal Institute of Technology (ETH) Zürich for providing a work platform. This work is part of the project “Genetic Diversity of Hosts and Parasites” (0-21248-08), funded by the Competence Center Environment and Sustainability of the ETH Zürich (http://www.cces.ethz.ch/).
Footnotes
Previously published online: www.landesbioscience.com/journals/bacteriophage/article/20092
References
- 1.Uc-Mass A, Loeza EJ, de la Garza M, Guarneros G, Herńndez-Sánchez J, Kameyama L. An orthologue of the cor gene is involved in the exclusion of temperate lambdoid phages. Evidence that Cor inactivates FhuA receptor functions. Virology. 2004;329:425–33. doi: 10.1016/j.virol.2004.09.005. [DOI] [PubMed] [Google Scholar]
- 2.Molineux IJ. Host-parasite interactions: recent developments in the genetics of abortive phage infections. New Biol. 1991;3:230–6. [PubMed] [Google Scholar]
- 3.Casjens S. Prophages and bacterial genomics: what have we learned so far? Mol Microbiol. 2003;49:277–300. doi: 10.1046/j.1365-2958.2003.03580.x. [DOI] [PubMed] [Google Scholar]
- 4.Hendrix RW, Smith MC, Burns RN, Ford ME, Hatfull GF. Evolutionary relationships among diverse bacteriophages and prophages: all the world’s a phage. Proc Natl Acad Sci U S A. 1999;96:2192–7. doi: 10.1073/pnas.96.5.2192. [DOI] [PMC free article] [PubMed] [Google Scholar]
- 5.Refardt D. Within-host competition determines reproductive success of temperate bacteriophages. ISME J. 2011;5:1451–60. doi: 10.1038/ismej.2011.30. [DOI] [PMC free article] [PubMed] [Google Scholar]
- 6.Clokie MRJ, Kropinski AM. Bacteriophages: Methods and Protocols, Volume 1: Isolation, Characterization, and Interactions, 1st ed. New York, NY: Humana Press; 2008. [Google Scholar]
- 7.Refardt D, Ebert D. Quantitative PCR to detect, discriminate and quantify intracellular parasites in their host: an example from three microsporidians in Daphnia. Parasitology. 2006;133:11–8. doi: 10.1017/S0031182006000060. [DOI] [PubMed] [Google Scholar]
- 8.Cheesman SJ, de Roode JC, Read AF, Carter R. Real-time quantitative PCR for analysis of genetically mixed infections of malaria parasites: technique validation and applications. Mol Biochem Parasitol. 2003;131:83–91. doi: 10.1016/S0166-6851(03)00195-6. [DOI] [PubMed] [Google Scholar]
- 9.Edelman DC, Barletta J. Real-time PCR provides improved detection and titer determination of bacteriophage. Biotechniques. 2003;35:368–75. doi: 10.2144/03352rr02. [DOI] [PubMed] [Google Scholar]
- 10.Anderson B, Rashid MH, Carter C, Pasternack G, Rajanna C, Revazishvili T, et al. Enumeration of bacteriophage particles: Comparative analysis of the traditional plaque assay and real-time QPCR- and nanosight-based assays. Bacteriophage. 2011;1:86–93. doi: 10.4161/bact.1.2.15456. [DOI] [PMC free article] [PubMed] [Google Scholar]
- 11.Rooks DJ, Yan Y, McDonald JE, Woodward MJ, McCarthy AJ, Allison HE. Development and validation of a qPCR-based method for quantifying Shiga toxin-encoding and other lambdoid bacteriophages. Environ Microbiol. 2010;12:1194–204. doi: 10.1111/j.1462-2920.2010.02162.x. [DOI] [PubMed] [Google Scholar]
- 12.Martín MC, del Rio B, Martínez N, Magadán AH, Alvarez MA. Fast real-time polymerase chain reaction for quantitative detection of Lactobacillus delbrueckii bacteriophages in milk. Food Microbiol. 2008;25:978–82. doi: 10.1016/j.fm.2008.07.004. [DOI] [PubMed] [Google Scholar]
- 13.del Rio B, Martín MC, Martínez N, Magadán AH, Alvarez MA. Multiplex fast real-time PCR for quantitative detection and identification of cos- and pac-type Streptococcus thermophilus bacteriophages. Appl Environ Microbiol. 2008;74:4779–81. doi: 10.1128/AEM.00295-08. [DOI] [PMC free article] [PubMed] [Google Scholar]
- 14.Refardt D, Rainey PB. Tuning a genetic switch: experimental evolution and natural variation of prophage induction. Evolution. 2010;64:1086–97. doi: 10.1111/j.1558-5646.2009.00882.x. [DOI] [PubMed] [Google Scholar]
- 15.White RA, 3rd, Quake SR, Curr K. Digital PCR provides absolute quantitation of viral load for an occult RNA virus. J Virol Methods. 2012;179:45–50. doi: 10.1016/j.jviromet.2011.09.017. [DOI] [PubMed] [Google Scholar]
- 16.Losá JM, Golec P, Węgrzyn G, Węgrzyn A, Losá M. Simple method for plating Escherichia coli bacteriophages forming very small plaques or no plaques under standard conditions. Appl Environ Microbiol. 2008;74:5113–20. doi: 10.1128/AEM.00306-08. [DOI] [PMC free article] [PubMed] [Google Scholar]
- 17.Parsley LC, Consuegra EJ, Thomas SJ, Bhavsar J, Land AM, Bhuiyan NN, et al. Census of the viral metagenome within an activated sludge microbial assemblage. Appl Environ Microbiol. 2010;76:2673–7. doi: 10.1128/AEM.02520-09. [DOI] [PMC free article] [PubMed] [Google Scholar]
- 18.Minot S, Sinha R, Chen J, Li H, Keilbaugh SA, Wu GD, et al. The human gut virome: inter-individual variation and dynamic response to diet. Genome Res. 2011;21:1616–25. doi: 10.1101/gr.122705.111. [DOI] [PMC free article] [PubMed] [Google Scholar]
- 19.López-Bueno A, Tamames J, Velázquez D, Moya A, Quesada A, Alcamí A. High diversity of the viral community from an Antarctic lake. Science. 2009;326:858–61. doi: 10.1126/science.1179287. [DOI] [PubMed] [Google Scholar]
- 20.Williamson SJ, Rusch DB, Yooseph S, Halpern AL, Heidelberg KB, Glass JI, et al. The Sorcerer II Global Ocean Sampling Expedition: metagenomic characterization of viruses within aquatic microbial samples. PLoS One. 2008;3:e1456. doi: 10.1371/journal.pone.0001456. [DOI] [PMC free article] [PubMed] [Google Scholar]
- 21.Berngruber TW, Weissing FJ, Gandon S. Inhibition of Superinfection and the evolution of viral latency. J Virol. 2010;84:10200–8. doi: 10.1128/JVI.00865-10. [DOI] [PMC free article] [PubMed] [Google Scholar]
- 22.Flores CO, Meyer JR, Valverde S, Farr L, Weitz JS. Statistical structure of host-phage interactions. Proc Natl Acad Sci U S A. 2011;108:E288–97. doi: 10.1073/pnas.1101595108. [DOI] [PMC free article] [PubMed] [Google Scholar]
- 23.Weitz JS, Dushoff J. Alternative stable states in host-phage dynamics. Theor. Ecol. 2008;1:13–9. doi: 10.1007/s12080-007-0001-1. [DOI] [Google Scholar]
- 24.Mittler JE. Evolution of the genetic switch in temperate bacteriophage. I. Basic theory. J Theor Biol. 1996;179:161–72. doi: 10.1006/jtbi.1996.0056. [DOI] [PubMed] [Google Scholar]
- 25.Levin BR, Bull JJ. Population and evolutionary dynamics of phage therapy. Nat Rev Microbiol. 2004;2:166–73. doi: 10.1038/nrmicro822. [DOI] [PubMed] [Google Scholar]
- 26.Payne RJH, Phil D, Jansen VA. Phage therapy: the peculiar kinetics of self-replicating pharmaceuticals. Clin Pharmacol Ther. 2000;68:225–30. doi: 10.1067/mcp.2000.109520. [DOI] [PubMed] [Google Scholar]
- 27.Tanji Y, Shimada T, Fukudomi H, Miyanaga K, Nakai Y, Unno H. Therapeutic use of phage cocktail for controlling Escherichia coli O157:H7 in gastrointestinal tract of mice. J Biosci Bioeng. 2005;100:280–7. doi: 10.1263/jbb.100.280. [DOI] [PubMed] [Google Scholar]
- 28.Kameyama L, Ferńndez L, Calderón J, Ortiz-Rojas A, Patterson TA. Characterization of wild lambdoid bacteriophages: detection of a wide distribution of phage immunity groups and identification of a nus-dependent, nonlambdoid phage group. Virology. 1999;263:100–11. doi: 10.1006/viro.1999.9888. [DOI] [PubMed] [Google Scholar]
- 29.Matsushiro A. Isolation of UV-inducible temperate phage Φ80. Biken J. 1961;4:133–5. [Google Scholar]
- 30.Dhillon EK, Dhillon TS, Lam YY, Tsang AH. Temperate coliphages: classification and correlation with habitats. Appl Environ Microbiol. 1980;39:1046–53. doi: 10.1128/aem.39.5.1046-1053.1980. [DOI] [PMC free article] [PubMed] [Google Scholar]


