

Abstract
Mutations of oncogenes and tumor suppressor genes which activate mTOR through several downstream signaling pathways are common to cancer. Activation of mTOR when combined with inhibition of cell cycle progression or DNA replication stress has previously been shown to promote cell senescence. In the present study, we examined the conditions under which human non-small cell lung carcinoma A549 cells can undergo senescence when treated with the DNA alkylating agent mitomycin C (MMC). While exposure of A549 cells to 0.1 or 0.5 µg/ml of MMC led to their arrest in S phase of the cell cycle and subsequent apoptosis, exposure to 0.01 or 0.02 µg/ml for 6 d resulted in induction of cell senescence and near total (0.01 µg/ml) or total (0.02 µg/ml) elimination of their reproductive potential. During exposure to these low concentrations of MMC, the cells demonstrated evidence of DNA replication stress manifested by expression of γH2AX, p21WAF1 and a very low level of EdU incorporation into DNA. The data are consistent with the notion that enduring DNA replication stress in cells known to have activated oncogenes leads to their senescence. It is reasonable to expect that tumors having constitutive activation of oncogenes triggering mTOR signaling may be particularly predisposed to undergoing senescence following prolonged treatment with low doses of DNA damaging drugs.
Keywords: cell cycle, human non-small cell lung carcinoma, mTOR, metronomic chemotherapy, oncogenes, personalized cancer treatment, senescence, γH2AX
Introduction
Cellular senescence, an irreversible cell cycle arrest, was first defined in 1961 when Hayflick and Moorhead observed that normal cells have a finite proliferative capacity. Cells growing in culture were capable of dividing only a certain number of times before entering a state of proliferative arrest.1 The phenomenon has been attributed to the erosion of telomeres every time a cell divides, leading to their dysfunction.2 This type of cell senescence, known as intrinsic or replicative senescence, is generally associated with aging.3 More recently a second type, called extrinsic, premature or stress-induced senescence, has been defined. It can be triggered by oncogene activation, inactivation of tumor suppressor genes, persistent replication stress, oxidative stress or treatment of cells with DNA damaging drugs or radiation.4
Cell senescence plays a number of different roles, some of which specifically relate to cancer. In some instances senescence acts as a barrier to cancer by preventing normal cells from undergoing tumorigenesis.5,6 Another role is in response to cancer treatment. Traditional cytotoxic chemotherapy regimens are designed to kill tumor cells through the process of apoptosis.7 While induction of apoptosis is predominant, the induction of senescence has also been seen in some types of solid tumors during chemotherapy.8 It is difficult to assess, however, what role, if any, induction of senescence in tumor cells plays in instances where chemotherapy proves effective.
The activation of oncogenes and/or inhibition of tumor suppressor genes are a hallmark of most cancers.9 These events predispose or cause cells to undergo senescence.10-13 It is reasonable to expect, therefore, that under similar stress conditions, cancer cells that have constitutively activated oncogenes or dysfunctional tumor suppressors may be more prone to undergo senescence than normal cells. Given the fact that cytotoxic chemotherapy provided at the maximum tolerated dose (MTD) is generally highly toxic, strategies may be designed to use chemotherapy at much lower concentrations to render tumor cells senescent, thereby minimizing some of the drug-induced toxicity.
For years, the acceptance of antitumor drugs by the FDA was based on response criteria assessed by tumor shrinkage visualized by CT, MRI or traditional X-ray examination. Tumor shrinkage observed this way most likely occurs as a result of cell death by apoptosis. Assessment of the tumor response by its size reduction criteria precluded the detection of potential treatment benefits that could be mediated by induction of senescence of tumor cells.
Interestingly, it has recently been shown that some patients benefit from a non-traditional regimen known as metronomic chemotherapy, defined as continuous or frequent treatment with low doses of anticancer drugs.14 While it has generally been assumed that such treatment inhibits tumor angiogenesis,15 no evidence exists as to whether, and to what extent, the induction of cell senescence of the tumor cells contributes to beneficial effects of metronomic therapy.
The aim of the present study was to explore the possibility and assess the conditions by which cell senescence (“reproductive cell death”) could be induced in A549 human non-small cell pulmonary carcinoma cells in vitro with mitomycin C (MMC). MMC is a chemotherapeutic agent that has been used in the treatment of cancer since 1974.16 Throughout its history, MMC has been used to treat a wide variety of tumors, including adenocarcinoma of the stomach and pancreas, anal cancer, bladder cancer, breast cancer, cervical cancer, colorectal cancer, head and neck cancer and non-small cell lung cancer.17 It acts as a bi-alkylating and DNA crosslinking agent.18 Clinically, it is given intravenously and has a half-life of approximately 50 min in the blood.18 MMC is metabolized in the liver.18 A typical IV dose is 20 mg/m2, with a concentration achievable in the blood of 2.4 μg/ml. The present study demonstrates that there are MMC concentrations and lengths of exposure considerably lower that the MTD that drive the entire A549 cell population to senescence, eliminating their reproductive potential.
Results
Short-term effects of treatment with MMC
A549 cells were treated continuously for varying lengths of time (8–72 h) with 0.01–2.0 µg/ml MMC. Analysis of the DNA content histograms revealed the accumulation of cells in S phase following 24 h exposure to 0.1–0.5 µg/ml MMC (Fig. 1A). However, treatment with 1.0–2.0 µg/ml MMC for 24 h showed no significant changes in the DNA histogram when compared with the control (Fig. 1A). The percentage of cells in the respective cell cycle phases are presented in Figure 1B. The accumulation of cells in S phase persisted after treatment with 0.5 µg/ml MMC for 48 and 72 h. The cell cycle distribution for cells treated with 1.0 µg/ml MMC demonstrated only a modest increase in S and G2M phase cells at 72 h whereas cells treated with 2.0 µg/ml MMC showed little change in their cell cycle distribution though the histograms began to show the presence of cells with fractional DNA content (“sub-G1 cells”) typically associated with apoptotic cell death (Fig. 1A, arrow).

Figure 1. Effect of continuous treatment with MMC on cell cycle, apoptosis and EdU incorporation. (A) Exponentially growing A549 cells were left untreated (Control) or were continuously exposed to 0.1–2.0 µg/ml MMC for up to 72 h. A) DNA content frequency histograms; the arrow indicates objects with fractional DNA content (sub-G1), likely apoptotic cells. (B) Percentage of cells in respective phases of the cell cycle. The ST and G2MT/G1O represent cells at a higher DNA ploidy. (C) Percent of cells expressing activated (cleaved) caspase-3. (D) Exponentially growing cells untreated (Control) or treated with 0.1–2.0 µg/ml MMC for 24 h were exposed to EdU for 1 h. On these bivariate (DNA content vs EdU incorporation) distributions the cells above the dashed (threshold) line are positive for EdU. The percent of cells with an S-phase DNA content that show evidence of EdU incorporation (above the threshold) is shown in each panel.
Activation of caspase-3 is a characteristic feature of apoptotic cells. To determine whether the cells indeed were undergoing apoptosis they were treated for 8–72 h with 0.5–2.0 µg/ml MMC and immunostained for activated (cleaved) caspase-3. The data show that up to 20% of cells treated with 2.0 µg/ml MMC had undergone apoptosis at 72 h, while cells treated with lower drug concentrations did not (Fig. 1C).
To determine the cause for the observed changes in the cell cycle distribution of A549 cells following 24 h continuous treatment with MMC, a pulse of the DNA precursor EdU was added to the cultures for 1 h prior to fixation. Cells treated with 0.1–2.0 µg/ml MMC showed a dramatic decrease in EdU fluorescence, indicating they were replicating DNA at a very slow rate and, thus, traversing S phase extremely slowly (Fig. 1D). Analysis also revealed that 75–83% of cells considered to be in S phase based on DNA content did not incorporate detectable EdU following treatment with 0.5–2.0 µg/ml MMC which meant those cells had stopped progressing through S phase.
Long-term treatment with low MMC concentration
Since exposure to MMC concentrations of 0.1 µg/ml or higher blocked cells in S phase or prevented their entry into S phase, A549 cells were exposed to prolonged treatment at lower drug concentrations. Thus, the cells were treated continuously with 0.01–0.05 µg/ml MMC for 3 or 6 d. The treatment for 3 d led to a decrease in the proportion of G1 phase cells and an increase in G2M phase cells as well as an accumulation of cells with a DNA content above a DNA index of 2.0 (DI > 2.0) (Fig. 2A). The accumulation of DI > 2.0 cells was even more pronounced following 6 d continuous treatment with 0.01–0.02 µg/ml MMC (Fig. 2A). It is important to note that these higher DNA ploidy cells are always present in control cultures of A549 cells, but since they make up a small percentage of the total population, their presence is often ignored. At present, we define the cells with a DI = 1.0 as G1 (diploid) cells, cells with a DI = 2.0 as G2M phase diploid cells plus G1 cells of the higher ploidy (G1T; tetraploid) and cells with a DI = 4.0 as G2M tetraploid cells (G2MT) plus possibly G1 octoploid cells (G1O). Each of the different DNA ploidy populations have S phase cells which were designated as S for the diploid and ST for the tetraploid populations, respectively.

Figure 2. Cell cycle changes following prolonged treatment with low concentrations of MMC. (A) DNA content frequency histograms of the untreated and treated cells. The cell cycle phases of cells at diploid and higher DNA ploidy level are marked (see the text). (B) The percentage of cells in respective phases of the cell cycle and at different DNA ploidy is shown on the bar graphs.
The percentage of cells at these higher DNA ploidies (DI = 2.0 and 4.0) increased after treatment with 0.01–0.02 µg/ml MMC for 3 or 6 d with a concomitant decrease in proportion of G1 phase cells (DI = 1.0) (Fig. 2A and B). Treatment with 0.05 µg/ml MMC, however, did not give rise to a significant number of cells at a DI = 4.0; the vast majority of cells accumulated in a population with a DI = 2.0 (Fig. 2A and B). Accumulation of G2M and G2MT cells combined with the evidence of suppression of DNA replication (Fig. 1D) indicate that following treatment with 0.01 and 0.02 µg/ml MMC, the cells were still moving through the S and ST phase, albeit at a very slow pace.
When cells with a DI = 2.0 were visualized by LSC, it was clear that nearly all cells (> 90%) contained a single nucleus with increased nuclear area (Fig. S1), indicating that they entered a higher ploidy by the process of endoreduplication rather than endomitosis.
Persistent replication stress is known to induce cell senescence.19-21 It is quite evident that at MMC concentrations of 0.01 and 0.02 µg/ml, some cells were replicating DNA at a minimal rate and thus were subjected to persistent replication stress. Attempts have been made, therefore, to determine whether these cells were undergoing senescence. One of the biomarkers of DNA replication stress and induction of senescence is the presence of DNA damage signaling, of which phosphorylation of histone H2AX on Ser139 (γH2AX) is a prominent feature.19,20 Therefore, we tested for the induction of this biomarker in cells subjected to 3 and 6 d exposure to 0.01 and 0.02 µg/ml MMC. Induction of γH2AX showed a concentration-dependent increase at 3 d, which remained constant from 3 to 6 d (Fig. 3). The mean level of γH2AX fluorescence for all cells increased about 2-fold over the control, untreated cells following treatment with 0.01 µg/ml MMC, and to greater than 3.5-fold when treated with 0.02 µg/ml MMC. There was no significant increase in the percentage of cells positive for activated caspase-3 following treatment with either concentration of drug for up to 6 d, which otherwise would indicate the induction of apoptosis (Fig. S2).

Figure 3. Induction of γH2AX in cells treated with MMC. Exponentially growing, A549 cells were untreated (Control) or exposed to 0.01 or 0.02 µg/ml MMC for 3 or 6 d. (A) Bivariate distributions reveal expression of γH2AX as a function of DNA content. (B) Mean γH2AX expression for the total cell populations shown as n-fold increase above γH2AX mean of the untreated cells.
Induction of senescence-associated β-galactosidase activity is considered the most specific marker of cell senescence.22 Cells exposed to low concentrations of MMC were tested for the expression of this biomarker. It is quite evident that β-galactosidase activity was dramatically increased in the MMC-treated cells (Fig. 4A). Their cellular and nuclear size was also markedly enlarged. Another characteristic feature of the MMC-treated cells was low cell density at confluence (Fig. 4A), which is also typical of senescence (5). While only a small percentage of cells were positive for β-galactosidase following 3 d of treatment, over 90% were β-galactosidase-positive after 6 d (Fig. 4B). These cells also expressed p21WAF1 (Fig. 5A), a cyclin-dependent kinase inhibitor that is associated with cell senescence.23,24 Similar to β-galactosidase, there was no significant increase in p21WAF1 seen following 3 d treatment, while there was a 10- to 15-fold increase after 6 d (Fig. 5B).

Figure 4. Induction of senescence-associated β-galactosidase activity in cells treated with MMC. The cells were untreated or treated with 0.01 or 0.02 μg/ml MMC for 3 or 6 d. (A) Images taken by the LSC represent control (top) and treated (bottom) cells. Activity of β-galactosidase is shown in cytoplasm (blue); DAPI-stained nuclei are colored electronically (magenta). Images were taken at the same magnification. (B) The percentage of cells in each of the three main DNA ploidy levels (marked by dashed gates on the DNA content histogram) are presented as full bars; the cells positive for β-galactosidase activity per each DNA ploidy level are shown as black fill in the respective bars.

Figure 5. Induction of p21WAF1 after cells exposure to low concentrations of MMC. (A) Bivariate distributions (DNA content vs. expression of p21WAF1) of cells growing in the presence of 00.1 or 0.02 μg/ml of MMC for 3 or 6 d. (B) Expression of γH2AX for each cell cycle compartment (mean values) plotted as n-fold increase above the means of the untreated cells
We have recently established a method to quantitatively assess the degree (“depth”) of cell senescence through morphometric analysis of their characteristic changes in nuclear morphology.25 The method is based on analysis of the ratio of the local nuclear DNA staining intensity (maximum pixel of fluorescence intensity of a DNA-associated fluorochrome, mp) to nuclear area (mp/area), assessed by imaging cytometry.25 The decrease in this ratio, which was defined as the cell senescence index (SI), is a sensitive and quantitative reporter of the “flattening” of the cell on the surface of the slide, resulting in the DNA being spread out over a larger nuclear area.25 The data show that treatment of cells with either 0.01 or 0.02 µg/ml MMC for 3 or 6 d led to a significant decrease in this ratio which was distinctly more pronounced at 6 d compared with 3 d of treatment (Fig. 6).

Figure 6. Morphometric changes of A549 cells growing in the presence of low concentration of MMC. The intensity of the DNA-associated (DAPI) fluorescence and nuclear area were measured by LSC as described in Materials and Methods. (A) Bivariate distributions (DAPI maximal pixel vs. nuclear area). Oval borders delineate the three main DNA ploidy cell subpopulations as marked. To better visualize the changes in the MMC-treated cells the dashed vertical line indicates the maximal pixel center of the control population of cells. Note an increase in nuclear area concomitant with a decrease in maximal pixel per each subpopulation of the MMC-treated cells. (B) The ratio of the maximum pixel (mp) to nuclear area. This ratio was significantly decreased (p < 0.05) in cells treated with MMC as indicated (*).
Even though it appeared that most cells had entered senescence and were present at DI = 1.0, 2.0 and 4.0 ploidy levels, there were still a small number of cells present in S phase, and it was important to determine whether these cells continued to replicate DNA. Therefore, a 1 h pulse of EdU was given to cells treated for 6 d with either 0.01 or 0.02 µg/ml MMC just prior to cell fixation. The total percentage of cells incorporating EdU dropped from 42.7% in the control to 7.6% and 3.7% after 6 d of treatment with 0.01 and 0.02 µg/ml MMC, respectively (Fig. 7A). Due to the accumulation of cells at a higher DNA ploidy, there were two separate S phases to be considered; cells cycling between a DI = 1.0 and 2.0 (S) and cells cycling between a DI = 2.0 and 4.0 (ST). Treatment with either MMC concentration led to a decrease in the percentage of both S and ST phase cells that were positive for EdU (Fig. 7B). It was evident that even though the majority of the cells appeared to be senescent, there were still a few cells that continued to traverse S phase.

Figure 7. Incorporation of EdU by cells treated for 3 or 6 d with MMC. Exponentially growing, A549 cells were untreated (Control) or exposed to 0.01 or 0.02 µg/ml MMC for 3 or 6 d and then for 1 h to EdU. (A) Bivariate distributions illustrating DNA content vs. EdU incorporation. The horizontal dashed line represents the level of fluorescence of cells not exposed to EdU; the cells above this line incorporated EdU at variable extent. The vertical dashed lines indicate the division between the S phases of different DNA ploidy (S, ST). The percent of cells positive for EdU for both S and ST is given at the top and separately for S and ST, below. (B) Bar graphs showing the percent of cells in each S phase (total bar), and of cells positive for EdU (black bar).
To determine whether the cells that incorporated EdU were capable of continued proliferation, the cells from these cultures were subjected to a clonogenicity assay. To this end, the cells treated for 6 d with 0.01 or 0.02 µg/ml MMC were trypsinized and re-plated at low cell densities. There was no evidence that senescence affected the ability of cells to reattach following trypsinization (Fig. 8A). Control slides were also plated at a low cell density and all cells were allowed to grow for 1 week to determine their ability to form colonies. While untreated cells produced on average 398 colonies (from 1,000 cells) (Fig. 8B), demonstrating the normal cloning efficiency of A549 cells to be approximately 40%; the cells treated with 0.01 µg/ml MMC had only 1.8% clonogenicity, whereas, in repeated experiments, there was not a single colony formed on slides from the cells treated with 0.02 µg/ml MMC (Fig. 8A). It should be noted that cells treated with MMC in the clonogenicity experiment showed a similar decrease in mp/area ratio and EdU incorporation as was previously observed following 6 d treatment (Fig. S3).
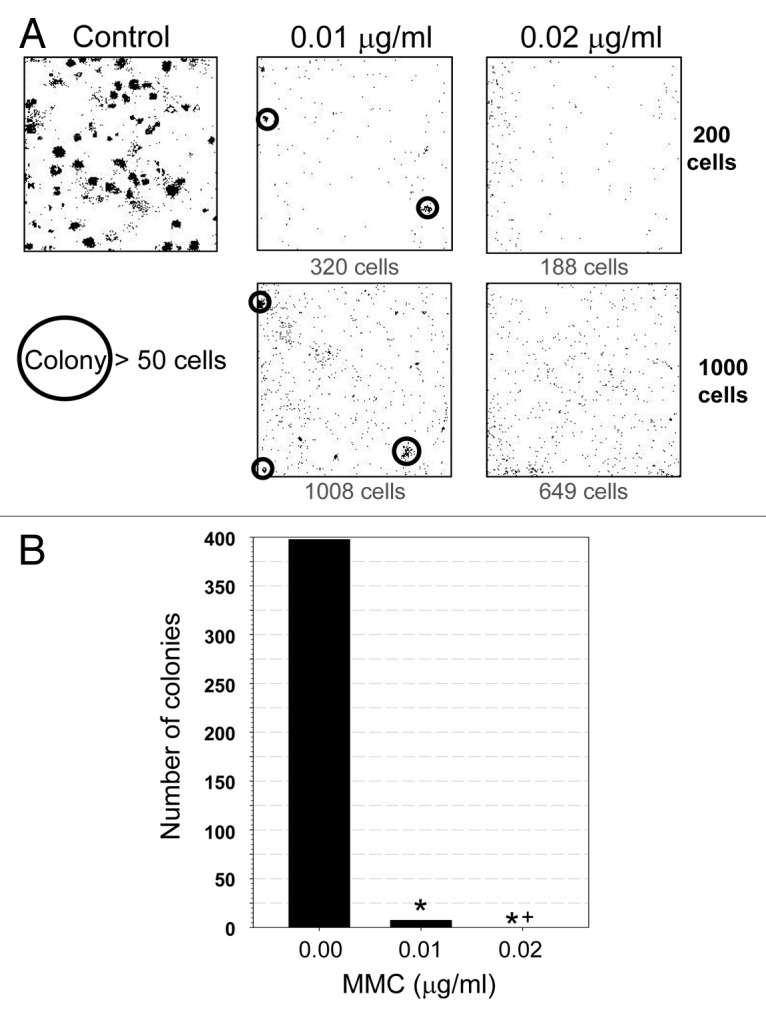
Figure 8. Effect of treatment with low concentration of MMC on clonogenic potential of A549 cells. Exponentially growing A549 cells were untreated (control) or exposed to 0.01 or 0.02 µg/ml MMC for 6 d. Cells were then trypsinized, counted, plated (200 or 1000 cells/plate), and allowed to grow in drug-free media for 7 d. The plates were then imaged by LSC. (A) Representative images of the sites of plated cells; each dot represents a single cell. Cell colonies (> 50 cells) are circled. The number of cells present in the plate is indicated below each box. (B) The number of colonies plotted as a function of MMC concentration. Statistically significant differences (p < 0.05) are indicated (*, statistically different from the control; *+, statistically different from 0.01 µg/ml).
Discussion
The present data indicate that treatment of A549 cells with relatively high (0.1 – 2.0 µg/ml) concentrations of MMC resulted in nearly total suppression of DNA replication that manifested as a distinct arrest in S phase with little or no change in the cell cycle distribution; apoptosis was induced at longer culture times following treatment with 2.0 µg/ml MMC (Fig. 1). Prolonged (6 d) exposure of cells to 0.01 or 0.02 µg/ml MMC, however, led to induction of cell senescence. In fact, the irreversible senescence, manifested as the total cell’s inability to form colonies, was observed after treatment with 0.02 µg/ml MMC, while few cells were still able to proliferate after exposure to 0.01 µg/ml (Fig. 8). This correlated with the “depth” of senescence assessed by morphometric analysis of the cell’s nuclear size and shape (mp/area) after 6 d of treatment, as the SI index25 decreased from 1.0 in control cells to 0.41 vs. 0.34 in cells exposed to 0.01 and 0.02 µg/ml MMC, respectively (Fig. 6B). These MMC concentrations, which are two orders of magnitude lower than the MTD used in cytotoxic chemotherapy regimens, make our findings clinically relevant. Thus, the prolonged exposure of cells to a DNA damaging drug at concentrations sufficient to induce persistent replication stress (reflected by histone H2AX phosphorylation and induction of p21WAF1) but low enough not to suppress protein synthesis (reflected by increase in cell size) can result in induction of reproductive cell death.
There is significant evidence that induction of cell senescence may be achieved by variety of anticancer drugs. An in vitro study using high cytotoxic doses of DNA topoisomerase inhibitors revealed that, in response to treatment, two of five cancer cell lines underwent apoptosis, while the other three tended to be permanently arrested in the cell cycle or senescent.26 An in vivo study in mice with myc-induced lymphomas found the presence of senescent cells following treatment with a single high dose of cyclophosphamide and the presence of senescent cells correlated with better survival.27 In an important and perhaps underappreciated observation, senescent cells were also seen in over 40% of biopsies from patients with lung or breast cancer that had been treated with traditional cytotoxic chemotherapy.26,28 It is evident from these studies that even following treatment with high drug concentrations designed to kill cells by apoptosis, some cells respond by undergoing senescence. However, no thorough studies examining senescence of cancer cells following the clinical use of continuous exposure to low or moderate levels of DNA damaging agents have been carried out.
As mentioned, metronomic chemotherapy involves continuous or frequent treatment with low doses, typically 1/3–1/2 of the MTD, of anticancer drugs.14 The beneficial effects of this approach are considered to rely on targeting vascular endothelial cells in the tumor bed that support tumor growth.15 Indeed, two in vivo animal studies that preceded the clinical adoption of metronomic chemotherapy, one using cyclophosphamide to treat Lewis lung carcinoma29 and the other using vinblastine to treat neuroblastoma,30 demonstrated that more frequent administration of drug increased apoptosis in endothelial cells, followed by apoptosis in tumor cells. The possible induction of senescence in tumor cells, however, was not carefully monitored. Due to the fact that senescence is seen as part of the response to high-dose cytotoxic chemotherapy and in light of the results of this study, it is likely that senescence of tumor cells during metronomic chemotherapy also plays significant role.
Cell senescence is induced by a combination of both inhibition of cell cycle progression and the ongoing activity or activation of mTOR pathways.31-34 In the absence of mTOR activation, inhibition of cell cycle progression is, in and of itself, not sufficient to generate cellular senescence.33 On the other hand, enhancement of senescence can be achieved by overexpression of the oncogenic pathways that promote downstream activation of mTOR, increase S6 ribosomal protein signaling and enhance translation activity.35-37 Many tumor suppressors exert inhibitory activity on these translation-activation pathways and, when mutated, lose this capability, which also leads to mTOR/S6 activation. Nearly all cancers have either dysfunctional oncogenes or tumor suppressor genes, or both. Therefore, by having constitutively activated mTOR and S6 ribosomal protein signaling, cancer cells are expected to be more predisposed to undergo senescence under conditions of persistent replication stress than normal cells. Assessment of the dysfunctional oncogenes and/or tumor suppressor genes that activate mTOR and/or 6S ribosomal protein pathways may be performed prior to therapy providing information about the potential propensity of the particular cancer to undergo senescence. Screening tumors for the presence of activation of such oncogenes may select the patients as potentially sensitive for the metronomic type of chemotherapy, offering an approach for personalized cancer treatment. In addition to a large number of “Achilles’ heels” of cancer that potentially sensitize it to the particular treatment,38,39 the mutation of oncogenes that leads to enhanced mTOR signaling may provide still another of such “heels” that may be of clinical utility.
It should be noted that the A549 cells used in the present study have several oncogenic changes, such as in K-Ras which is mutated at Gly,12 the oncogenic microRNA let-7a-3 and TAZ (transcriptional coactivator with PDZ-binding motif).40-42 These mutations also appear to be common to human non-small cell lung carcinoma.43 It has also been observed that A549 cells are quite susceptible to undergoing senescence when treated with bone morphogenetic protein BMP4, which is one of the subgroups of the transforming growth factor-β (TGF-β) protein superfamily.44 Therefore, it is possible that this type of cancer, which is the most common of the lung cancer types, may be particularly sensitive to therapy that is designed to induce senescence in tumor cells.
Metronomic chemotherapy has been shown to have clinical benefits with relatively low toxicity to patients, though there is little consistency among the various treatment regimens and only superficial understanding of its underlying principle(s).The present findings indicate that DNA damaging agents if given at a low dose (1/100 of the MTD) continuously (or at least frequently) can induce irreversible senescence in the entire tumor cell population. These findings therefore, call for further testing of this approach on animal tumor models with particular attention paid to induction of senescence in the tumor cell population. Positive data from animal tests may promote application of this low-dose, long-term chemotherapy approach in clinical trials in anticipation of clinical benefits with considerably fewer attendant side effects.
Materials and Methods
Cells, cell treatment
Human pulmonary carcinoma A549 cells were obtained from American Type Culture Collection. The cells were grown in 25 ml FALCON flasks (Becton Dickinson Co.) in Ham’s F12K media supplemented with 2 mM L-glutamine,10% fetal bovine serum, 100 units/ml penicillin and 100 µg/ml streptomycin (all from Invitrogen/GIBCO) at 37°C in an atmosphere of 5% CO2 in air. The cultures were re-plated every 4 d to maintain cells in an asynchronous and exponential phase of growth. For experiments, the cells were trypsinized and seeded at low cell density (1x10⁴, 2x10⁴, or 4x10⁴ cells/ml) in 2-chambered glass slides (Nunc Lab-Tek II Fisher Scientific) 24 h prior to exposure to the drug. Cells were incubated with various concentrations (0.01–2.0 µg/ml) of MMC (Sigma-Aldrich) for varying periods of time (8–144 h), as described in the figure legends. Cells treated for extended periods of time were re-treated and re-fed every 72 h. When treatment was initiated, cells were in an asynchronous, exponential phase of growth.
Immunocytochemical detection of phosphorylated histone H2AX (γH2AX), activated caspase-3 and p21WAF1
The cells were fixed on the slides in a solution of 1% methanol-free formaldehyde (Polysciences, Inc.) dissolved in phosphate buffered saline (PBS) for 15 min on ice followed by suspension in 70% ethanol, where they were stored at -20°C for 4–24 h. The cells were washed twice in PBS and treated with 0.1% Triton X-100 (Sigma) in PBS for 15 min to permeabilize the cellular membranes and incubated in a 1% (w/v) solution of bovine serum albumin (BSA; Sigma) in PBS for 30 min to suppress nonspecific antibody binding. The cells were then incubated in a 100 µl volume of 1% BSA containing the primary antibody overnight at 4°C. The primary antibodies were diluted as follows: γH2AX: 1:300 dilution of phospho-specific (Ser139) H2AX (γH2AX) mouse monoclonal antibody (Biolegend); activated caspase-3: 1:100 dilution of anti-active caspase-3 rabbit polyclonal antibody (Promega); p21WAF1:1:100 dilution of p21 rabbit polyclonal antibody (Santa Cruz Biotechnology). Cells were washed once with PBS then incubated in a 100 µl volume of 1% BSA containing a 1:100 dilution of secondary antibody, either AlexaFluor 488 tagged anti-mouse antibody (Invitrogen/Molecular Probes) or AlexaFluor 633 tagged anti-rabbit antibody (Invitrogen/Molecular Probes). Cells were washed once more with PBS and counterstained with 2.8 µg/ml DAPI (4’,6-diamidino-2-phenylindole; Sigma) in PBS for 15 min. Cell fluorescence was measured using laser scanning cytometer (LSC).
Incorporation of 5-ethynyl-2’-deoxyuridine (EdU)
The Click-iT EdU AlexaFluor 488 imaging kit (Invitrogen/Molecular Probes) was used following the manufacturers directions. Cells were treated with 20 µM EdU for 1 h at 37°C, rinsed with PBS and fixed using 1% methanol-free formaldehyde (Polysciences) for 15 min. Cellular membranes were permeabilized using 0.1% Triton-X-100 (Sigma) in PBS for 15 min. Cells were then washed twice with PBS and treated with the Click-iT reaction cocktail for 30 min. Following this reaction, cells were washed once with PBS and counterstained with 2.8 µg/ml DAPI (Sigma) in PBS for 15 min. Fluorescence was measured using LSC.
Senescence-associated β-galactosidase staining
Staining for β-galactosidase was performed using a cellular senescence assay kit from Millipore. Cells were fixed using the Millipore kit fixing solution, containing gluteraldehyde and methanol, for 15 min at room temperature. Cells were then washed with PBS and incubated at 37°C for 24 h in the β-galactosidase detecting solution (Millipore). Following incubation, cells were washed twice with PBS and counterstained with 2.8 µg/ml DAPI (Sigma) in PBS for 15 min. β-galactosidase activity was determined using the LSC to measure absorbance at 633 nm. DAPI fluorescence was measured at the same time.
Clonogenicity assay
Cells were seeded at concentrations of 200 or 1,000 cells per chamber and allowed to grow for 1 week. At this time, colony formation was evaluated either by fixing the cells with 3.7% formaldehyde (Polysciences) in PBS for 5 min, washing with PBS and staining with 0.05% crystal violet (Thermo Fisher Scientific) for 30 min or by fixing the cells with 1% methanol-free formaldehyde (Polysciences) in PBS for 15 min followed by suspension in 70% ethanol at -20°C for 4–24 h, washing with PBS and staining with 2.8 μg/ml DAPI. Colonies stained with crystal violet were visually identified and counted under an Olympus SZX9 stereo microscope, while those stained with DAPI were counted using the LSC.
Measurement of cell fluorescence by LSC
Intensity of cellular green or far red immunofluorescence (IF) representing the binding of the respective antibodies and the blue emission of DAPI stained DNA was measured using an LSC (iCys® Research Imaging Cytometer; CompuCyte) and reported as arbitrary units (AU). Fluorescence was excited by 488 nm argon, helium-neon (633 nm), and violet (405 nm) lasers and the intensities of maximal pixel and integrated fluorescence were measured and recorded for each cell. Approximately 3,000 cells were measured per sample. Other details of cell analysis by LSC were presented before.45,46
Statistical analysis
The Student’s paired t-test was used to determine differences between two groups. For comparisons between multiple groups, ANOVA followed by the Bonferroni test was used. The p-values for significance were set to 0.05 for all tests. Error bars contained in the results represent standard deviation; statistically significant differences are indicated.
Supplementary Material
Acknowledgments
Supported by NCI RO1 28 704 and by the Robert Andrew Welke Foundation for Cancer Research.
Disclosure of Potential Conflicts of Interest
No potential conflicts of interest were disclosed.
Supplemental Material
Supplemental material may be found here: www.landesbioscience.com/journals/cc/article/21506
Footnotes
Previously published online: www.landesbioscience.com/journals/cc/article/21506
References
- 1.Hayflick L, Moorhead PS. The serial cultivation of human diploid cell strains. Exp Cell Res. 1961;25:585–621. doi: 10.1016/0014-4827(61)90192-6. [DOI] [PubMed] [Google Scholar]
- 2.Harley CB, Futcher AB, Greider CW. Telomeres shorten during ageing of human fibroblasts. Nature. 1990;345:458–60. doi: 10.1038/345458a0. [DOI] [PubMed] [Google Scholar]
- 3.Mathon NF, Lloyd AC. Cell senescence and cancer. Nat Rev Cancer. 2001;1:203–13. doi: 10.1038/35106045. [DOI] [PubMed] [Google Scholar]
- 4.Collado M, Serrano M. The power and the promise of oncogene-induced senescence markers. Nat Rev Cancer. 2006;6:472–6. doi: 10.1038/nrc1884. [DOI] [PubMed] [Google Scholar]
- 5.Rodier F, Campisi J. Four faces of cellular senescence. J Cell Biol. 2011;192:547–56. doi: 10.1083/jcb.201009094. [DOI] [PMC free article] [PubMed] [Google Scholar]
- 6.Pazolli E, Stewart SA. Senescence: the good the bad and the dysfunctional. Curr Opin Genet Dev. 2008;18:42–7. doi: 10.1016/j.gde.2007.12.002. [DOI] [PubMed] [Google Scholar]
- 7.Kerr JFR, Winterford CM, Harmon BV. Apoptosis. Its significance in cancer and cancer therapy. Cancer. 1994;73:2013–26. doi: 10.1002/1097-0142(19940415)73:8<2013::AID-CNCR2820730802>3.0.CO;2-J. [DOI] [PubMed] [Google Scholar]
- 8.Collado M, Serrano M. Senescence in tumours: evidence from mice and humans. Nat Rev Cancer. 2010;10:51–7. doi: 10.1038/nrc2772. [DOI] [PMC free article] [PubMed] [Google Scholar]
- 9.Hanahan D, Weinberg RA. The hallmarks of cancer. Cell. 2000;100:57–70. doi: 10.1016/S0092-8674(00)81683-9. [DOI] [PubMed] [Google Scholar]
- 10.Serrano M, Lin AW, McCurrach ME, Beach D, Lowe SW. Oncogenic ras provokes premature cell senescence associated with accumulation of p53 and p16INK4a. Cell. 1997;88:593–602. doi: 10.1016/S0092-8674(00)81902-9. [DOI] [PubMed] [Google Scholar]
- 11.Zhu J, Woods D, McMahon M, Bishop JM. Senescence of human fibroblasts induced by oncogenic Raf. Genes Dev. 1998;12:2997–3007. doi: 10.1101/gad.12.19.2997. [DOI] [PMC free article] [PubMed] [Google Scholar]
- 12.Dimri GP, Itahana K, Acosta M, Campisi J. Regulation of a senescence checkpoint response by the E2F1 transcription factor and p14(ARF) tumor suppressor. Mol Cell Biol. 2000;20:273–85. doi: 10.1128/MCB.20.1.273-285.2000. [DOI] [PMC free article] [PubMed] [Google Scholar]
- 13.Campaner S, Doni M, Verrecchia A, Fagà G, Bianchi L, Amati B. Myc, Cdk2 and cellular senescence: Old players, new game. Cell Cycle. 2010;9:3655–61. doi: 10.4161/cc.9.18.13049. [DOI] [PubMed] [Google Scholar]
- 14.Pasquier E, Kavallaris M, André N, Shaked Y, Baruchel S, Oberlin O, et al. Metronomic chemotherapy: new rationale for new directions. Nat Rev Clin Oncol. 2010;7:455–65. doi: 10.1038/nrclinonc.2010.82. [DOI] [PubMed] [Google Scholar]
- 15.Pasquier E, Kieran MW, Sterba J, et al. Moving forward with metronomic chemotherapy: meeting report of the 2nd international workshop on metronomic and anti-angiogenic chemotherapy in paediatric oncology. Translational Oncology. 2011;4:189–97. doi: 10.1593/tlo.11124. [DOI] [PMC free article] [PubMed] [Google Scholar]
- 16.Ravina E. The Evolution of Drug Discovery: From Traditional Medicines to Modern Drugs. 1st ed. Weinheim, Germany:Wiley VCH; 2011. [Google Scholar]
- 17.Bradner WT. Mitomycin C: a clinical update. Cancer Treat Rev. 2001;27:35–50. doi: 10.1053/ctrv.2000.0202. [DOI] [PubMed] [Google Scholar]
- 18.Pratt WB, Ruddon RW, Ensminger WD, Maybaum J. The Anticancer Drugs. 2nd ed. New York: Oxford University Press; 1994:124-128. [Google Scholar]
- 19.Pospelova TV, Demidenko ZN, Bukreeva EI, Pospelov VA, Gudkov AV, Blagosklonny MV. Pseudo-DNA damage response in senescent cells. Cell Cycle. 2009;8:4112–8. doi: 10.4161/cc.8.24.10215. [DOI] [PMC free article] [PubMed] [Google Scholar]
- 20.Halicka HD, Zhao H, Li J, Traganos F, Zhang S, Lee M, et al. Genome protective effect of metformin as revealed by reduced level of constitutive DNA damage signaling. Aging (Albany NY) 2011;3:1028–38. doi: 10.18632/aging.100397. [DOI] [PMC free article] [PubMed] [Google Scholar]
- 21.Burhans WC, Weinberger M. DNA replication stress, genome instability and aging. Nucleic Acids Res. 2007;35:7545–56. doi: 10.1093/nar/gkm1059. [DOI] [PMC free article] [PubMed] [Google Scholar]
- 22.Itahana K, Campisi J, Dimri GP. Methods to detect biomarkers of cellular senescence: the senescence-associated beta-galactosidase assay. Methods Mol Biol. 2007;371:21–31. doi: 10.1007/978-1-59745-361-5_3. [DOI] [PubMed] [Google Scholar]
- 23.Cho S, Hwang ES. Fluorescence-based detection and quantification of features of cellular senescence. Methods Cell Biol. 2011;103:149–88. doi: 10.1016/B978-0-12-385493-3.00007-3. [DOI] [PubMed] [Google Scholar]
- 24.Demidenko ZN, Korotchkina LG, Gudkov AV, Blagosklonny MV. Paradoxical suppression of cellular senescence by p53. Proc Natl Acad Sci USA. 2010;107:9660–4. doi: 10.1073/pnas.1002298107. [DOI] [PMC free article] [PubMed] [Google Scholar]
- 25.Zhao H, Halicka HD, Traganos F, Jorgensen E, Darzynkiewicz Z. New biomarkers probing depth of cell senescence assessed by laser scanning cytometry. Cytometry A. 2010;77:999–1007. doi: 10.1002/cyto.a.20983. [DOI] [PMC free article] [PubMed] [Google Scholar]
- 26.te Poele RH, Okorokov AL, Jardine L, Cummings J, Joel SP. DNA damage is able to induce senescence in tumor cells in vitro and in vivo. Cancer Res. 2002;62:1876–83. [PubMed] [Google Scholar]
- 27.Schmitt CA, Fridman JS, Yang M, Lee S, Baranov E, Hoffman RM, et al. A senescence program controlled by p53 and p16INK4a contributes to the outcome of cancer therapy. Cell. 2002;109:335–46. doi: 10.1016/S0092-8674(02)00734-1. [DOI] [PubMed] [Google Scholar]
- 28.Roberson RS, Kussick SJ, Vallieres E, Chen SYJ, Wu DY. Escape from therapy-induced accelerated cellular senescence in p53-null lung cancer cells and in human lung cancers. Cancer Res. 2005;65:2795–803. doi: 10.1158/0008-5472.CAN-04-1270. [DOI] [PubMed] [Google Scholar]
- 29.Browder T, Butterfield CE, Kräling BM, Shi B, Marshall B, O’Reilly MS, et al. Antiangiogenic scheduling of chemotherapy improves efficacy against experimental drug-resistant cancer. Cancer Res. 2000;60:1878–86. [PubMed] [Google Scholar]
- 30.Klement G, Baruchel S, Rak J, Man S, Clark K, Hicklin DJ, et al. Continuous low-dose therapy with vinblastine and VEGF receptor-2 antibody induces sustained tumor regression without overt toxicity. J Clin Invest. 2000;105:R15–24. doi: 10.1172/JCI8829. [DOI] [PMC free article] [PubMed] [Google Scholar]
- 31.Demidenko ZN, Blagosklonny MV. Growth stimulation leads to cellular senescence when the cell cycle is blocked. Cell Cycle. 2008;7:3355–61. doi: 10.4161/cc.7.21.6919. [DOI] [PubMed] [Google Scholar]
- 32.Demidenko ZN, Zubova SG, Bukreeva EI, Pospelov VA, Pospelova TV, Blagosklonny MV. Rapamycin decelerates cellular senescence. Cell Cycle. 2009;8:1888–95. doi: 10.4161/cc.8.12.8606. [DOI] [PubMed] [Google Scholar]
- 33.Blagosklonny MV. Cell cycle arrest is not yet senescence, which is not just cell cycle arrest: terminology for TOR-driven aging. Aging (Albany NY) 2012;4:159–65. doi: 10.18632/aging.100443. [DOI] [PMC free article] [PubMed] [Google Scholar]
- 34.Korotchkina LG, Leontieva OV, Bukreeva EI, Demidenko ZN, Gudkov AV, Blagosklonny MV. The choice between p53-induced senescence and quiescence is determined in part by the mTOR pathway. Aging (Albany NY) 2010;2:344–52. doi: 10.18632/aging.100160. [DOI] [PMC free article] [PubMed] [Google Scholar]
- 35.Selman C, Tullet JM, Wieser D, Irvine E, Lingard SJ, Choudhury AI, et al. Ribosomal protein S6 kinase 1 signaling regulates mammalian life span. Science. 2009;326:140–4. doi: 10.1126/science.1177221. [DOI] [PMC free article] [PubMed] [Google Scholar]
- 36.Magnuson B, Ekim B, Fingar DC. Regulation and function of ribosomal protein S6 kinase (S6K) within mTOR signalling networks. Biochem J. 2012;441:1–21. doi: 10.1042/BJ20110892. [DOI] [PubMed] [Google Scholar]
- 37.Yin Z, Fan L, Huang G, Wang H, Wang Z. The possible role of ribosomal protein S6 kinase 4 in the senescence of endothelial progenitor cells in diabetes mellitus. Cardiovasc Diabetol. 2012;11:12. doi: 10.1186/1475-2840-11-12. [DOI] [PMC free article] [PubMed] [Google Scholar]
- 38.Darzynkiewicz Z, Traganos F, Wlodkowic D. Impaired DNA damage response--an Achilles’ heel sensitizing cancer to chemotherapy and radiotherapy. Eur J Pharmacol. 2009;625:143–50. doi: 10.1016/j.ejphar.2009.05.032. [DOI] [PMC free article] [PubMed] [Google Scholar]
- 39.Demidenko ZN, McCubrey JA. Recent progress in targeting cancer. Aging (Albany NY) 2011;3:1154–62. doi: 10.18632/aging.100421. [DOI] [PMC free article] [PubMed] [Google Scholar]
- 40.Omerovic J, Clague MJ, Prior IA. Phosphatome profiling reveals PTPN2, PTPRJ and PTEN as potent negative regulators of PKB/Akt activation in Ras-mutated cancer cells. Biochem J. 2010;426:65–72. doi: 10.1042/BJ20091413. [DOI] [PMC free article] [PubMed] [Google Scholar]
- 41.Brueckner B, Stresemann C, Kuner R, Mund C, Musch T, Meister M, et al. The human let-7a-3 locus contains an epigenetically regulated microRNA gene with oncogenic function. Cancer Res. 2007;67:1419–23. doi: 10.1158/0008-5472.CAN-06-4074. [DOI] [PubMed] [Google Scholar]
- 42.Zhou Z, Hao Y, Liu N, Raptis L, Tsao MS, Yang X. TAZ is a novel oncogene in non-small cell lung cancer. Oncogene. 2011;30:2181–6. doi: 10.1038/onc.2010.606. [DOI] [PubMed] [Google Scholar]
- 43.Wang XQ, Li H, Van Putten V, Winn RA, Heasley LE, Nemenoff RA. Oncogenic K-Ras regulates proliferation and cell junctions in lung epithelial cells through induction of cyclooxygenase-2 and activation of metalloproteinase-9. Mol Biol Cell. 2009;20:791–800. doi: 10.1091/mbc.E08-07-0732. [DOI] [PMC free article] [PubMed] [Google Scholar]
- 44.Buckley S, Shi W, Driscoll B, Ferrario A, Anderson K, Warburton D. BMP4 signaling induces senescence and modulates the oncogenic phenotype of A549 lung adenocarcinoma cells. Am J Physiol Lung Cell Mol Physiol. 2004;286:L81–6. doi: 10.1152/ajplung.00160.2003. [DOI] [PubMed] [Google Scholar]
- 45.Darzynkiewicz Z, Bedner E, Li X, Gorczyca W, Melamed MR. Laser-scanning cytometry: A new instrumentation with many applications. Exp Cell Res. 1999;249:1–12. doi: 10.1006/excr.1999.4477. [DOI] [PubMed] [Google Scholar]
- 46.Zhao H, Dobrucki J, Rybak P, Traganos F, Darzynkiewicz Z. Relationship of DNA damage signaling induced by DNA topoisomerase inhibitors camptothecin/topotecan, mitoxantrone or etoposide and DNA replication. Cytometry A. 2012;1012(81A):45–51. doi: 10.1002/cyto.a.21172. [DOI] [PMC free article] [PubMed] [Google Scholar]
Associated Data
This section collects any data citations, data availability statements, or supplementary materials included in this article.