Abstract
2-D transrectal ultrasound (TRUS) is being used in guiding prostate biopsies and treatments. In many cases, the TRUS probes are moved manually or mechanically to acquire volumetric information, making the imaging slow, user-dependent and unreliable. A real-time 3-D TRUS system could improve reliability and volume rates of imaging during these procedures. In this paper, we present a 5 MHz cylindrical dual-layer transducer array capable of real-time 3-D transrectal ultrasound without any mechanically moving parts. Compared to fully-sampled 2-D arrays, this design substantially reduces the channel count and fabrication complexity. This dual-layer transducer uses PZT elements for transmit and P[VDF-TrFE] copolymer elements for receive, respectively. The mechanical flexibility of both diced PZT and copolymer makes it practical for transrectal applications. Full synthetic aperture 3-D data sets were acquired by interfacing the transducer with a Verasonics Data Acquisition System (VDAS). Offline 3-D beamforming was then performed to obtain volumes of two wire phantoms and a cyst phantom. Generalized coherence factor (GCF) was applied to improve the contrast of images. The measured −6 dB fractional bandwidth of the transducer was 62% with a center frequency of 5.66 MHz. The measured lateral beamwidths were 1.28 mm and 0.91 mm in transverse and longitudinal directions respectively, compared with a simulated beamwidth of 0.92 mm and 0.74 mm.
I. Introduction
Prostate cancer is the second most common cancer and the second leading cause of cancer death in American males. Among the 848,170 estimated new cancer cases expected in 2012, 29% or 241,740 cases are prostate cancers [1]. The primary tools to detect and diagnose prostate cancer include digital rectal examination (DRE), serum concentration of prostate specific antigen (PSA), and transrectal ultrasound (TRUS) guided biopsies, which are required for histopathological confirmation on the basis of the PSA level and/or a suspicious DRE [2]. TRUS is also widely used for monitoring therapy procedures like brachytherapy and cryotherapy [3, 4], and transrectal HIFU treatment devices have already been available on the market [5]. In addition, by combining other TRUS capabilities, such as color and power Doppler, contrast-enhancement, harmonic and flash replenishment imaging, and elastography, prostate cancer detection could be further improved [6, 7]. Although conventional TRUS has been shown to have significant advantages, some major limitations exist. The inherent 2-D character of conventional TRUS makes the imaging procedure of 3-D human anatomy highly operator-dependent. Also, certain orientations, such as a C-scan, are unavailable with conventional 2-D TRUS. Furthermore, quantitative estimation of the prostate or tumor volumes can provide critical information [8]. However, the measurements based on a few selected conventional 2-D images are likely to be inaccurate, especially for tumors, whose geometry is highly variable [9]. For these reasons, 3-D TRUS has been proposed for different clinical applications, including guiding prostate biopsies [10], detecting brachytherapy seeds [11], and prostate volume evaluation [12]. 3-D TRUS is also combined with other imaging modalities like MRI or PET/CT to better guide the diagnostic and therapeutic procedures of prostate cancer and image the prostate [13, 14]. Ukimura et al recently proposed real-time 3-D TRUS guidance of prostate biopsy with MR/TRUS image fusion that can accomplish volumetric ultrasound data acquisition in 3 seconds [15]. Most of the 3-D TRUS systems manually or mechanically translate 1-D arrays to acquire multiple B-scans, and implement 3-D reconstruction by offline processing. The mechanical components of such systems can be slow, user-dependent and unreliable. Solutions to these issues can be provided by 2-D transducer arrays which do not require the moving parts for 3-D scanning.
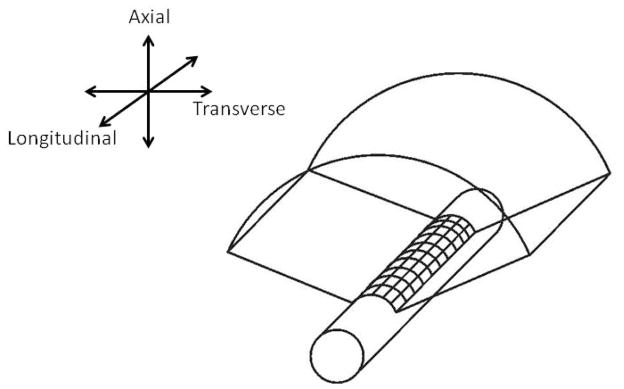
A fully sampled cylindrical 2-D array for 3-D transrectal imaging analogous to the 1-D curvilinear array, typically having 128 elements and using a sub-aperture of 64 elements per image line, would require up to 128 × 128 = 16,384 elements and a sub-aperture of 64 × 64 = 4,096 elements. Figure 1 shows a fully-sampled, side-firing, cylindrical 2-D ultrasound array which scans a volume consisting of many curvilinear scans stacked together along the long-axis of the probe. The difficulties of having large numbers of active elements and connecting a wire to each element pose fabrication problems. Also, the interconnection with so many elements will lead to unacceptable connection cable size and electronic power. Philips developed the x6-1 transducer, a fully-sampled 2-D phased array of 1–6 MHz frequency range with 9,212 elements, for abdominal, obstetric, and cardiac applications. Complicated custom integrated circuits are required to funnel data from 9,212 elements to 128 or 256 system channels. Active cooling mechanism is desired concerning the large amount of heat generated by the dense electronics. It has not been shown whether the techniques associated with the x6-1 transducers can be applied to produce a 2-D fully-sampled transrectal transducer.
Figure 1.
2-D cylindrical array for 3-D TRUS.
The dual-layer array design provides an alternative solution to the problem by reducing the fabrication complexity and channel count of the transducer. We previously developed planar dual-layer transducers for 3-D rectilinear imaging with center frequencies of 5 MHz and 7.5 MHz [16, 17]. The basic structure of these transducers contained one PZT layer for transmit and one separate P[VDF-TrFE] copolymer layer, closer to the target, for receive. Each layer was a 1-D square-shaped array composed of parallel elongated elements. The layers were oriented with transmit and receive elements perpendicular to each other. By moving the locations of selected transmit and receive subapertures in two perpendicular directions respectively, a volume was scanned. Each pair of the elongated transmit and receive elements will present similar beam patterns during scanning procedures to the Mills cross array [18], which is composed of an N-elementtransmit array orthogonal to an N-element receive array. Therefore, this dual-layer design could be viewed as an array with multiple Mills cross arrays. The dual-layer configuration also enabled us to optimize materials separately for different layers and also isolate transmit and receive electronics.
In this paper, we describe the design, fabrication, tests, and imaging experiments of a 5 MHz cylindrical dual-layer 2-D transducer array for 3-D transrectal imaging, with 128 PZT elements and 128 P[VDF-TrFE] copolymer elements. Because of the flexibility of the diced PZT and the P[VDF-TrFE] copolymer, the transducer array can be constructed by easily molding them around a cylindrical backing. Based on a similar acoustic stack with the planar dual-layer arrays we built before, the cylindrical version is designed for real-time 3-D transrectal ultrasound applications. Pua et al proposed a cylindrical curvilinear 2-D transducer for transesophageal imaging [19]. This transducer possesses 440 active elements/channels in a periodic sparse array design. And it provides a field of view of greater than 120° in the curved, transverse direction and 65° phased array sector scans in the longitudinal direction. The transducer developed in this paper scans similar curvilinear volumes compared to the above transducer with a transverse field of view close to 180°. In the longitudinal direction, rectilinear scanning was implemented, providing a larger field of view close to transducer surface than Pua’s transducer. A prototype, with a transverse diameter of 25 mm and a longitudinal height of 40 mm, was developed to demonstrate the feasibility of the transducer. Full synthetic aperture data sets, containing all transmit and receive element combinations, were acquired and beamformed offline, and generalized coherence factor (GCF) was applied to improve the image quality. Our ultimate goal is to have a real-time transrectal system for prostate imaging with image quality comparable to a system with a fully-sampled 2-D array, using a more practical transducer design, in terms of element connections and transmit/receive channels, combined with suitable signal processing algorithms.
II. Methods
3-D scanning process of the dual-layer design
For illustrative purposes, figure 2 is a simplified schematic of the 3-D scanning process using the dual-layer design with a flat geometry and only 8 elements in each layer. To form a scan-line, sub-apertures of transmit and receive layers are used. In transmit, the shaded sub-aperture elements are excited, and beamforming could be performed in the transverse direction. Similarly, in receive, the sub-aperture shaded in gray is used and beamforming is accomplished in the longitudinal direction. Therefore, the scan-line is formed at the intersection of transmit and receive beams. By moving the locations of transmit sub-aperture and receive sub-aperture in the two perpendicular directions respectively, a 3-D volume can be scanned.
Figure 2.
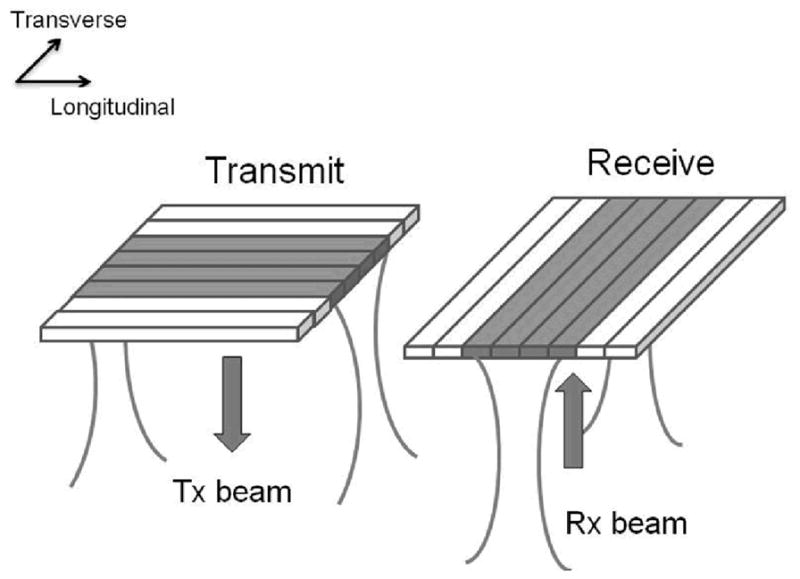
3-D scanning process of dual-layer transducer arrays
Simulated beamplots
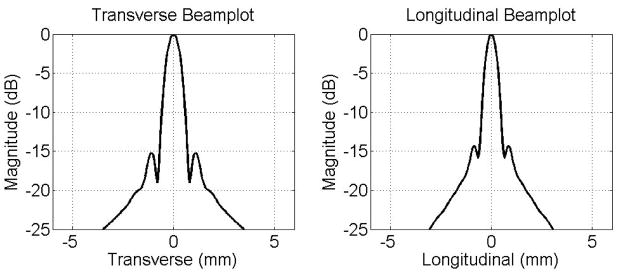
To simulate imaging performance of the cylindrical dual-layer transducer array, simulated beamplots were acquired using Field II [20]. The transmit aperture was a 1-D array with a transverse element pitch of 300 μm and a longitudinal height of 38.4 mm. The receive aperture had a longitudinal element pitch of 300 μm and a transverse length of 38.4 mm. A Gaussian pulse with a center frequency of 4.5 MHz and 50% fractional bandwidth was used. For the beamplot, a 64-element subaperture was used in both transmit and receive and focused on-axis to (x,y,z) = (0,0,30) mm. Figure 3 shows the simulated beamplots of the dual-layer transducer in transverse direction and longitudinal direction. The −6 dB beamwidth is 0.92 mm in transverse and 0.74 mm in longitudinal, respectively. Sidelobe levels, around −15 to −20 dB, are seen along the transverse and longitudinal axes.
Figure 3.
Simulated beamplots of the cylindrical dual-layer transducer.
Design and fabrication
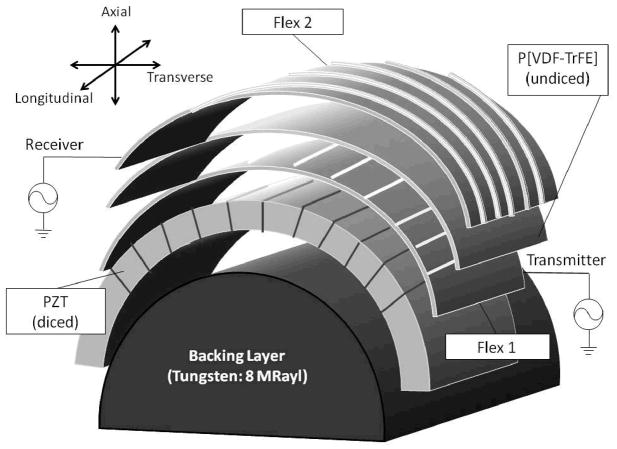
Figure 4 shows a schematic of the acoustic stack of the dual-layer transducer array. A cylindrical backing with acoustic impedance of 8 MRayls was used to minimize reverberation between different layers. This backing was produced using 82% tungsten powder with particle diameter of 1 μm (Atlantic Equipment Engineers, Bergenfield, NJ) and 18% Epo-Tek 301 epoxy (Epoxy Technology, Billerica, MA), by weight. The mixture was then centrifuged at 2400 revolutions per minute (rpm) in a Beckman-Coulter Allegra 6 centrifuge (Fullerton, CA) for 10 minutes. After lapping off the excess epoxy, the curved surface of the backing was sputtered with 500 angstroms of chrome and 1000 angstroms of gold to provide a ground electrode for all PZT elements.
Figure 4.
Acoustic stack of the cylindrical dual-layer transducer array.
The diameter of the cylindrical backing was 25 mm, which, by combining a 40 × 40 mm2 active area size, provided a transverse scan angle of around 180°. The dimensions were chosen based on typical settings in clinical applications. We also chose a pitch of 300 μm for the array to keep the elements spaced approximately one wavelength to avoid grating lobes. As a result, each layer had 128 elements. A 40 × 40 mm2 wafer of gold-plated 300 μm thick PZT-5H was bonded to a prototype flexible circuit (Microconnex, Snoqualmie, WA, Flex 1 in Figure 4) using Epo-Tek 301 epoxy. The flexible circuit was made of 25 μm thick polyimide with 5 μm thick copper traces spaced at 150 μm printed on one side. A DAD321 automatic dicing saw (DISCO Corporation, Tokyo, Japan) with a 30 μm width diamond blade (DISCO Corporation, Tokyo, Japan) was used to dice the PZT wafer into 256 elongated pillars. The dicing saw was carefully calibrated to position each cut at the middle between two adjacent copper traces, and all cuts were made through the PZT piece and Flex1. Each pillar serves as a sub-element, and two adjacent sub-elements were combined electrically in parallel to perform as one transmit element. The sub-element strategy was used to reduce the aspect ratio of ceramic pillars to around 0.4. Without the sub-element dicing, the determined transducer specifications would make the aspect ratio close to 1, which would translate to high lateral coupling. Then the diced PZT, together with Flex 1, was bonded to the sputtered curved surface of the backing with PZT elements ran parallel to long-axis.
A 40 × 40 mm2 sheet of P[VDF-TrFE] copolymer, which had been poled and metalized with Cr/Au on the negative side by manufacturer (Precision Acoustics, Dorset, UK), was bonded to another flexible circuit (Flex 2 in Figure 4), identical to Flex 1, on the positive, unmetalized side. Both the Cr/Au layer and the copper traces on Flex 2 will serve as electrodes for the copolymer elements. A single P[VDF-TrFE] copolymer element was 75 μm wide and 40 mm long, defined by the width of copper traces on the flexible circuit. This copolymer/flex module was then bonded to the top of Flex 1 so that the PZT and copolymer elements were perpendicular to each other. The polyimide layer of Flex 1 would electrically isolate the elements of the two layers. The copolymer combined with the two flexible circuits to serve as a simple matching layer for the PZT transmit layer, which possesses an acoustic impedance of around 4 MRayls and a total thickness of 75 μm. The applied pressure was approximately 100 psi when bonding materials to the flexible circuits, which assured a thin enough bonding thickness to achieve electrical contact. The array was finally sealed with non-conductive epoxy and RTV silicone to protect from moisture and possible physical damage. The materials used for sealing would not appear in the ultrasound propagation paths, therefore they would have no effect on ultrasound beams.
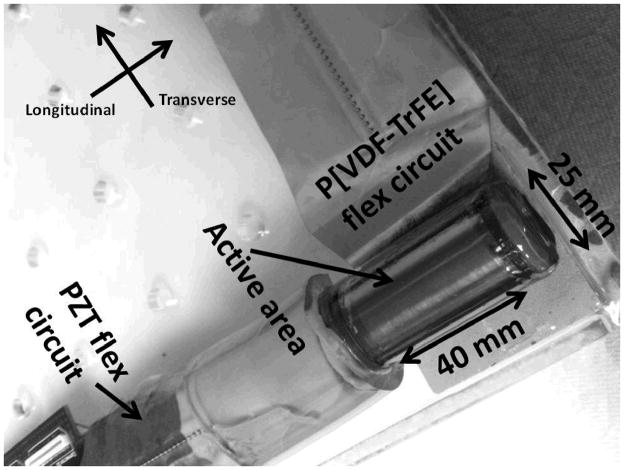
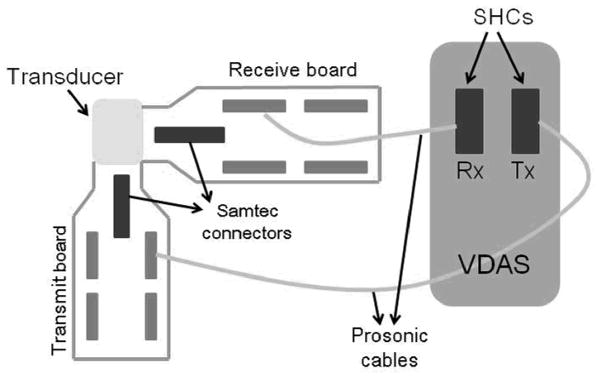
Samtec connectors (Samtec USA, New Albany, IN) were soldered onto both flexes to serve as the interface between the transducer and printed circuit boards. A photo of the finished prototype transducer is shown in Figure 5.
Figure 5.
Photo of the prototype cylindrical dual-layer transducer.
Data acquisition
After performing electrical impedance and pulse-echo measurements, the cylindrical dual-layer transducer array was interfaced with a 4-board Verasonics Data Acquisition System, VDAS (Verasonics, Redmond, WA). VDAS is an ultrasound research platform that allows acquiring, storing, displaying and analyzing ultrasonic data. Users are able to control imaging parameters such as aperture size, transmit frequency, filtering, and time-gain compensation on the system. The VDAS can provide 256 transmit channels and 128 receive channels simultaneously, which reduces the time of data collection and the complexity of operation.
During data acquisition, the transducer was interfaced with VDAS by two sets of 128-channel coaxial cable bundles (Prosonic, Gyeongbuk, Korea), which were plugged into the two scanhead connectors (SHCs) on the front panel of VDAS at the other end. Each of the PZT elements were connected to the 128 individual channels of one SHC configured to operate in transmit mode, while the PVDF copolymer elements were connected to the remaining 128 system channels of the other SHC in receive mode. With synthetic aperture data acquisition, one transmit element was excited at a time and data from each receive channel was collected. This procedure would be repeated for all PZT elements to cover the whole volumetric field of view. Receive data was acquired with a 36 MHz sampling frequency, and averaged 300 times to minimize the effects of random noise. Averaging was required for synthetic aperture acquisition because energy levels transmitted by a single element were low. Figure 6 shows a schematic of the configuration of the system for data acquisition.
Figure 6.
Schematic of system configuration for data acquisition with VDAS.
We performed the data acquisition process with the transducer immersed in an oil bath. 3-D volumetric data was acquired of different targets. A single nitinol wire target, with a diameter of 100 μm that is smaller than the ultrasound wavelength involved, was scanned to evaluate the spatial resolution. Multiple nylon wires were placed inside a sponge to mimic the seeds implanted during a brachytherapy procedure. Another target scanned was a cyst target formed by cutting a cylindrical core, whose diameter was 8 mm, into the sponge. The random nature of the sponge provides a reasonable scatter source on considering the low energy levels of synthetic aperture scanning.
Beamforming, signal processing, and display
The acquired synthetic aperture data was imported into Matlab (Mathworks, Natick, MA) for offline 3-D delay-and-sum (DAS) beamforming, signal processing, and image display. RF data was filtered with a 64-tap FIR bandpass filter with frequency range of 3.5–6.5 MHz. Beamforming with dynamic transmit and receive focusing of 1 mm axial increments was then done with a constant sub-aperture size of 64 elements. A 3-D cylindrical volume was acquired by selecting the appropriate transmit sub-apertures in transverse and receive sub-apertures in longitudinal to focus a beam directly ahead. Scan conversion was performed in the transverse direction to provide a curvilinear scan format. Generalized coherence factors (GCF) were calculated and used as weighting factors for the reconstructed images of the cyst phantom to improve contrast of the images [21]. After 3-D beamforming and signal processing, envelope detection was done using the Hilbert transform followed by log-compression. Transverse and longitudinal B-scans are displayed along with C-scans which are parallel to the transducer face. The above processing was performed on iMac OS X 10.6.7, and took less than 1 hour for computation.
III. Experimental results
Impedance measurements
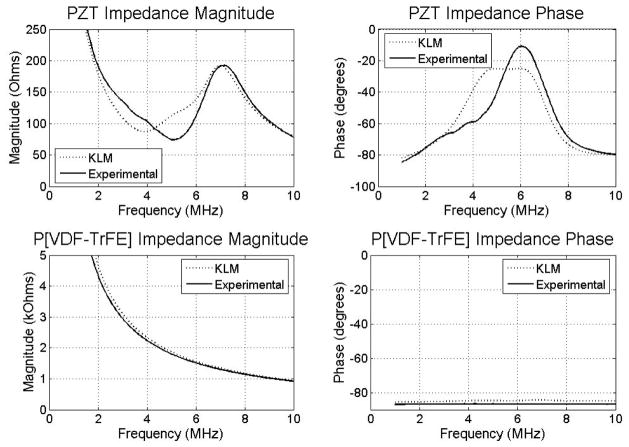
Experimental electrical impedance measurements of the transducer were taken using an Agilent 4294A impedance analyzer (Santa Clara, CA). Figure 7 shows the electrical impedance results of both layers by simulation using 1-D KLM modeling software (PiezoCAD, Sonic Concepts, Woodinville, WA)[22], and by experiments. For PZT, the simulated impedance magnitude was 87 Ω at a series resonance frequency of 4.0 MHz while the experimental impedance curve showed a series resonance of 74 Ω at 5.1 MHz. The phase plots peak at 5.4 MHz for the KLM simulation and at 6.0 MHz in the experimental case. For P[VDF-TrFE] copolymer, the impedance magnitude was 2.3 kΩ at 4.0 MHz in simulation, and the measured impedance magnitude was 1.8 kΩ at 5.1 MHz. No resonance peaks are seen in the impedance magnitudes, and the phase remains near 84° to 87°.
Figure 7.
Simulated and experimental impedance measurements of PZT and P[VDF-TrFE] layers.
Pulse-echo measurements
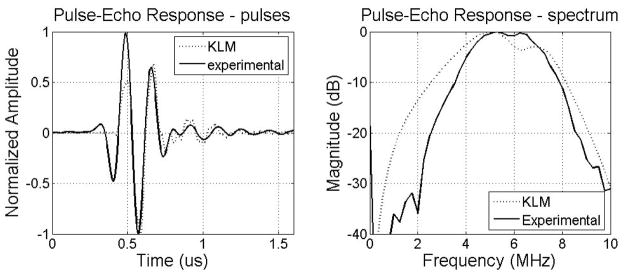
Pulse-echo measurements of the transducer were made in a water tank using a Panametrics 5900PR pulser/receiver (Waltham, MA) with an aluminum plate reflector. To mimic imaging conditions, the excitation pulse was applied to a PZT element and a copolymer element was used as the receiver. Figure 8 shows the simulated and experimental time and frequency responses of the pulse-echo signals. In simulation, the center frequency was 5.48 MHz with a −6 dB fractional bandwidth of 80.33%, compared to a 5.66 MHz center frequency with a −6 dB fractional bandwidth of 62.06% in experiment. Low amplitude reverberations after the pulse peak in the time domain and an in-band notch in the frequency domain are seen in both the simulation and experimental results. The presence of the in-band notch was due to the high acoustic impedance of PZT at the back side of PVDF copolymer receive layer. The thickness of the PZT layer will affect the position of the notch. Compared to simulation, the experimental pulse-echo test shows good agreement in terms of center frequency, with a moderately narrower bandwidth.
Figure 8.
Simulated and experimental pulses and spectrum of the cylindrical dual-layer transducer.
3-D imaging – single nitinol wire
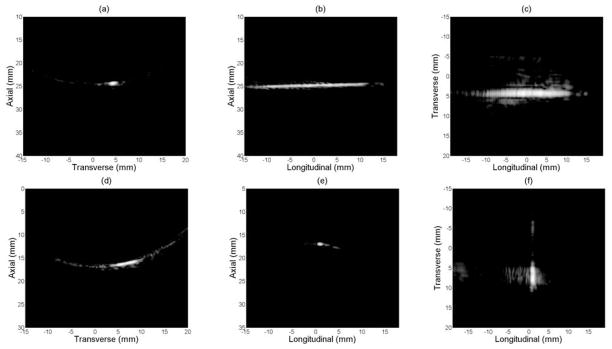
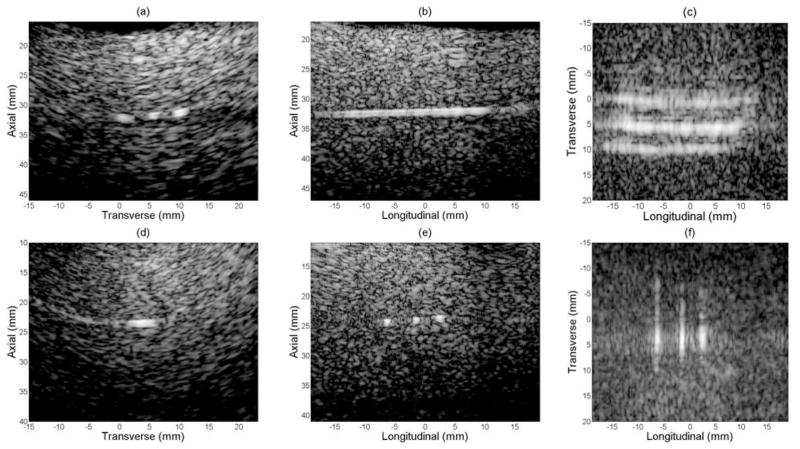
Figure 9(a)–(c) show the transverse B-scan, longitudinal B-scan and C-scan respectively when the long axis of the wire target was in longitudinal direction. The transverse B-scan (Figure 9(a)) was scan converted for sector display. The C-scan plane was selected after scan conversion in transverse direction, and parallel to the long axis of the transducer. Figure 9(d)–(f) show images of the same nitinol wire target with long axis of the wire in transverse direction. Figure 9(d) and (f) only show a portion of the wire, because of the specular reflection of the nitinol wire. The curved artifacts in figure 9(d) came from the sidelobes being scan converted. Figure 9(f) shows a C-scan whose slice has been thickened in the axial dimension to encompass as much of the wire target as possible, when the wires are not perfectly parallel to the transducer face because of mechanical positioning. All images are log-compressed and shown on a 25 dB dynamic range.
Figure 9.
Experimental images of single nitinol wire with a dynamic range of 25 dB.
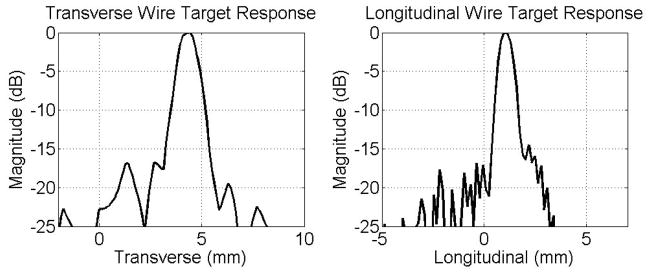
Figure 10 shows the lateral wire target responses in transverse (left) and in longitudinal (right) directions. The −6 dB beamwidth was 1.28 mm in transverse and 0.91 mm in longitudinal compared to a simulated beamwidth of 0.92 mm and 0.74 mm respectively. Sidelobes above −20 dB and some clutter around −25 dB were present in both figures.
Figure 10.
Transverse and longitudinal lateral wire target responses.
3-D imaging - multiple nylon wires embedded in a speckle source
Figure 11 contains volumetric images of 3 parallel nylon wires embedded in a sponge used to provide scattering. This experiment mimicked a brachytherapy procedure with multiple seeds implanted in the prostate. In the above figure, (a)–(c) show the transverse B-scan, longitudinal B-scan and C-scan with the long axes of the nylon wires in longitudinal, and (d)–(f) show the two perpendicular B-scans and the C-scan with long axes of the wires in transverse. Again, only a portion of the wires were seen in (d) and (f) because of the specular reflection of the nitinol wire. However, the sponge provides diffuse reflection could be seen all across the field-of-view. Figure 11(f) was also averaged in depth dimension to encompass the target as much as possible. All images are log-compressed and shown with 35 dB dynamic range.
Figure 11.
Experimental images of multiple nylon wires with a dynamic range of 35 dB.
3-D imaging – cyst phantom
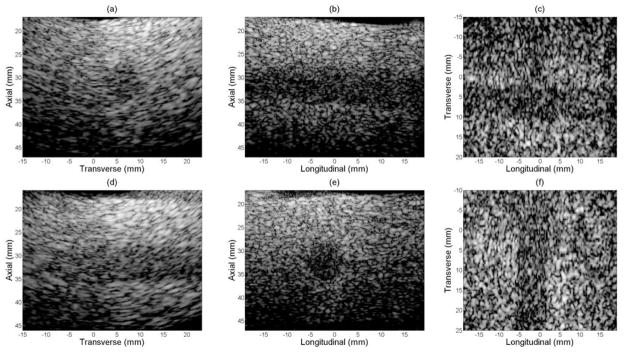
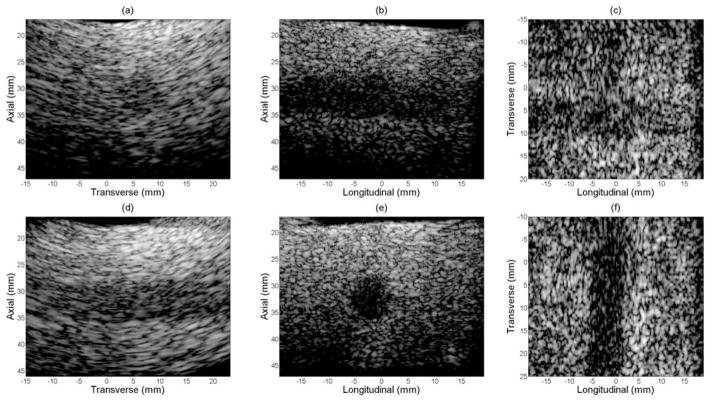
Figure 12, as control, shows volumetric images of a sponge with an 8 mm diameter cylindrical hole, which served as a cyst target phantom without GCF processed. Figure 13 presents the same group of images as in figure 12 with GCF applied on a voxel by voxel basis. In both figures, (a)–(c) show the transverse B-scan, longitudinal B-scan and C-scan with the long axis of the cyst in longitudinal, and (d)–(f) show the two perpendicular B-scans and the C-scan with the phantom rotated 90°. All images are log-compressed and shown with 35 dB and 55 dB dynamic ranges for cases before and after GCF processing respectively. Comparison of contrast-to-noise (CNR) ratio of volumes before and after GCF processing is listed in table 1. Improved image contrast was achieved by applying GCF according to the CNR values.
Figure 12.
Experimental images of cyst phantom without GCF applied.
Figure 13.
Experimental images of cyst phantom with GCF applied.
Table 1.
Comparison of CNR of volumes before and after GCF processing
| Cyst orientation | CNR without GCF | CNR with GCF |
|---|---|---|
| Long axis in longitudinal | 0.91 | 0.97 |
| Long axis in transverse | 1.52 | 1.68 |
IV. Conclusions and discussions
In this paper, we described the design, fabrication, tests and imaging of a proof-of-concept 5 MHz frequency cylindrical dual-layer transducer array for transrectal 3-D imaging. The transducer uses PZT and P[VDF-TrFE] copolymer for transmit and receive, respectively. Experimental impedance measurements and pulse-echo tests of the transducer showed good agreement with simulation results. By imaging a single nitinol wire target, lateral resolution was evaluated for the transducer. In order to improve image quality further, we applied GCF on the cyst phantom images which contained speckles from scatterers in the background.
A slight downshift in frequency was observed from imaging experiments, which was due to the frequency-dependent attenuation of ultrasonic energy during propagation in oil. The reason we used oil as the propagation medium is to better demonstrate the feasibility of the transducer for image real tissues, since the attenuation of oil, which is about 0.57 dB/MHz/cm, is close to the typical soft tissue value of 0.5 dB/MHz/cm. We applied the center frequency of 4.5 MHz, instead of 5 MHz, in Field II to simulate the imaging system more accurately. Figure 8 shows that the measured bandwidth of the transducer was narrower than that was predicted by KLM model. One reason for this is the bond lines between layers could be thicker than expected, and the reverberation would increase the pulse length, narrowing down the frequency bandwidth as a result. Unwanted clutter could be observed in figure 10, which would degrade quality of images. The clutters were likely due to variation of element-to-element performance from the difficulty of achieving uniform pressure over the transducer surface while bonding. In addition, because the dual-layer design allows only one-way focusing in each direction, the transducer will have lower image quality compared to fully-sampled 2-D transducer arrays which are capable of two-way focusing. As a result, signal processing algorithms are required to improve image quality. We used GCF to improve the contrast of the images in this paper. Another promising method is to realize focusing through spatial matched filtering (SMF) the received channel data [23]. Future work will focus on investigating SMF and other signal processing approaches to enhance image quality further.
Our future work will also involve implementing real-time 3-D imaging with the dual-layer transrectal transducer through programming with the VDAS. During real-time data acquisition, a sub-aperture will be used to perform transmit focusing in the transverse direction, and data from all receive channels is collected and focused in the longitudinal direction to create one longitudinal B-scan for each transmit event. The transmit sub-aperture will be moved across the PZT array to acquire a volume of data. Assuming a 10 cm scan depth and that a typical volume would require 128–256 transmit events, a frame rate of 30–60 volumes/s can theoretically be achieved. Parallel computing is necessary to form multiple image lines from each firing. The computation speed for real-time of on-line beamforming can be improved by upgrading hardware, such as using more CPU cores or a GPU with multiple parallel cores. We will also develop dual-layer transrectal transducers of even higher center frequencies (> 7.5 MHz) based on taking advantage of composite materials for the transmit layer and minimizing number of layers in the acoustic stack other than those for transmit and receive. Additionally, we plan to combine other ultrasound modalities to the transducer to further extend its application, such as to evaluate volumetric flow by applying 3-D Doppler measurements [24].
Acknowledgments
The authors acknowledge support from NIH grant CA116379. The authors would also thank Jay Williams, Hyung Ham Kim and Ruimin Chen for help with electrode sputtering and plasma etching.
VI. Reference
- 1.Siegel R, Naishadham D, Jemal A. Cancer statistics, 2012. CA: a cancer journal for clinicians. 2012 Jan-Feb;62:10–29. doi: 10.3322/caac.20138. [DOI] [PubMed] [Google Scholar]
- 2.Heidenreich A, Bellmunt J, Bolla M, Joniau S, Mason M, Matveev V, Mottet N, Schmid HP, van der Kwast T, Wiegel T, Zattoni F. EAU Guidelines on Prostate Cancer. Part 1: Screening, Diagnosis, and Treatment of Clinically Localised Disease. European Urology. 2011 Jan;59:61–71. doi: 10.1016/j.eururo.2010.10.039. [DOI] [PubMed] [Google Scholar]
- 3.Kao J, Cesaretti JA, Stone NN, Stock RG. Update on prostate brachytherapy: long-term outcomes and treatment-related morbidity. Current urology reports. 2011 Jun;12:237–42. doi: 10.1007/s11934-011-0183-3. [DOI] [PubMed] [Google Scholar]
- 4.Ritch CR, Katz AE. Update on cryotherapy for localized prostate cancer. Current urology reports. 2009 May;10:206–11. doi: 10.1007/s11934-009-0035-6. [DOI] [PubMed] [Google Scholar]
- 5.Uchida T, Nakano M, Hongo S, Shoji S, Nagata Y, Satoh T, Baba S, Usui Y, Terachi T. High-intensity focused ultrasound therapy for prostate cancer. International journal of urology: official journal of the Japanese Urological Association. 2012 Mar;19:187–201. doi: 10.1111/j.1442-2042.2011.02936.x. [DOI] [PubMed] [Google Scholar]
- 6.Aigner F, Mitterberger M, Rehder P, Pallwein L, Junker D, Horninger W, Frauscher F. Status of transrectal ultrasound imaging of the prostate. Journal of endourology/Endourological Society. 2010 May;24:685–91. doi: 10.1089/end.2009.0640. [DOI] [PubMed] [Google Scholar]
- 7.Trabulsi EJ, Sackett D, Gomella LG, Halpern EJ. Enhanced transrectal ultrasound modalities in the diagnosis of prostate cancer. Urology. 2010 Nov;76:1025–33. doi: 10.1016/j.urology.2010.05.022. [DOI] [PubMed] [Google Scholar]
- 8.Park SH, Choi BI, Han JK, Yoon CJ, Lee JW, Kim SS, Han H. Volumetric tumor measurement using three-dimensional ultrasound: in vitro phantom study on measurement accuracy under various scanning conditions. Ultrasound in medicine & biology. 2004 Jan;30:27–34. doi: 10.1016/j.ultrasmedbio.2003.09.010. [DOI] [PubMed] [Google Scholar]
- 9.Tong S, Downey DB, Cardinal HN, Fenster A. A three-dimensional ultrasound prostate imaging system. Ultrasound in medicine & biology. 1996;22:735–46. doi: 10.1016/0301-5629(96)00079-8. [DOI] [PubMed] [Google Scholar]
- 10.Natarajan S, Marks LS, Margolis DJ, Huang J, Macairan ML, Lieu P, Fenster A. Clinical application of a 3D ultrasound-guided prostate biopsy system. Urologic oncology. 2011 May-Jun;29:334–42. doi: 10.1016/j.urolonc.2011.02.014. [DOI] [PMC free article] [PubMed] [Google Scholar]
- 11.Wen X, Salcudean ST, Lawrence PD. Detection of brachytherapy seeds using 3-D transrectal ultrasound. IEEE transactions on bio-medical engineering. 2010 Oct;57:2467–77. doi: 10.1109/TBME.2010.2053926. [DOI] [PubMed] [Google Scholar]
- 12.Smith WL, Lewis C, Bauman G, Rodrigues G, D’Souza D, Ash R, Ho D, Venkatesan V, Downey D, Fenster A. Prostate volume contouring: a 3D analysis of segmentation using 3DTRUS, CT, and MR. International journal of radiation oncology, biology, physics. 2007 Mar 15;67:1238–47. doi: 10.1016/j.ijrobp.2006.11.027. [DOI] [PubMed] [Google Scholar]
- 13.Kadoury S, Yan PK, Xu S, Glossop N, Choyke P, Turkbey B, Pinto P, Wood BJ, Kruecker J. Realtime TRUS/MRI Fusion Targeted-Biopsy for Prostate Cancer: A Clinical Demonstration of Increased Positive Biopsy Rates. Prostate Cancer Imaging: Computer-Aided Diagnosis, Prognosis, and Intervention. 2010;6367:52–62. [Google Scholar]
- 14.Fei B, Master V, Nieh P, Akbari H, Yang X, Fenster A, Schuster D. A PET/CT Directed, 3D Ultrasound-Guided Biopsy System for Prostate Cancer. Prostate Cancer Imaging 2011, LNCS. 2011;6963:100–108. doi: 10.1007/978-3-642-23944-1_11. [DOI] [PMC free article] [PubMed] [Google Scholar]
- 15.Ukimura O, Desai MM, Palmer S, Valencerina S, Gross M, Abreu AL, Aron M, Gill IS. 3-Dimensional elastic registration system of prostate biopsy location by real-time 3-dimensional transrectal ultrasound guidance with magnetic resonance/transrectal ultrasound image fusion. The Journal of urology. 2012 Mar;187:1080–6. doi: 10.1016/j.juro.2011.10.124. [DOI] [PubMed] [Google Scholar]
- 16.Yen JT, Seo CH, Awad SI, Jeong JS. A dual-layer transducer array for 3-D rectilinear imaging. IEEE transactions on ultrasonics, ferroelectrics, and frequency control. 2009 Jan;56:204–12. doi: 10.1109/TUFFC.2009.1020. [DOI] [PMC free article] [PubMed] [Google Scholar]
- 17.Chen Y, Nguyen M, Yen JT. 7.5 MHz dual-layer transducer array for 3-D rectilinear imaging. Ultrasonic imaging. 2011 Jul;33:205–16. doi: 10.1177/016173461103300305. [DOI] [PMC free article] [PubMed] [Google Scholar]
- 18.Yen JT, Smith SW. Real-time rectilinear volumetric imaging. IEEE transactions on ultrasonics, ferroelectrics, and frequency control. 2002 Jan;49:114–24. doi: 10.1109/58.981389. [DOI] [PubMed] [Google Scholar]
- 19.Pua EC, Yen JT, Smith SW. Real-time cylindrical curvilinear 3-D ultrasound imaging. Ultrasonic imaging. 2003 Jul;25:137–50. doi: 10.1177/016173460302500302. [DOI] [PubMed] [Google Scholar]
- 20.Jensen JA, Svendsen NB. Calculation of pressure fields from arbitrarily shaped, apodized, and excited ultrasound transducers. IEEE transactions on ultrasonics, ferroelectrics, and frequency control. 1992;39:262–7. doi: 10.1109/58.139123. [DOI] [PubMed] [Google Scholar]
- 21.Li PC, Li ML. Adaptive imaging using the generalized coherence factor. IEEE transactions on ultrasonics, ferroelectrics, and frequency control. 2003 Feb;50:128–41. doi: 10.1109/tuffc.2003.1182117. [DOI] [PubMed] [Google Scholar]
- 22.Krimholt R, Leedom DA, Matthaei GL. New Equivalent Circuits for Elementary Piezoelectric Transducers. Electronics Letters. 1970;6:398–399. [Google Scholar]
- 23.Kim KS, Liu J, Insana MF. Efficient array beam forming by spatial filtering for ultrasound B-mode imaging. The Journal of the Acoustical Society of America. 2006 Aug;120:852–61. doi: 10.1121/1.2214393. [DOI] [PMC free article] [PubMed] [Google Scholar]
- 24.Kripfgans OD, Rubin JM, Hall AL, Gordon MB, Fowlkes JB. Measurement of volumetric flow. Journal of ultrasound in medicine: official journal of the American Institute of Ultrasound in Medicine. 2006 Oct;25:1305–11. doi: 10.7863/jum.2006.25.10.1305. [DOI] [PubMed] [Google Scholar]


