Abstract
A low-dimensional parametric deformation model of a cancer cell under shear flow is developed. The model is built around an experiment in which MDA-MB-231 adherent cells are subjected to flow with increasing shear. The cell surface deformation is imaged using differential interference contrast microscopy imaging techniques until the cell releases into the flow. We post-process the time sequence of images using an active shape model from which we obtain the principal components of deformation. These principal components are then used to obtain the parameters in an empirical constitutive equation determining the cell deformations as a function of the fluid normal and shear forces imparted. The cell surface is modeled as a 2D Gaussian interface which can be deformed with three active parameters: H (height), σx (x-width), and σy (y-width). Fluid forces are calculated on the cell surface by discretizing the surface with regularized Stokeslets, and the flow is driven by a stochastically fluctuating pressure gradient. The Stokeslet strengths are obtained so that viscous boundary conditions are enforced on the surface of the cell and the surrounding plate. We show that the low-dimensional model is able to capture the principal deformations of the cell reasonably well and argue that active shape models can be exploited further as a useful tool to bridge the gap between experiments, models, and numerical simulations in this biological setting.
INTRODUCTION
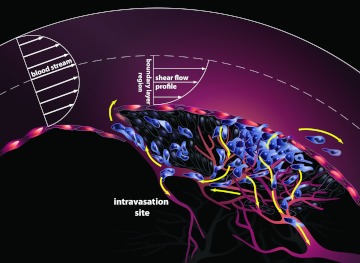
The “fluid phase” of cancer begins when cancer cells making up the primary tumor mass are released into the bloodstream. Some of these circulating tumor cells (CTCs) will become the future “seeds” when they implant themselves at distant sites, and the deadly extravasation step in the metastatic cascade will commence.1 The schematic associated with the main physical mechanisms involved in this early stage event is shown in Figure 1. Mechanical models for this intravasation step2, 3 are important to develop, primarily for the purposes of gaining a fundamental understanding of the initiation of metastatic spread.
Figure 1.
Schematic diagram showing the early stage of cancer progression, called the “intravasation” stage. Primary tumor cells in contact with the bloodstream experience shear forces that can be strong enough to exceed the adhesion forces keeping them attached to the primary tumor. Upon release into the incoming flow, they become circulating tumor cells capable of spreading the disease to remote sites.
The reality of developing a high-fidelity model of circulating tumor cell and cell cluster deformation and release requires knowledge of (i) the competing forces acting on the cell surface from the incoming blood flow which act to tear the CTC from the primary tumor, and the ligand-receptor bonds which hold the cell in place;4, 5 (ii) knowledge of the constitutive equation associated with the cell membrane5, 6 and a fine scale discretization of the deformable cell surface for a high fidelity numerical simulation; (iii) modeling assumptions on the (blood) flow field, which is near the vessel wall, hence in the Stokes regime.7, 8, 9 Examples of free-standing computational models of cell deformation under flow are those of Refs. 10 and 11 which focus on the “rolling” regime of 3D deformable cells near vessel walls. A very comprehensive overview of the biomechanical properties of cancer cells is given in Ref. 5 along with references therein.
The primary goal of this paper is not to develop and describe a free standing physics based model of circulating tumor cell deformation and release, but to show how a software tool called the “active shape model” (ASM)12 can be exploited for use in bridging the gap that often exists between experiment and model development in the context of cancer cell deformation. In general terms, active shape models are statistical models that can track the shape of an object as it dynamically deforms. The models need to be trained on a sequence of images (the “training” experiment) from which they learn the principal components of deformation of an object. In our context, we then use those trained principal components of deformation as inputs for a low-dimensional parametric deformation model of the cancer cell under flow. This allows us to compute the fluid forces on a model cell surface and calibrate/tune the parameters in an empirical constitutive equation relating forces to response, so that the response matches the trained principal components obtained from the experiment. Although “active shape models,” “active appearance models,”13 and “active contour models”14 have been used in medical applications,15, 16 to our knowledge, their use in the context described here, i.e., to calibrate/tune parameters for use in an empirical constitutive equation, is new and potentially useful in situations where a first-principle constitutive equation is not known.
The main goals and steps of the procedures described in this paper are laid out as follows:
-
1.
In the physical experiment described, we cannot measure forces on the cell surface directly. We can only visualize the surface deformation/shape as a function of the external flow parameters and time (as shown in Figure 4).
-
2.
For the numerical simulation, we do not have a good model for the constitutive equation for how the cell surface responds to forces, hence we cannot do a “stand-alone” numerical simulation of the fluid-cell surface interaction and deformation.
-
3.
Our goal is to obtain an “empirical” constitutive law, trained from an experimental run. Once this is obtained, we can use the “trained” model for Stokes flow numerical simulations in a more general setting.
-
4.
To obtain the empirical constitutive force-response law, we make a “Hooke's law” (linear) constitutive assumption. Then, we use the sequence of shape changes obtained from the training experiment as inputs to our Gaussian surface model (some generic shapes are shown in Figure 5). This allows us to compute the fluid forces on the “low-dimensional” deforming Gaussian surface using a Stokes flow simulation with distributed Stokeslets on the Gaussian surface. The outputs from the training run are shown in Figures 67.
-
5.
We then use the “trained” empirical constitutive equation to carry out a new flow simulation, both deterministic and stochastic. The flow simulation is driven by a deterministic and stochastic pressure gradient. The outputs from the flow simulation using the trained model are shown in Figures 1011.
Figure 4.
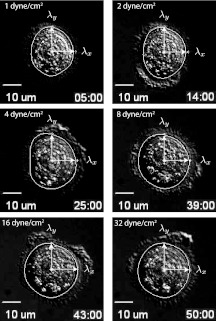
Principal components of deformation (λx, λy) for 6 representative frames in a 52 min run. Time sequence shown: 5 min, 14 min, 25 min, 39 min, 43 min, and 50 min. Cell releases into flow at 52 min. The white curve is the average cell shape obtained from the ASM algorithm during the 10 min window in which the flow rate is fixed. The black curves are the contours of the Gaussian cell surface model. Thick black curve is the closest elliptical contour to the white curve. Cell width is roughly 20 μm across. Flow is from left to right.
Figure 5.
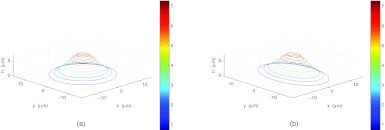
Cell model with two different parameterizations shown in “z-stack” form. The parameters σx, σy, and H vary, but are constrained so that the total volume above the glass slide inside the cell is held constant. (a) θ = 0, σx = 5, σy = 5, H = 8 and (b) θ = 0, σx = 4, σy = 6.25, H = 8.
Figure 6.
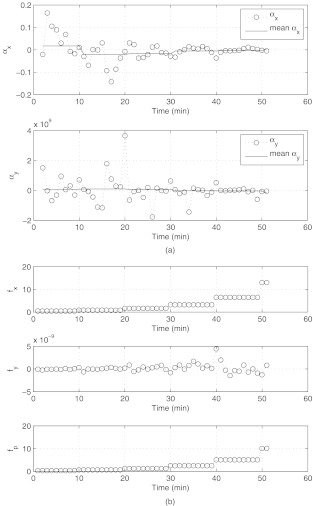
The training experiment. (a) Force-response parameters αx, αy as a function of time. The orders of magnitude are different because the flow is incoming in the x-direction, hence forces are much larger in this direction compared to the cross-flow y-direction. (b) Forces acting on the cell surface. Force in x-direction: fx; force in y-direction: fy; peak normal force: fp. Note the difference in magnitude of the forces in the x and y directions, due to the fact that the flow is incoming and outgoing along the x-direction. Force units are in dynes.
Figure 7.
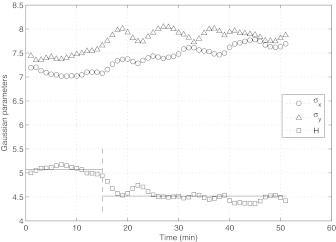
Deformation of the cell surface parameters σx, σy, H, as a function of time. Values are obtained from the training experiment. To the left of the dashed line (T < 15), H remains relatively constant (horizontal lines denote the average height in the two regimes). To the right of the dashed line (T > 15), H abruptly flattens out. Since there is no corresponding abrupt change in the flow, we view the regime T < 15 as a “passive mechanical response” regime, whereas for T > 15, the cell seems to be actively responding to the flow.
Figure 10.
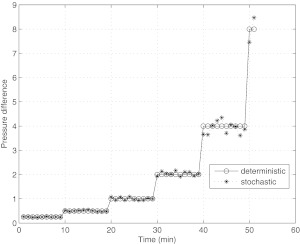
Pressure difference (inflow minus outflow) driving the flow in the numerical simulation. Pressure difference doubles every 10 min interval of time. Stochastic fluctuation is taken to be 10% of the base value. Units are in dynes/cm2.
Figure 11.
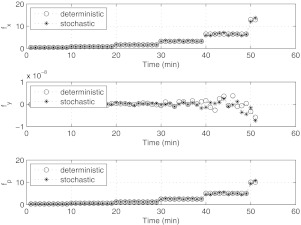
Simulated forces acting on the cell surface. Force in x-direction: fx; force in y-direction: fy; peak normal force: fp. Note the difference in magnitude of the forces in the x and y directions, due to the fact that the flow is incoming and outgoing along the x-direction. Force units are in dynes. Plot should be compared with Figure 6b.
These highlight the main steps which we describe in more detail. We start by describing the experiment which we use to train the model.
THE CELL DEFORMATION/RELEASE EXPERIMENT
MDA-MB-231 cell deformation and release experiment
The “training” experiment proceeds as follows. MDA-MB-231 cells (donated from Dr. Tlsty (University of California, San Francisco, CA)) were plated onto glass coverslips and incubated at 37 °C and 5 CO2 for 24 h. Glass coverlips with plated MDA-MB-231 cells were assembled onto a flow chamber fitted with a silicon rubber gasket with a flow width of 0.25 cm and thickness of 0.005 in (Glycotech). See Ref. 17 for a general discussion of velocity fields for different flow chamber designs. The flow chamber was mounted on the stage of a Zeiss Axiovert 200M inverted microscope (Carl Zeiss). Dulbecco's modified Eagle medium (Invitrogen) with 10% fetal bovine serum (FBS, Invitrogen) was perfused over MDA-MB-231 cells at a fluid shear stress of 1 dyne/cm2. The flow rate was doubled every 10 min to achieve shear stresses of 1, 2, 4, 8, 16, 32 dynes/cm2. Real-time differential interference contrast (DIC) microscopy images were captured every 15 s during perfusion with a 40 ×, 0.75 NA lens using Slidebook software (Intelligent Imaging Innovation).
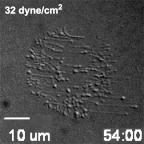
A representative sequence of cell images under flow (obtained from 12 runs of the experiment) are shown in Figure 2. Flow is from left to right. At some point during each run, the cell releases and leaves behind the “ligand footprints” which kept it adhered to the slide. The ligand footprints are shown in Figure 3 in this case, 54 min into the run, 2 min after the cell releases.
Figure 2.
DIC images of a MDA-MB-231 adherent cell subjected to increasing shear flow from 0 to 32 dynes/cm2. The contact ring around the outer region of the cell “ruffles” during the run. Flow is from left to right.
Figure 3.
Ligand “footprints” shortly after cell release into the flow. Adhesion force of cell ligands to slide must be overcome by shear force from the fluid-cell-surface contact for transition from tumor cell to circulating tumor cell to occur.
Active shape model and principal components of deformation
We post-process the sequence of images (roughly 200 images per run) using the open-source software tool “active shape model” (ASM). The ASM algorithm12 is trained from a time sequence of manually drawn contours used as training images. We use the DIC images from the experiment. With each image in the time sequence, we manually mouse-click the outline of the outer contour of the cell. This process could easily be automated for use in a larger setting, using an “active contour” type of model,14 for example. The ASM algorithm then finds the main variations in the training data using principal component analysis, which enables the model to automatically recognize if a contour is a possible/good object contour. For our purposes, we only use the two largest singular values that the model produces (in each frame) to obtain the elliptical shape of the outer contour as a function of time. The experiment was run 12 times and sequences of images for each run were retained. We show an example of one of our post-processed sequences in Figure 4. In each case, the semi-major and semi-minor axes (λx, λy) which the ASM produces are shown. Also shown is the average cell shape (in white) produced by the ASM algorithm (averaged over 10 frames spanning 2 min) during each of the 10 min windows in which the pressure gradient is held fixed. The black elliptical curves are the contours of the cell surface model described next. These sequences give rise to experimentally produced values for (λx, λy) in a time sequence. The cell height is not directly imaged/measured in these runs, hence, we make the assumption that cell volume is held constant which enables us to calculate height once we have the other two deformation parameters in the model.
THE MATHEMATICAL MODELING ASSUMPTIONS
We next describe how this experiment is used to tune the parameters in our low-dimensional model.
The cell surface model and constitutive assumption
In light of the fact that the cell deformations, as shown in Figure 2, are relatively small (compared with the cell size), we use a parametrically deformable surface model for the cell which is of Gaussian shape,18
| (1) |
with parameters
| (2) |
| (3) |
| (4) |
Here, the cell surface height is given by h(x, y), with peak cell height H, x-width σx, y-width σy, and the center of the cell marked by the coordinates (x0, y0). The cell orientation parameter θ is held fixed during the simulation, although for more complex cell tracking experiments, both (x0, y0) and θ could vary.
Contours of the cell surface are shown in Figure 4. Since the cell height is not directly available, we use the (approximately correct) assumption that the volume enclosed by the cell (above the plate) is constant as the cell deforms, which provides a constraint on the three parameters (H, σx, σy). Examples of the cell surface model in “z-stack” form (contour slices of the surface at various heights), with two representative parameter values is shown in Figure 5. In general terms, the 2D Gaussian surface we generate this way closely contours the 2D shape of the cell surface, but we do not yet know how to vary the parameters of the model (H, σx, σy) as a function of the fluid forces produced on the cell surface.
To link the parametric cell deformation model with the fluid flow forces produced, we start with the constitutive assumptions σx(fx, fy), σy(fx, fy) relating cell deformation (response) to forces imparted in each of the x (streamwise) and y (spanwise) directions. In the experiment, the flow is nearly unidirectional (along the x-direction) so the deformation response is much stronger in this direction than in the cross-flow (y) direction. For this reason, ∂σx/∂fy ≈ 0, and ∂σy/∂fx ≈ 0, so we can use a simpler assumption σx(fx), σy(fy). The pressure gradient driving the flow is increased in steps, hence the corresponding forces imparted increase in steps as well. We therefore Taylor expand the deformation functions,
| (5) |
| (6) |
truncating the expansions after the linear terms in (fx, fy). This is what we call our “linear constitutive” assumption. Based on these equations, we set up an iterative scheme of the form
| (7) |
| (8) |
where , , and , . We call these equations the “linear force-response” equations. We then iterate these equations (from frame to frame) throughout the flow run. The variables and are the width variables (in frame n + 1) that we use in our Gaussian surface model, while and are the corresponding values before the iteration step (in frame n). We obtain these from the principal components of deformation (λx, λy) from the flow experiment. The variables fx and fy are the x-component and y-component of the surface normal force on the cell that we numerically compute. From these equations, we obtain the linear parameters αx and αy at each iteration (the data points in Figure 6a), which we then average over each 10 min window (shown in Figure 6a) while the pressure difference driving the flow is held at a fixed nominal value. Since the flow is coming entirely from the x direction, and not the y direction, the magnitudes of the forces in these two directions are different orders, hence the coefficients αx and αy are of different orders of magnitude which is what we expect. In addition, due to the uni-directional nature of the incoming flow (approximately one-dimensional), our simple form for the constitutive equation captures the deformations reasonably well.
The deformations of the cell surface parameters are shown in Figure 7, which depict how the cell height H varies throughout the experimental run. We have divided the time regime into a region to the left of the vertical dashed line (i.e., T < 15), and a region to the right (i.e., T > 15). The horizontal lines in these two regions depict the average cell height. Note the change in this height in these two regimes, the first being fairly constant, followed by an abrupt flattening out of the cell. Roughly speaking, this change in height follows from the fact that both σx and σy increase, and the volume under the cell is held constant. In the first regime (T < 15), the cell seems to be responding in a mechanically passive way to the flow forces. In the second regime (T > 15), the cell response seems to become active, as it is actively attempting to flatten itself to the incoming flow. Various types of active responses have been discussed, documented, and modeled in the literature. For example,19 discuss a cell's propensity to orient in such a way as to reduce the total force on its nucleus. Active nucleus movement in response to shear has also been reported in Ref. 20, while active cytoplasmic response to shear is reported in Ref. 21. Whether or not the transition we see at T ∼ 15 is due to any of these effects is hard to pin down from these particular sets of experiments without more detailed nucleus and cytoplasmic visualization.
Fluid flow computation
To obtain the forces on the cell surface (which are not measured directly in the experiment), we need to perform a fluid flow simulation. Since the flow relevant to the cell release experiment is very near the glass plate, on which we assume viscous boundary conditions, the Reynolds number is small (Re = UL/ν ≪ 1), where U is a representative flow velocity, L is taken to be the flow chamber length, and ν is the fluid kinematic viscosity of blood plasma. Therefore, as in Ref. 8, we assume the flow is governed by the Stokes equations and the continuity equation,
| (9) |
| (10) |
where ∇*p* is the pressure gradient driving the flow in the chamber, μ is the viscosity of the surrounding fluid, whose value we take as that for blood plasma, and is the convective velocity of the fluid. The * denotes quantities that are dimensional, and unstarred quantities will denote dimensionless variables.
Our first task is to scale the dimensional variables in a way that is consistent with the experiment. We use the following scalings: x* = lx, y* = ly, p* = ΔPp, and . l = 10 μm is a representative length of the cell, h = 0.0127 cm and L = 5 cm are the height and length of the flow chamber, ΔP = 10 dyne/cm2 is a representative pressure drop which drives the flow down the chamber across the cell surface, and μ = 0.9cP, which is the value for the Hank's Balanced Salt Solution (HBSS) media used in the experiment (viscosity of blood is roughly μ = 3.2 cP). If we assume a parabolic flow profile,17
| (11) |
then the maximum velocity occurs at the centerline y = h/2 from which we take our velocity scale to be U = ΔPh2/8μL.
The dimensionless equations then become
| (12) |
| (13) |
The pressure conditions are then normalized to 1 (incoming) and 0 (outgoing), and the fluid velocity at the plate y = 0 is . β = h/l is the dimensionless parameter relating the chamber height to the length of the cell, which in our experiment is roughly β = 1.27. To compute the forces on the cell surface, we follow the approach described in Ref. 22, namely, we consider the dimensionless system 12, 13 augmented with an external force which accounts for the interaction between the fluid flow and the cell membrane. Hence we use
| (14) |
| (15) |
We discretize the force on the cell surface with a distribution of regularized Stokeslets22, 23 located at the grid points , i = 1, …, N, where
| (16) |
where is the strength of the ith Stokeslet, is its location, and is a “regularizing function” which has the property
| (17) |
where is the usual Dirac delta function. We use the function
| (18) |
, which is a standard regularization discussed in Ref. 22. The Stokeslet “blob” velocity field in R3 is then given by
| (19) |
where is the solution to
| (20) |
and is the solution to
| (21) |
in infinite space. Gε can be thought of as the regularized Green's function for the problem.
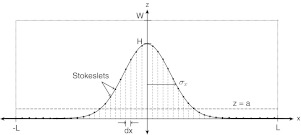
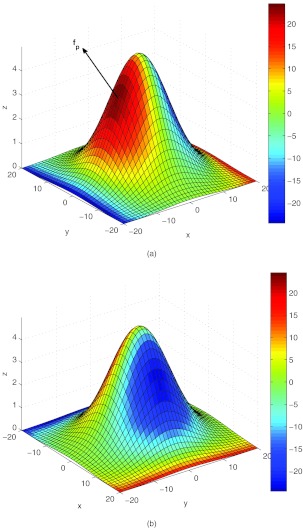
More specifically, we want to determine the forces along the plate and the surface of the cell. A two-dimensional slice of the computational domain is shown in Figure 8. The flow (left to right) is driven by a constant pressure gradient that has reached a steady state. The inflow and outflow velocity conditions are set to be the parabolic Poiseuille flow profile, and viscous no-slip boundary conditions are enforced at the walls of the chamber and along the bottom plate, including the cell surface. In the 3D numerical model, the computational domain is set to be −L < x < L, −L < y < L, 0 < z < W, where L = 40 is the length of the domain in the x and y directions. W = 10 is the length of the domain in z direction. The grid spacing is determined by dx = 1. N = 81 × 81 × 11 = 72, 171 are the total number of Stokeslets used in the simulation. The regularization parameter, ε, that we use is one-fourth of the grid spacing. For the simulation, Stokeslets are placed at every grid point in the computational domain, and the grid spacing is uniform in all three dimensions. Figure 8 shows the x − z slice of the computational domain. The parameters of the cell surface are: H, the maximum height of the cell; σx, the width in the x-direction. We set the plate, which cuts off the Gaussian at the base, at a = 0.005 × H. The Stokeslets above the plane z = a represent the cell surface while those below represent the plate. The rest of the Stokeslets (not pictured in the schematic) lying above the Gaussian surface, represent the fluid. To simulate the flow induced by the constant pressure gradient, a constant force (δP, 0, 0) is imposed on the grid covering the interior of the chamber. The velocity due to this force is computed on the channel walls using the regularized Stokeslets solution for velocity. Then, the forces along the plate and the cell surface are computed so that the boundary conditions are enforced (see details of the method in Ref. 22). The forces on the cell surface, which we are more interested in, are plotted in Figure 9. For more details on how to use the regularized Stokeslets to compute forces on surfaces, see Refs. 22 and 24.
Figure 8.
Schematic of computational domain −L < x < L, −L < y < L, 0 < z < W. Cell surface (z > a) is shown as cut-off Gaussian shape, with plate (dashed) at z = a. Stokeslets are placed on the cell surface and on a regular grid throughout the computational domain. The spacing on the cell surface is obtained from an even distribution of points along the x-direction, then projected up to the cell surface. More details in text.
Figure 9.
Normal force on cell surface computed by discretizing the surface with regularized Stokeslets whose strengths are chosen to enforce the viscous boundary conditions. (a) Front of cell (with respect to incoming flow). fp is the maximum normal force on the cell surface. (b) Back of cell (with respect to incoming flow). Force units are in dynes.
THE CELL DEFORMATION SIMULATION
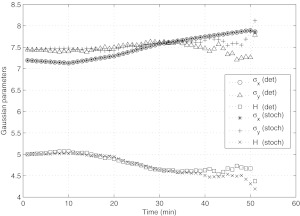
The cell deformation simulation using the trained model proceeds as follows. We carry out both a deterministic and a stochastic simulation. For the stochastic simulation, we obtain a nominal value of the pressure gradient chosen to match the experiment, then we add a random fluctuation with amplitude taken to be 10% of the base value for the deterministic pressure. The random fluctuation is taken to be a uniformly distributed random variable. This is shown in Figure 10. The forces on the model cell surface are computed throughout a flow simulation in which we double the pressure gradient in each 10 min interval of time. The forces on the cell surface are computed using the regularized Stokeslet method, and the parameters αx and αy in the empirical constitutive equations 7, 8 are averaged across 10 min intervals, taking a moving average in which a window of 20 min is used to perform the averages. The forces on the cell surface and the parametric deformations are shown in Figures 1112, respectively.
Figure 12.
Deformation of the cell surface parameters σx, σy, H, as a function of time as obtained from the numerical simulation. Stochastic fluctuations are taken to be 10% of the deterministic base flow. The plot should be compared with the experimental run shown in Figure 7.
Figure 11 shows the simulated forces acting on the cell surface from both deterministic and stochastic runs. This figure should be compared with Figure 6b, which are the forces from the training experiment. The force plots are qualitatively similar. Figure 12 shows the simulated parameter deformations through the flow simulation. In this figure, we show a deterministic simulation and a stochastic simulation, where the stochastic fluctuations are taken to be 10% of the deterministic base flow. Comparisons of Figures 712 show that the parametric deformation of σx, σy, and H between the experiment and the low-dimensional model are trending in the same direction and are qualitatively similar, although quantitative details differ, due presumably to the stochastic component to our flow field and the low-dimensionality of our model.
DISCUSSION AND FUTURE DIRECTIONS
The cell deformation model developed in this paper, in which the cell surface is allowed to deform parametrically as a family of Gaussian surfaces, does a reasonably good job of capturing the principal deformations of a cell under realistic flow conditions when the parameters in the empirical constitutive equations are chosen to match the experiment. The active shape model was used to extract deformation parameters from the experiment and tune the corresponding parameters in an empirical constitutive equation for the cell surface response to the flow, and provided the necessary link between our experiment and a numerical simulation. For this particular experiment, a linear constitutive assumption sufficed due to the relatively mild deformations of the cell, but one could easily imagine extending the technique to situations requiring nonlinear constitutive assumptions in which case higher order terms in 5, 6 would be retained and more complicated assumptions which include cross-flow terms fx fy would need to be used. In that case, a series of different experiments with flow coming from different directions would be used to estimate the parameters.
In this paper, the full capability of the ASM algorithm is not being realized in the sense that once a model is trained by a series of experiments, the algorithm can then be used to simulate the ways in which the trained model acts under a much wider set of conditions than those from which it was originally trained. In principle, for example, one can use it to generate computer animations of a deformable cell which deforms in ways that are consistent with the training sets, but do not necessarily identically match any of the individual experimental runs. As a potentially useful way the algorithm could be used to understand cancer cell deformation, one could imagine setting up two separate flow experiments for training models, one using a normal white blood cell, the other using a circulating tumor cell. The ASM algorithm could be used in this setting to (i) uncover the differences in the modes of deformation of these two kinds of cells, and (ii) run these two differently trained cell models through new environments, such as simulated capillary beds, to quantify differences in their respective responses. We believe ASM and related algorithms, such as the active appearance models13 and active contour models,14 are ripe for further exploitation in these cellular level biological settings.
ACKNOWLEDGMENTS
The project described was supported by Award No. U54CA143906 from the National Cancer Institute. The content is solely the responsibility of the authors and does not necessarily represent the official view of the National Cancer Institute or the National Institutes of Health.
References
- Weinberg R. A., The Biology of Cancer (Garland Science, New York, 2006). [Google Scholar]
- Hunter K. W., Crawford N. P., and Alsarraj J., “Mechanisms of metastasis,” Breast Cancer Res. 10(1), S2 (2008). 10.1186/bcr1988 [DOI] [PMC free article] [PubMed] [Google Scholar]
- Sahai E., “Mechanisms of cancer cell invasion,” Curr. Opin. Genet. Develop. 15, 87–96 (2005). 10.1016/j.gde.2004.12.002 [DOI] [PubMed] [Google Scholar]
- Boal D., Mechanics of the Cell (Cambridge University Press, Cambridge, 2002). [Google Scholar]
- Suresh S., “Biomechanics and biophysics of cancer cells,” Acta Mater. 55, 3989–4014 (2007). 10.1016/j.actamat.2007.04.022 [DOI] [PMC free article] [PubMed] [Google Scholar]
- Wang Y. and Dimitrakopoulos P., “Nature of the hemodynamic forces exerted on vascular endothelial cells or leukocytes adhering to the surface of blood vessels,” Phys. Fluids 18, 087107 (2006). 10.1063/1.2336116 [DOI] [Google Scholar]
- Couzon C., Duperray A., and Verdier C., “Critical stresses for cancer cell detachment in microchannels,” Eur. Biophys. J 38, 1035–1047 (2009). 10.1007/s00249-009-0506-1 [DOI] [PubMed] [Google Scholar]
- D. P.GaverIII and Kute S. M., “A theoretical model study of the influence of fluid stress on a cell adhering to a microchannel wall,” Biophys. J. 75, 721–733 (1998). 10.1016/S0006-3495(98)77562-9 [DOI] [PMC free article] [PubMed] [Google Scholar]
- Kim S. and Karrila S. J., Microhydrodynamics: Principles and Selected Applications (Dover, Mineola, 2005). [Google Scholar]
- Jadhav S., Eggleton C., and Konstantopoulos K., “A 3-D computational model predicts that cell deformation affects selectin-mediated leukocyte rolling,” Biophys. J. 88, 96–104 (2005). 10.1529/biophysj.104.051029 [DOI] [PMC free article] [PubMed] [Google Scholar]
- Pawar P., Jadhav S., Eggleton C. D., and Konstantopoulos K., “Roles of cell and microvillus deformation and receptor-ligand binding kinetics in cell rolling,” Am. J. Physiol. Heart Circ. Physiol. 295, H1439–H1450 (2008). 10.1152/ajpheart.91536.2007 [DOI] [PMC free article] [PubMed] [Google Scholar]
- Cootes T. F., Taylor C. J., Cooper D. H., and Graham J., “Active shape models—Their training and application,” Comput. Vis. Image Underst. 61(1), 38–59 (1995). 10.1006/cviu.1995.1004 [DOI] [Google Scholar]
- Cootes T. F., Edwards G. J., and Taylor C. J., “Active appearance models,” IEEE Trans. Pattern Anal. Mach. Intell. 23(6), 681–685 (2001). 10.1109/34.927467 [DOI] [Google Scholar]
- Kass M., Witkin A., and Terzopoulos D., “Snakes: Active contour models,” Int. J. Comput. Vis. 1(4), 321–333 (1988). 10.1007/BF00133570 [DOI] [Google Scholar]
- Cootes T. F., Hill A., Taylor C. J., and Haslam J., “The use of active shape models for locating structures in medical images,” Image Vis. Comput. 12(6), 355–366 (1994). 10.1016/0262-8856(94)90060-4 [DOI] [Google Scholar]
- Roberts M. G., Cootes T. F., and Adams J. E., “Automatic segmentation of lumbar vertebrae on digitized radiographs using linked active appearance models,” Proc. Med. Image Underst. Anal. 2, 120–124 (2006). [Google Scholar]
- Bakker D. P., van der Plaats A., Verkerke G. J., Busscher H. J., and van der Mei H. C., “Comparison of velocity fields for different flow chamber designs used in studies of microbial adhesion to surfaces,” Appl. Environ. Microbiol. 69(10), 6280–6287 (2003). 10.1128/AEM.69.10.6280-6287.2003 [DOI] [PMC free article] [PubMed] [Google Scholar]
- Yamaguchi T., Yamamoto Y., and Liu H., “Computational mechanical model studies on the spontaneous emergent morphogenesis of the cultured endothelial cells,” J. Biomech. 33, 115–126 (2000). 10.1016/S0021-9290(99)00159-1 [DOI] [PubMed] [Google Scholar]
- Hazel A. L. and Pedley T. J., “Vascular endothelial cells minimize the total force on their nuclei,” Biophys. J. 78, 47–54 (2008). 10.1016/S0006-3495(00)76571-4 [DOI] [PMC free article] [PubMed] [Google Scholar]
- Lee J. S. H., Chang M. I., Tseng Y., and Wirtz D., “Cdc42 mediates nucleus movement and MTOC polarization in Swiss 3T3 fibroblasts under mechanical shear stress,” Mol. Biol. Cell 16, 871–880 (2005). 10.1091/mbc.E03-12-0910 [DOI] [PMC free article] [PubMed] [Google Scholar]
- Lee J. S. H., Panorchan P., Hale C. M., Khatau S. B., Kole T. P., Tseng Y., and Wirtz D., “Ballistic intracellular nanorheology reveals ROCK-hard cytoplasmic stiffening response to fluid flow,” J. Cell Sci. 119, 1760–1768 (2006). 10.1242/jcs.02899 [DOI] [PubMed] [Google Scholar]
- Cortez R., “The method of regularized stokeslets,” SIAM J. Sci. Comput. (USA) 23(4), 1204–1225 (2001). 10.1137/S106482750038146X [DOI] [Google Scholar]
- Hasimoto H. and Sano O., “Stokeslets and eddies in creeping flow,” Ann. Rev. Fluid Mech. 12, 335–363 (1980). 10.1146/annurev.fl.12.010180.002003 [DOI] [Google Scholar]
- Ainley J., Durkin S., Embid R., Boindala P., and Cortez R., “The method of images for regularized stokeslets,” J. Comput. Phys. 227, 4600–4616 (2008). 10.1016/j.jcp.2008.01.032 [DOI] [Google Scholar]


