

Abstract
Myosin IC (myo1c), a widely expressed motor protein that links the actin cytoskeleton to cell membranes, has been associated with numerous cellular processes, including insulin-stimulated transport of GLUT4, mechanosensation in sensory hair cells, endocytosis, transcription of DNA in the nucleus, exocytosis, and membrane trafficking. The molecular role of myo1c in these processes has not been defined, so to better understand myo1c function, we utilized ensemble kinetic and single-molecule techniques to probe myo1c’s biochemical and mechanical properties. Utilizing a myo1c construct containing the motor and regulatory domains, we found the force dependence of the actin-attachment lifetime to have two distinct regimes: a force-independent regime at forces < 1 pN, and a highly force-dependent regime at higher loads. In this force-dependent regime, forces that resist the working stroke increase the actin-attachment lifetime. Unexpectedly, the primary force-sensitive transition is the isomerization that follows ATP binding, not ADP release as in other slow myosins. This force-sensing behavior is unique amongst characterized myosins and clearly demonstrates mechanochemical diversity within the myosin family. Based on these results, we propose that myo1c functions as a slow transporter rather than a tension-sensitive anchor.
Keywords: mechanochemistry, optical tweezers, transient kinetics
Myosin IC (myo1c) is a widely expressed myosin-I isoform that has been associated with several important cellular processes, including endocytosis (1), exocytosis (2) (including insulin-stimulated GLUT4 translocation to the cell membrane; refs. 3–5), membrane ruffling (6), transcription of DNA in the nucleus (7, 8), and mechanosensing in sensory hair cells (9–13). Although it is known that myo1c links cell membranes to the actin cytoskeleton (14, 15), its molecular role in these cellular processes has not been determined. For example, in its proposed role in exocytosis, it is not known if myo1c acts as a motor for transport, moving vesicles into position for plasma membrane fusion and/or as a tension-sensitive anchor that docks exocytic vesicles to the actin cytoskeleton and plasma membrane.
Most members of the myosin family share the same kinetic pathway for ATP hydrolysis, in which force-generating structural changes are linked to release of inorganic phosphate and ADP, but different myosin isoforms have evolved different biochemical reaction rates and force-dependent kinetics to suit their cellular functions. For example, in myosins that are thought to act as tension-sensitive anchors, the kinetic steps that limit actomyosin detachment are highly sensitive to load. In contrast, myosins that are thought to act as transporters have actin-detachment kinetics that are less sensitive to load, allowing work to be performed over a range of forces. Thus, insight into the molecular role of myosin in the cell can be gained from evaluating the kinetic and mechanical properties of the motor.
Previous biochemical analyses have shown that myo1c is a low-duty ratio motor (i.e., it spends most of its biochemical cycle detached from actin) (10, 12, 16), albeit with an actin-attachment lifetime that is approximately 500-fold longer than fast skeletal muscle myosin-II (17) and approximately 10-fold longer than the processive motor, myosin-V (18). The rate constants that define the myo1c actin-activated ATPase pathway in solution are very similar to myo1b (10, 12, 16, 19), a closely related myosin-I isoform that has actin-detachment kinetics that are exquisitely sensitive to tension (20). Myo1b is suited to function as a tension-sensitive anchor, transforming from a low duty-ratio motor to a high duty ratio-motor with forces resisting its working stroke > 0.5 pN. Moreover, the rate of actin translocation in the in vitro motility assay is similar for both myo1b (21) and myo1c (16) (when corrected for the differences in length of the light chain–binding domain). Given the similarity of their unloaded biochemical properties, one may have expected myo1c to share the force-sensing properties of myo1b (22, 23).
To better define the molecular role of myo1c in the cell, we examined the mechanical and kinetic properties of a myo1c construct containing the motor and regulatory domains (myo1c3IQ) at the ensemble level and the single-molecule level in the presence and absence of force. We found that, compared to myo1b, myo1c3IQ displays a more modest change in attachment lifetime in response to force. In fact, myo1c3IQ’s actin-attachment lifetime is insensitive to low forces (< 1 pN), but very sensitive to higher loads (> 1 pN) that resist the powerstroke where increasing force on the myosin increases the attachment lifetime. Furthermore, the primary force-sensitive transition in myo1c3IQ appears not to be associated with ADP release, as has been observed in many other slow myosins [including myo1b (20, 24), myosin-V (25), and smooth muscle myosin (26, 27)], but rather with an isomerization that follows ATP binding. This force-sensing behavior is unique amongst characterized myosin isoforms. The response of myo1c3IQ to force implies that it is able to generate power over a range of loads, more consistent with its serving a role as a transporter than as a tension-sensitive anchor. Furthermore, these results clearly demonstrate mechanochemical diversity within the myosin-I family, possibly shedding light on the evolutionary imperatives that resulted in the retention of eight distinct myosin-I genes in higher vertebrates.
Results
Actomyo1c3IQ ATPase Ensemble Solution Kinetics.
To correlate mechanical transitions in the optical trap with biochemical transitions, rate and equilibrium constants for key steps of the actomyo1c3IQ ATPase pathway (Scheme 1) were determined at 20 °C using stopped-flow kinetic techniques (Table 1 and SI Text). Some of these rates have already been measured under different buffer (10, 12) and temperature conditions (16); however, they were repeated here to ensure consistency between the ensemble and single-molecule experiments. The steady-state actin-activated ATPase rate increased linearly with the actin concentration, yielding an apparent second-order rate constant (va = 0.0046 ± 0.0006 μM-1 s-1) (Fig. S1A). The ATPase rate did not reach a plateau within the actin concentrations tested, indicating that the KATPase (i.e., the concentration of actin at which half-maximal activation is achieved) value is high (> 150 μM) and the actin affinity is low (16). The apparent rate of ATP cleavage is 33 ± 2 s-1 (Fig. S1B).
Scheme 1.
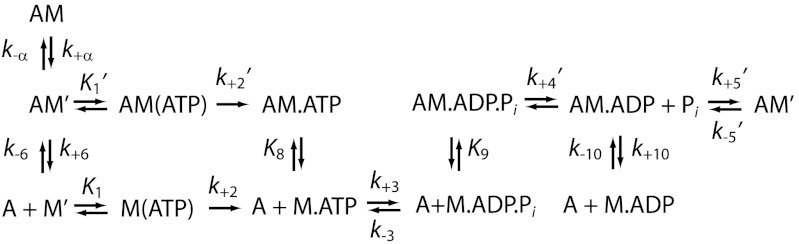
Pathway for the actomyosin ATPase cycle.
Table 1.
Rate and equilibrium constants for key steps of the myo1c3IQ ATPase cycle at 20 °C
| ATP binding | ADP release | ||
 (μM) (μM) |
97 ± 15* |
 (μM) (μM) |
0.22 ± 0.05‡ |
 (s-1) (s-1) |
26 ± 0.8* |
 (s-1) (s-1) |
3.9 ± 0.06‡ |
 (μM-1 s-1) (μM-1 s-1) |
0.26 ± 0.04† |
 (μM-1 s-1) (μM-1 s-1) |
18 ± 4† |
| Nucleotide-free isomerization step |
Actin binding and release |
||
| Kα | 0.33 ± 0.03‡ |
 (s-1) (s-1) |
0.0011‡ |
| k+α (s-1) | 4.0 ± 0.03‡ | k-6 (μM-1 s-1) | 3.4 ± 0.2‡ |
| k-α (s-1) | 12 ± 1† | K6 = KA | 0.29 nM† |
 (s-1) (s-1) |
0.011‡ | ||
| Steady-state actin-activated ATPase |
k-10 (μM-1s-1) | 6.2 ± 0.2‡ | |
| kss (μM-1s-1) | 0.0046 ± 0.0005§ | K10 = KDA | 1.6 nM† |
| Vmax (s-1) | > 0.8§ | KDA/KA | 5.5† |
| ATP hydrolysis |
|||
 (s-1) (s-1) |
33 ± 2¶ | ||
*Light scattering.
†Calculated.
‡Pyrene-actin fluorescence.
§NADH-linked assay.
¶Intrinsic tryptophan fluorescence.
ATP binding to actomyo1c3IQ occurs in two steps (12). A rapid collision complex with ATP ( ) is followed by a slower and effectively irreversible conformational change (
 ) that precedes rapid dissociation of myo1c3IQ from actin (Fig. S2). In the absence of nucleotide, actin-bound myo1c3IQ transits between a state that is able to bind ATP (AM’) and a state that cannot bind ATP (AM) (28). The equilibrium constant for this transition favors the ATP-insensitive (AM) state (Kα = 0.33 ± 0.03) (Table 1). The rate of the transition from AM to AM’ (k+α = 4.0 ± 0.03 s-1) is similar to the rate of ADP release from actomyo1c3IQ (
 ) (Fig. S3). Actomyo1c3IQ has a high affinity for ADP (
 ). The affinity of myo1c3IQ for actin in the absence of nucleotide is tight (K6 = 0.29 nM), and it is weakened by the addition of ADP (K10 = 1.6 nM) (Fig. S3). The ratio of affinities (K10/K6 = KDA/KA) has been termed the coupling constant (22, 23), and the calculated value of 5.5 is similar to previously published values for myo1b (28, 29); however, it is larger than a previously reported value for myo1c (10). Based on the solution kinetics, ADP release is expected to be rate limiting for actomyosin detachment at saturating ATP concentrations; however, a slower transition (likely associated with phosphate release) (16, 19) limits the rate of the overall ATPase cycle. The effective duty ratio of myo1c3IQ at 100 μM actin and saturating ATP concentrations is 0.11.
ADP Release Limits Actomyo1c3IQ Detachment at Low Forces in the Optical Trap.
Single actomyosin interactions were detected using the three-bead assay, in which a single actin filament, suspended between two beads held by separate optical traps, is brought close to the surface of a pedestal bead that is sparsely coated with myo1c3IQ (20, 30, 31). Myo1c3IQ was attached specifically to streptavidin-coated pedestals by a biotinylation tag positioned directly C-terminal to the light chain–binding domain. Bead–actin–bead assemblies were constructed using a unique actin-attachment strategy. We could not use N-ethylmaleimide modified myosin for these assemblies as we had done previously (20, 30) because N-ethylmaleimide–treated myosin retains some ATP sensitivity that becomes problematic at the high ATP concentrations used in the experiments described below. Furthermore, we could not use a biotin–streptavidin linkage because this interferes with the biotin–streptavidin linkage used to attach the myosin site-specifically to the pedestal bead. Instead, we utilized the actin-binding domain of α-actinin fused to the HaloTag gene product, enabling the experiments to be conducted at saturating ATP concentrations while still utilizing streptavidin to attach the myosin specifically to the pedestal bead (for details, see Materials and Methods). Actomyosin-attachment events (Fig. 1A) were identified by analyzing the force covariance of the trapped beads (20) (for details, see Materials and Methods).
Fig. 1.

Optical-trapping experiments performed in the absence of an applied load (369 binding events). (A) Sample data trace of single myosin interactions with actin acquired in the presence of 5 mM ATP. (B) The distribution of attachment durations in the presence of 5 mM ATP. A single exponential function was fit to the data, giving a detachment rate (kdet) of 3.6 ± 0.2 s-1. (C) Ensemble averages of single-molecule interactions were constructed as described in Materials and Methods. Fitting a single exponential function to the time-forward average yields a rate (kforward) of 4.3 s-1. Two exponential functions were summed to fit the time-reverse average, with the major amplitude component (67 ± 4% of the total amplitude) having a rate (kreverse-fast) of 27 ± 3 s-1 and the minor component having a rate (kreverse-slow) of 3.8 ± 0.2 s-1. The size of the working stroke is equal to 7.8 nm, comprised of a first substep of 5.8 nm followed by a 2.0-nm substep. (Inset) A cartoon of the displacement generated by the myo1c3IQ working stroke where the myosin sequentially undergoes a substep from state 1 to 2 before detaching. (D) Distribution of the sizes of the total working stroke for myo1c3IQ. A single Gaussian function was fit to the data, and the reported error (σ) is the standard deviation of the Gaussian function. The total step has a size of 7.8 ± 13 nm. Note that the large variance is caused by Brownian motion–driven fluctuations of the actin filament position.
Actomyo1c3IQ-attachment durations were first determined at low trap stiffness (approximately 0.02 pN/nm) to minimize the force on actomyo1c3IQ during the working stroke. The distribution of attachment durations acquired in the presence of 5 mM ATP could be well fit by a single exponential function (Fig. 1B), yielding an actin-detachment rate (kdet = 3.6 ± 0.2 s-1) that is similar to the measured rate of ADP release ( ), consistent with ADP release limiting actomyosin detachment in the absence of force.
The myo1c working stroke has been shown to be composed of two substeps (12). We determined the substep sizes and kinetics in the presence of 5 mM ATP by ensemble averaging the time courses of individual actomyo1c3IQ interactions that were synchronized at the time when the interactions started (i.e., upon actomyosin attachment) or ended (i.e., upon actomyosin detachment) (20, 24, 32). Ensemble averages that were synchronized at actomyosin attachment were averaged forwards in time (time-forward averages) whereas the interactions that were synchronized at actomyosin detachment were averaged backwards in time (time-reverse averages). Time-forward averages have a rapid initial substep to state 1 (5.8 nm displacement) followed by a slower increase to state 2, which has a final displacement of 7.8 nm (Fig. 1C and Table 2). The total step sizes measured from both the time-forward and time-reverse averages differ by only 5.6%, with the small difference arising from limitations in selecting extension points for ensemble averaging. The distribution of individual myo1c3IQ displacements is well described by a single Gaussian distribution centered at 7.8 nm (Fig. 1D), agreeing with the ensemble averages.
Table 2.
Single molecule optical trapping values
| Working stroke displacement | |
| State 1 | 5.8 nm |
| State 2 | 7.8 nm |
| Attachment duration (5 mM MgATP) | |
| kdet | 3.6 ± 0.2 s-1 |
| Force dependence of the attachment lifetime | ||||
| 5 mM MgATP |
1 mM MgATP, 50 μM ADP |
1 mM MgATP (FPLC purified)* |
5 mM MgATP (high gain) |
|
| ki (s-1) | 5.6(+1.6/-0.8) | 4.0( ± 0.5) | 7.4(+3.9/-0.3) | 6.7(+3.3/-1.2) |
| kf0 (s-1) | 29(+9/-6) | 25(+5/-2) | 24(+10/-13) | 33(+12/-9) |
| ddet (nm) | 5.2(+0.5/-0.6) | 6.3(+0.6/-0.5) | 4.3(+1.5/-0.4) | 6.2(+0.9/-1.1) |
*Experiment was conducted at a higher ionic strength due to the salt necessary to elute the ATP from the column.
The rate of exit from state 1 was determined by fitting the time course of the time-forward average (Fig. 1C) with a single exponential function (kforward = 4.3 ± 0.1 s-1). This rate is similar to the measured ADP-release rate ( ), and it is consistent with the second substep of the working stroke being associated with ADP release as shown previously for myo1c (12) and other myosins (20, 24, 25, 27, 33). The rate of exit from state 2 was determined by fitting the time course of the time-reverse average by exponential functions. We found that the data were best fit by the sum of two exponentials, with the major component having a faster rate (kreverse-fast = 27 ± 3 s-1; 67 ± 4% of the total amplitude) than the minor component (kreverse-slow = 3.8 ± 0.2 s-1). The kreverse-fast rate is similar to the rate of the biochemical step that limits actomyo1c3IQ detachment from state 2 (
 ; Scheme 1 and Table 1).
Force Dependence of Actomyo1c3IQ Detachment.
The force sensitivity of the rate of myo1c3IQ detachment from actin was measured using a feedback system that keeps the actin near its isometric position while myosin undergoes its working stroke (20, 30, 34, 35). Forces applied to the actomyo1c3IQ are determined by the stiffness of the actomyo1c3IQ (and its linkage to the substrate), the position at which myosin binds to the actin filament (which is stochastic) (36), and the size of the working stroke (Materials and Methods).
At forces less than 1 pN, the durations of actin attachments appear to be force-independent (Fig. 2A). Only at forces that exceed 1 pN does there appear to be an increase in the mean duration of attachments. The force dependence of the duration of actin binding is better visualized by plotting the inverse average of attachment durations binned by force (Fig. 2B) to yield detachment rates (kdet). At low forces (< 1 pN), kdet is independent of force, whereas at forces > 1 pN, there is a transition to force-sensitive detachment where kdet slows with increasing force. Force independence of detachment at forces < 1 pN was verified by comparing the distribution of attachment durations between -1 and 0 pN to those between 0 and 1 pN using a two-sample Kolmogorov–Smirnov test (37), which showed no statistical difference between these conditions (P = 0.99).
Fig. 2.

Force sensitivity of myo1c3IQ in the presence of 5 mM ATP. (A) Using the isometric optical clamp to apply a load to the myosin, the force on the myosin and the actomyosin-attachment duration were measured for each single-molecule interaction (n = 670). The 90% confidence intervals were calculated by maximum-likelihood estimation (MLE) of 1,000 bootstrap simulations of the data (see Materials and Methods). The overall detachment rate as a function of force was modeled as the sum of two rates, one force-dependent and one force-independent (Eq. 3). The rate of the force-independent transition (ki) is equal to 5.6(+1.6/-0.8) s-1. The rate of the force-dependent transition in the absence of force (kf0) is equal to 29(+9/-6) s-1 with a distance parameter (ddet) of 5.2(+0.5/-0.6) nm. (B) For the sake of visualization, events were ordered by the average force on the myosin, and sets of 10 points were binned and converted to detachment rates. The thick black line shows the calculated detachment rate as a function of force based on the MLE fitting of the unaveraged data (Fig. 2A). The shaded regions show the 90% confidence interval. Colored diamonds show the rate of the time-reverse ensemble averages binned by force (C). The force bins are 0–1 pN (red), 1–2 pN (orange), 2–3 pN (yellow), 3–4 pN (green), and > 4 pN (purple). The black diamond is the rate (kreverse-fast) at zero force. The dotted line is a fit of the Bell equation to the rates of the time-reverse ensemble averages as a function of force, giving a rate of kf0-ens avg = 26 ± 2 s-1 with a distance parameter (dens avg) of 4.6 ± 0.8 nm. (C) Time-reverse ensemble averages binned by average interaction force. The force bin ranges and colors are as in (B). Single exponential functions were fit to the data, and these rates are plotted (B).
The force independence of actomyosin detachment at forces < 1 pN can be further tested utilizing the Bell equation (38), which describes the force dependence of a mechanochemical transition by:
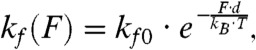 |
[1] |
where kf0 is the rate in the absence of load, d is the distance to the transition state (a measure of force sensitivity, also known as the distance parameter), kB is Boltzmann's constant, and T is the temperature. Fitting the Bell equation to the data at forces < 0.5 pN yields a very small distance parameter for this limited dataset (d0.5 pN = 0.12 ± 0.49 nm), reinforcing the force independence of actomyosin detachment at low forces.
We modeled the observed detachment rate for the entire range of forces as two sequential steps, one force-independent (ki) and one force-dependent [kf(F)]:
| [2] |
This modeling alone cannot distinguish the order of the steps because the two models in Eq. 2 have the same force dependence of the actomyosin-detachment rate, and thus the probability density functions used for maximum-likelihood estimation are identical. The force-dependent rate was modeled using the Bell equation (Eq. 1), and thus the detachment rate (kdet) is given by:
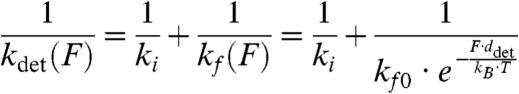 |
[3] |
Maximum-likelihood estimation was used to fit the model to distribution of attachment durations (Fig. 2A), and bootstrapping was used to determine confidence limits (20). We determined values for the force-independent rate [ki = 5.6(+1.6/-0.8) s-1], the force-dependent rate in the absence of force [kf0 = 29(+9/-6) s-1], and the distance parameter for detachment [ddet = 5.2(+0.5/-0.6) nm]. The rate ki is similar to the actomyosin-detachment rate determined in the absence of force (kdet = 3.6 s-1; Fig. 1B), the rate of the exponential increase resolved in the time-forward ensemble average recording (kforward = 4.3 s-1; Fig. 1C), and the rate of ADP release measured by stopped-flow kinetics ( ; Table 1). Surprisingly, the force-dependent rate in the absence of force, kf0, is similar to the rate of the fast exponential increase resolved in the time-reverse average (kreverse-fast = 27 ± 3 s-1; Fig. 1C) and the rate of the biochemical step that limits actomyo1c3IQ detachment from state 2 (
 ; Scheme 1 and Table 1). Note that decreasing the width of the smoothing window in the data analysis to allow for detection of events as short as 15 ms did not change these values (Fig. S4). Thus, the primary force-sensitive transition in myo1c3IQ is not ADP release, as it is in many other slow myosins; rather, the step that follows ATP binding is force sensitive and limits the rate of detachment at high forces (see below).
The rate at which the feedback loop applies force to keep the actin near its isometric position is set by the response time of the feedback loop, 50 ms (20). To determine if the actomyo1c3IQ-attachment durations were sensitive to the rate of the feedback response, we acquired interactions with an approximately 10-fold faster feedback–response time (5–7 ms; Table 2 and Fig. S4) and found no change in the force dependence of the actomyosin-detachment rate.
The Force-Dependent Transition Occurs After ADP Release.
Because the rate of the biochemical step that limits actomyo1c3IQ detachment from state 2 appears to be the primary force-sensitive transition, we examined the force dependence of the lifetime of state 2 using the isometric optical clamp. Individual attachment events were binned based on the average interaction force and then time-reverse ensemble averages were constructed as described earlier. Fitting single exponential functions to the time-reverse ensemble averages shows that the lifetime of state 2 is strongly force-dependent (Fig. 2C). At forces below 1 pN, the rate of exit from state 2 is faster than the rate of actomyo1c3IQ detachment, but at forces > 1 pN, the rate of exit from state 2 is equal to the force-dependent detachment rate (Fig. 2B). Fitting the Bell equation (Eq. 1) to the rates from the loaded time-reverse ensemble averages (Fig. 2B, dashed line) yields a rate at zero force (kf0-ens avg) of 26 ± 2 s-1, which is similar to the rate of the fast-exponential increase in the time-reverse averages in the absence of load (kreverse-fast = 27 ± 3 s-1; Fig. 1C) and the rate of the biochemical transition that limits actomyo1c3IQ detachment from state 2 ( ; Scheme 1 and Table 1). Furthermore, the distance to the transition state (dens avg) of this step is 4.6 ± 0.8 nm, similar to the distance parameter of the transition that limits overall actomyosin detachment [ddet = 5.2(+0.5/-0.6) nm]. Thus, the force-dependent transition that limits detachment at loads greater than 1 pN occurs after the second step of the working stroke and before detachment.
Added ADP Has Little Effect on the Force Dependence of Actomyo1c3IQ Detachment.
The force-dependent behavior of some myosins has been shown to be highly sensitive to the presence of ADP (39, 40). Therefore, we performed experiments with the isometric optical clamp engaged in the presence of 50 μM ADP and 1 mM ATP (Fig. 3). These conditions resulted in force-dependent detachment rates similar to those acquired in the presence of 5 mM ATP. Fitting the attachment durations as a function of force (Fig. 3A) by Eq. 3 yields values that are equivalent to the 5 mM ATP data (Fig. 2A and Table 2). Thus, the presence of ADP does not substantially affect the load-dependent kinetics of myo1c3IQ. We also performed experiments using the isometric optical clamp with 1 mM FPLC-purified ATP to decrease ADP contamination to < 1% of the ATP concentration (see Materials and Methods). We observed the same biphasic force response, and the parameters obtained from fitting Eq. 3 to the data are similar to the values obtained using 5 mM non–FPLC purified ATP (Table 2 and Fig. S4).
Fig. 3.

Force sensitivity of myo1c3IQ in the presence of ADP. The isometric optical clamp was used to examine the force sensitivity of myo1c3IQ at 50 μM ADP and 1 mM ATP (n = 282). (A) Scatter plot of individual single-molecule attachment durations as a function of force . The overall detachment rate as a function of force was modeled as the sum of two rates, one force-dependent and one force-independent (Eq. 3). The best-fit parameters were calculated using MLE fitting and the 90% confidence intervals were calculated by bootstrapping. The force-independent rate (ki) is equal to 4.0(-0.5) s-1. The force-dependent rate (kf0) is equal to 25(+5/-2) s-1 with a distance parameter (ddet) of 6.3(+0.6/-0.5) nm. (B) For the sake of visualization, the detachment rates (the reciprocal of the attachment durations) were binned by force and averaged. The thick black line shows the best-fit curve and the grey-shaded regions show the 90% confidence intervals. All MLE fitting and bootstrapping was performed on the unaveraged data (Fig. 3A).
Discussion
To better understand the molecular role of myo1c in the cell, we utilized ensemble and single-molecule techniques to characterize the mechanochemical cycle of myo1c3IQ. Utilizing a novel bead–actin–bead attachment strategy to maintain high actin pretension in the presence of 5 mM ATP, we found that the actin-attachment lifetime of myo1c3IQ increases only with forces > 1 pN and that it is much less sensitive to force than the closely related myosin-I isoform, myo1b (20). Furthermore, the primary force-sensitive transition in myo1c3IQ is not ADP release [as has been seen in other slow myosins (25, 27), including myo1b (20)], but is rather the isomerization following ATP binding (see below). These results help to shed light on the molecular role of myo1c in the cell and highlight the diversity of mechanochemical tuning within the myosin superfamily.
The Myo1c3IQ Working Stroke.
We resolved two actin-bound mechanical states populated during the myo1c3IQ working stroke (Fig. 1C), as described previously (12). State 1 has a displacement of 5.8 nm and a lifetime equivalent to the AM.ADP biochemical state (Scheme 1 and Tables 1 and 2). Thus, exit from state 1 is associated with the release of ADP from actomyo1c3IQ ( ). Furthermore, this transition limits the overall actin-detachment rate at low loads and saturating ATP concentrations.
State 2 has a displacement of 7.8 nm (2.0 nm larger than state 1). At subsaturating ATP concentrations, the rate of exit from state 2 has been shown to correlate with the second-order rate constant for ATP binding in other myosins (20, 24, 27). Thus, at low ATP concentrations where ATP binding is rate-limiting, state 2 is populated by the nucleotide-free AM’ biochemical state. Our experiments were performed at a saturating ATP concentration (5 mM), and so, based on the transient-kinetics experiments, exit from state 2 is expected to be limited by the rate of  , the isomerization following ATP binding (Fig. 1C and Scheme 1). This conclusion is supported by the finding that the predominant component of the time-reverse averages has a rate (kreverse-fast = 27 ± 3 s-1) similar to the rate of the biochemical transition that limits actomyosin detachment from state 2 (
 ; Table 1). Thus, AM(ATP) is the predominant biochemical intermediate of state 2 under our experimental conditions (Scheme 1). Probing the myosin mechanics at saturating ATP concentrations was facilitated by the development of a unique bead–actin–bead attachment strategy (see Materials and Methods).
The origin of the minor slow phase (kreverse-slow = 3.8 ± 0.2 s-1) in the time-reverse average (Fig. 1C) is unclear. This slow rate is similar to the rate of ADP release (3.9 ± 0.06 s-1), so it is possible that this component arises from rotation of the lever arm and population of state 2 before ADP release occurs (33% of the time), consistent with the finding that nucleotide and structural states are not necessarily tightly coupled (41). This rate is also similar to the rate of exit from the ATP-insensitive AM state (k+α = 4.0 ± 0.03 s-1; Table 1). However, the agreement of the biochemical kinetics (Table 1) with the actin-attachment lifetimes (Fig. 1B and Table 2) suggests that the nucleotide-insensitive state (AM; Scheme 1) is not substantially populated in the presence of 5 mM ATP. It is worth noting that this slow phase is not resolved in the traces collected with the isometric optical clamp engaged, likely because of noise and the fact that it becomes obscured by the slowing of the fast rate with force (see below). Further studies are necessary to determine the origin of this slow phase.
Myo1c3IQ Force-Dependent Detachment.
The rate at which myo1c3IQ detaches from actin is largely independent of load at forces < 1 pN, but is force-dependent at higher loads (Fig. 2). If we assume a sequential three-state model with a force-sensitive step that follows the Bell model (Eq. 3) (38), we conclude that the rate of the force-sensitive transition is faster than the transition that limits detachment at low loads, yet it becomes rate-limiting for detachment when the force on the myosin exceeds 1 pN. Because ADP release limits the overall actomyosin-detachment rate in the absence of force, ADP release is not the primary force-dependent transition as it is in some other myosins (20, 24, 25, 27). This result is notable, because ADP release is associated with a mechanical step of 2.0 nm (Fig. 1). In fact, fitting Eq. 1 to the data acquired at forces < 0.5 pN (i.e., where the rate of ADP release limits actomyosin detachment) yields a very small distance parameter (d0.5 pN = 0.12 ± 0.49 nm), which is far smaller than the size of the second mechanical step. Because the distance parameter for this transition is small, the position of the transition state along the reaction coordinate must be closer to the AM.ADP state than the AM state (42). This feature contrasts with other characterized myosins, where the size of the distance parameter is similar to the size of the mechanical step (27, 33), suggesting the position of the transition state is closer to the AM state in these myosins.
A fit of Eq. 3 to the attachment durations indicates that the force-dependent rate in the absence of force (kf0 = 29 s-1) is similar to the rate of the biochemical step that follows ATP binding ( ; Scheme 1 and Table 1) and the rate of the time-reverse ensemble average in the absence of applied force (kreverse-fast = 27 s-1). Fitting Eq. 1 to the force dependence of the rates of the time-reverse ensemble averages in the presence of load yields a similar rate for the force-sensitive transition in the absence of force (kf0-ens avg = 26 s-1) with a distance parameter (dens avg = 4.6 nm) that is similar to the distance parameter for the transition that limits force-dependent detachment at forces > 1 pN (ddet = 5.2 nm). It is unlikely that the formation of the AM(ATP) collision complex (
 ) is the primary force-dependent step because this would result in a decrease in the second-order rate constant for ATP binding, which would decrease kf0 at lower ATP concentrations (Eq. 3). However, experiments performed at 1 mM ATP (Fig. 3 and Fig. S4) and 5 mM ATP (Fig. 2B) show the same relationship between the detachment rate and force (Table 2). Therefore, our data support the primary force-dependent transition as the isomerization between ATP binding and actomyosin detachment (
 ) (Fig. 4A). It is important to note that other transitions may be force-sensitive; however, these force sensitivities are likely of secondary importance because they do not limit detachment under load.
Fig. 4.

Comparison of myo1c3IQ and the closely related isoform, myo1b (splice isoform “a”). (A) Model of myo1c (blue) interacting with actin (red) in the presence of force. The transition corresponding to ADP release [the primary force-sensitive transition in myo1b (20), smooth muscle myosin-II (27), and myosin-V (25)] is force-insensitive for myo1c3IQ and rate-limiting for actomyosin detachment at forces less than 1 pN. At forces in excess of 1 pN, the primary force-sensitive transition (the isomerization that follows ATP binding) becomes rate-limiting for detachment. (B) The duty ratios of myo1c3IQ (blue) and myo1b (red), calculated from the transient-kinetics and optical-trapping experiments (20), show that the duty ratio of myo1c3IQ is substantially less force-sensitive than myo1b. (C) The calculated average power output (see Materials and Methods) of myo1c3IQ (blue), myo1b (red) (20), smooth muscle myosin-II (purple) (27), and myosin-V (Inset) (18, 25) as a function of force. Note that myo1c3IQ is substantially different from myo1b. Myo1b has a very low power output that approaches zero with very little force, consistent with myo1b acting as a tension-sensitive anchor. Myo1c3IQ, on the other hand, has a higher power output and is able to generate power over a range of forces, more consistent with its functioning as a transporter rather than as a tension-sensing anchor. The power output of myo1c3IQ is lower than smooth muscle myosin-II or myosin-V because of its slower overall kinetics; however, all three of these myosins are able to generate power over a range of forces.
Interestingly, the distance parameters for ATP binding and the subsequent isomerization in myosin-V (25) (d = 0.9 nm), smooth muscle myosin-II (27) (d = 1.3 nm), and myo1b (20) (d = 2.5 nm) are much smaller that the distance parameter for the isomerization following ATP binding in myo1c3IQ (5.2 nm). How the size of this distance parameter is related to conformational changes in the nucleotide and actin-binding sites requires further investigation.
At low ATP concentrations (≤ 20 μM), the actomyosin-detachment rate at low forces is limited by the apparent second-order rate constant for ATP binding ( ) and not ADP release. Because the force-independent regime at high [ATP] occurs over the range of forces where the rate of ADP release is slower than ATP binding, a force-independent regime at forces < 1 pN would not be observed at low [ATP], and the actin-detachment rate would appear to be sensitive to all forces > -1 pN. This finding may explain a previous report of myo1c force dependence conducted at 20 μM ATP, which suggested that kinetics of actomyo1c detachment were sensitive over the range of all of the forces examined (-1 to +1 pN) (43). Our results reinforce the importance of performing experiments at saturating ATP concentrations because different force-dependent transitions may be observed at subsaturating ATP concentrations (44). It is worth pointing out that the myo1c3IQ construct examined in these studies contained the motor and regulatory domains. Future studies utilizing the full-length myo1c molecule will show whether the tail domain plays a role in modulating myo1c mechanochemistry.
Relationship to Other Myosins.
ADP release is the primary force-sensitive transition for several characterized myosins (20, 24, 25, 27). For example, myo1b is a closely related myosin-I isoform with ATPase kinetics similar to myo1c, but the primary force-dependent transition is associated with ADP release (20). Moreover, the myo1b-attachment lifetime is extremely sensitive to applied loads (20, 30). The distance parameter for myo1ba (a myo1b splice isoform with six IQ motifs) is 18 nm, more than threefold greater than the distance parameter for myo1c3IQ (30). This dramatic force sensitivity enables myo1b to function as a tension-sensitive anchor, changing from a low- to a high-duty ratio motor with forces of < 2 pN. Although it has been proposed that myo1c also acts as a tension sensor (10, 12, 45), the data presented here show that myo1c3IQ is substantially less force-sensitive than myo1b (Fig. 2B). The structural basis for these differences is unclear without high-resolution information.
It is worth noting that ATP binding has been proposed to be the primary force-sensitive transition in myosin-VI (46), although this mechanism is still debated (39, 47, 48). The force-dependent ATP-binding model proposes that myosin-VI’s primary force-dependent transition is ATP binding (46) and not the isomerization following ATP binding as seen here for myo1c3IQ. Moreover, the force sensitivity of myo1c3IQ is different from myosin-VI in that it has been shown that the addition of ADP causes an increase in the force sensitivity of myosin-VI (39, 47, 49), whereas ADP has no appreciable effect on the force sensitivity of myo1c3IQ (Fig. 3). The basis for these differences between myo1c3IQ and myosin-VI is not clear; however, the force-sensing mechanism of myo1c3IQ appears to be unique amongst all myosins that have been mechanochemically characterized.
It has been suggested that the ADP coupling constant (i.e., the ratio of the dissociation constant of actomyosin in the presence of ADP to the dissociation constant in the absence of ADP, KDA/KA) is an indicator for whether a myosin is a tension sensor or a fast mover. A coupling constant of < 10 is viewed as a signature for a tension sensor (22, 23), and myo1c3IQ has a coupling constant of 5.5, placing it in the tension-sensor class. Myo1c3IQ (10) and myo1b (28, 29) have similar coupling constants and kinetic rate constants, and thus one would expect them to have similar mechanics and functions; however, this is clearly not the case (Figs. 3 and 4 B and C). Furthermore, myo1b and myo1c3IQ have different kinetic steps as their primary force-sensitive transitions, something not apparent from an analysis of the solution kinetics alone. Previous assignments of the molecular roles of other myosins based solely on kinetics should thus be revisited using mechanical measurements.
The Molecular Role of Myo1c.
The potential molecular roles for myo1c can be broadly divided into two categories with distinct kinetic and mechanical properties: transporter and tension-sensitive anchor. A transporter, such as myosin-V, needs to be able to generate productive work in the presence of a load, and as such, its power output needs to be high and sustained over a range of forces. On the other hand, a tension-sensitive anchor, such as myo1b, needs to be able to remain attached to actin in the presence of load (i.e., its attachment duration is very force-sensitive), and as such, its power output should be low and sensitive to load. The force sensitivity of myo1c3IQ (Figs. 2B and 4B) and its power output over a range of forces (Fig. 4C) are more consistent with myo1c acting as transporter, albeit a slow one, rather than as a tension-sensitive anchor. The slower kinetics of myo1c may allow for the transport of cargos through highly cross-linked actin meshworks without compromising their integrity because the dissociation rate of cytoskeletal cross-linkers are similar to kdet (50, 51). In contrast, cargo transport by myosins with faster stepping kinetics, such as myosin-V, would require disassembly of the actin network because the motor’s stepping rate is faster than the dissociation rate of cytoskeletal cross-linkers. The maximum power output of myo1c3IQ is less than that of smooth muscle myosin-II and myosin-V because of its slower biochemical kinetics; however, all three myosins are similar in that they are able to generate power over a range of forces, enabling them to accomplish work. It is interesting to note that, unlike myosin-VI (39), the force-sensing behavior of myo1c3IQ is not highly ADP-sensitive, potentially enabling myo1c to generate power without stalling at cellular concentrations of ADP.
Myo1c has been proposed to be the slow adaptation motor in sensory hair cells where it senses changes in the tension of the tip link (9–13, 45). If this is myo1c’s role, then models need to incorporate the motor’s unique tension-sensing properties. New models of adaptation may require myo1c to work in ensembles to maintain a dynamic stall where ATP would be continuously hydrolyzed to maintain tension, rather than acting as a myo1b-like tension-sensitive anchor. One of the assumptions of the current model of adaptation is that calcium will cause a decrease in the force sensitivity of the adaptation motor, leading the myosin to detach from actin. Although our experiments have not examined the effect of calcium on myo1c, our previous experiments with myo1b showed that the distance parameter is proportional to the size of the working stroke (30) and that calcium causes a reduction in both (52). In contrast, it has been suggested that calcium increases the size of the myo1c working stroke (12), and thus one would potentially expect calcium to increase the force sensitivity, leading to prolonged attachment. Future studies are warranted to examine the effect of calcium on myo1c mechanochemistry at saturating ATP concentrations.
Materials and Methods
Reagents and Buffers.
ADP and ATP concentrations were determined before each transient-kinetic experiment by absorbance (ε259 = 15,400 M-1 cm-1). The purity of ATP and ADP was assessed by running a 0–1 M salt gradient over a FPLC MonoQ column with bound ATP or ADP. No differences in myosin-loaded or -unloaded kinetics in the optical trap were observed using FPLC-purified ATP, and thus, unless otherwise noted, non–FPLC purified (99% pure) ATP was used. Unless stated otherwise, all experiments were performed in KMg25 buffer (10 mM MOPS, 25 mM KCl, 1 mM MgCl2, 1 mM EGTA, and 1 mM DTT). ATP was always added as MgATP (e.g., solutions containing 5 mM ATP contained 6 mM total MgCl2). All transient-kinetics experiments were conducted in the presence of 1 μM free calmodulin (i.e., in excess of the calmodulin already bound to the myosin from the purification), and all optical-trapping experiments were conducted in the presence of at least 2 μM free calmodulin. Apyrase VII was obtained from Sigma.
Protein Preparation.
The mouse myo1c construct used in these studies consisted of the motor domain, complete regulatory domain with three IQ motifs, a C-terminal FLAG tag for affinity purification, and a C-terminal AviTag for site-specific biotinylation (16). Actin was purified from rabbit skeletal muscle as described (53). Actin concentrations were determined by absorbance at 290 nm (ε290 = 26,600 M-1 cm-1). Calmodulin was prepared as described (54). For single-molecule experiments, actin was polymerized and fluorescently labeled in the presence of 1∶1 molar equivalent TRITC phalloidin (Sigma). For transient-kinetics experiments utilizing N-(1-pyrenyl)iodoacetamide–labeled actin (pyrene actin), the actin was labeled, gel filtered (55), and stabilized with a 1∶1 molar ratio of unlabeled phalloidin.
HaloTag α-Actinin–Coated Beads.
Single-molecule optical-trapping experiments conducted at saturating ATP require an ATP-insensitive linkage that does not interfere or compete with the biotin–streptavidin linkage used to attach the myosin specifically to the pedestal bead. To achieve this, the cDNA sequence for the actin-binding domain of human α-actinin 1 (ACTN1) (residues 30–253) (56) containing a 5′ NdeI site and a 3′ BamH1 site was inserted into the pET28a vector. The pET28a vector also contains a N-terminal hexahistadine tag for protein purification. The HaloTag cDNA sequence was cut from the pFC20A vector (Promega) between the BamH1 and HindIII sites and inserted into the pET vector containing the α-actinin gene insert. This vector was inserted into BL21(DE3) cells and expressed via IPTG induction. The protein was purified by running the cell lysate over a NiNTA column followed by a FLPC MonoQ column (0–1-M KCl gradient).
HaloTag α-actinin–conjugated beads were prepared as follows. First, 1.0-μm diameter amino-functionalized polystyrene beads (2.5% solids; Polysciences) were washed twice in distilled water and then resuspended in PBS, pH 7.0. HaloTag succinimidyl ester O2 ligand (Promega) was then added to 1 mM and allowed to incubate with the beads for 1 h at room temperature. The beads were then washed three times in KMg25 buffer and resuspended with 100–200 μM HaloTag α-actinin in KMg25 buffer. This mixture was allowed to incubate for 1 h at 37 °C before being washed three times in KMg25 buffer. The beads were then resuspended in KMg25 buffer and either used within 1.5 weeks or flash-frozen in liquid nitrogen and stored at -80 °C. HaloTagged α-actinin beads were able to bind to actin and maintain pretensions in excess of 6 pN for greater than 15 min, even in the presence of saturating (5 mM) ATP.
Motility Chamber Preparation.
Nitrocellulose-coated motility chambers containing 1.9 μm silica beads as pedestals (Bangs Laboratories) were prepared as described (20). Solutions were added sequentially to the chamber as follows: 0.1 mg/mL streptavidin in water (5 min); 1 mg/mL bovine serum albumin in KMg25 (2 times 5 min); 2–10 nM biotinylated myo1c3IQ in KMg25 + 2 μM calmodulin (5 min); washed 2-times with KMg25 buffer; and 1 nM TRITC phalloidin–labeled F-actin in KMg25 with 1 mg/mL glucose, 1 mg/mL bovine serum albumin, the desired concentration of ATP, 2 μM calmodulin, 192 U/mL glucose oxidase, and 48 μg/mL catalase (Roche). Beads coated with HaloTagged α-actinin were added to one side of the chamber to replace approximately one-fourth the volume of the chamber. The chamber was sealed with silicon vacuum grease (Dow Corning).
Optical Trapping.
Single-molecule actomyosin interactions were recorded using the three-bead assay geometry in a dual-beam optical-trap system as described (20, 31). For each bead–actin–bead assembly, the trap stiffness and the system-calibration factor were determined by fitting a Lorentzian function to the power spectrum. Trap stiffnesses were approximately 0.02–0.03 pN/nm. Bead–actin–bead assemblies were pre-tensioned to 3–6 pN and lowered onto the surface of a bead pedestal using a piezoelectric stage controller to scan for actomyosin interactions. Upon observation of interactions, data were filtered at 1 kHz and digitized with a 2-kHz sampling rate for up to 10 min. Single-molecule conditions were verified by (i) diluting the myosin such that approximately one in three pedestals yielded actomyosin interactions, and (ii) examining the distributions of covariances for each single-molecule trace (20) (see below).
The force dependence of actomyosin-attachment lifetimes was measured using an isometric optical clamp that applies a dynamic load to the actomyosin to keep the actin filament near its isometric position during the myosin working stroke as described (20, 34, 35). Briefly, changes in the force on the bead attached to the pointed end of the actin filament (transducer bead) were fed through an analog-integrating feedback amplifier to an acousto-optic deflector, which moved the position of the bead bound to the barbed end of the actin filament (motor bead) until the position of the transducer bead was restored to its original position. The response time of the feedback loop in the absence of interactions was adjusted to 50 ms. A positive force is defined as a force that opposes the myosin working stroke.
Event Selection and Ensemble Averaging.
To determine the start and end points of actomyosin attachments, a covariance-threshold selection was used as described (20), using custom software written in LabView (National Instruments). The covariance of the transducer and motor beads was calculated with an 85-ms sliding window and the resulting signal was smoothed over a 50-ms sliding window to construct distributions of covariance values (20). The distribution of covariances was bimodal, with one peak corresponding to the detached state and the other corresponding to the actomyosin-attached state. The beginning of the interaction is defined as the time when the measured covariance became smaller than the covariance at the minimum value between the two covariance peaks. The end of the interaction was defined as the point where the covariance rose above that same threshold. To reduce false-positive events caused by transient decreases in covariance during unattached periods, only events longer than 50 ms (the width of the smoothing window) were scored as events. Changing the width of the smoothing window to 15 ms to allow for detection of events as short as 15 ms did not change the force-dependent behavior (Fig. S4). Ensemble averages were constructed by synchronizing single-molecule interactions and then averaging the interactions forward and reverse in time as described (20, 24, 32).
Power-Output Calculations.
The power output of the different myosin isoforms was calculated as the average power per myosin head. To do this, the velocity as a function of force, V(F), was calculated as: V(F) = w·kdet(F), where w is the size of the total working stroke and kdet(F) is the force-dependent actomyosin-detachment rate. The power produced during actin attachment is equal to the product of the force on the myosin and the velocity, V(F), at that force. Finally, the average power was calculated by multiplying the power produced by myosin during actin attachment by the myosin duty ratio, r, where the duty ratio is given by: 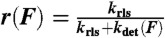 and krls is the rate-limiting step for the detached states [e.g., kss·[actin] for myo1c]. Thus, the average power per myosin head,
  , is given by the expression:
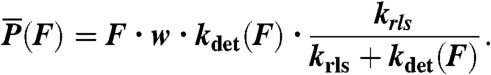 |
[4] |
Statistics and Curve Fitting.
Single or double exponential functions were fitted to stopped-flow fluorescence transients using the software supplied with the instrument. Fitting of the kinetic rates as a function of nucleotide was done in Kaleidagraph (Synergy Software). For all fitted curves, the error bars represent the error in determination of the fit parameter. For all derived parameters, errors were propagated by calculating partial derivatives. Fitting of ensemble averages was performed with custom software written in Matlab (Mathworks). Two-sample Kolmogorov–Smirnov tests were carried out using Matlab.
The force-dependent lifetimes are exponentially distributed at each force, and thus maximum-likelihood estimation was used to determine the parameter values for these experiments (20). Confidence intervals for each uniquely determined parameter were found by simulating the data with a bootstrap routine; 1,000 bootstrapped datasets were generated and fit independently for all of the relevant parameters. The 90% confidence intervals were determined by numerically ordering the values determined by bootstrapping and then finding the bounds that contain ± 45% of the data from the median value.
Supplementary Material
ACKNOWLEDGMENTS.
We thank John H. Lewis for his assistance with the maximum-likelihood estimation and bootstrapping analysis, and Roberto Dominguez for supplying us with the clone for the α-actinin actin-binding domain. This work was supported by National Institute of General Medical Sciences Grant PO1 GM087253 (to E.M.O., H.S., and Y.E.G.), National Institute of Arthritis and Musculoskeletal and Skin Diseases Training Grant T32 AR053461 (to M.J.G.), and F32 GM097889 (to M.J.G.).
Footnotes
The authors declare no conflict of interest.
This article is a PNAS Direct Submission.
See Author Summary on page 14730 (volume 109, number 37).
This article contains supporting information online at www.pnas.org/lookup/suppl/doi:10.1073/pnas.1207811109/-/DCSupplemental.
References
- 1.Sokac AM, Schietroma C, Gundersen CB, Bement WM. Myosin-1c couples assembling actin to membranes to drive compensatory endocytosis. Dev Cell. 2006;11:629–640. doi: 10.1016/j.devcel.2006.09.002. [DOI] [PMC free article] [PubMed] [Google Scholar]
- 2.Brandstaetter H, Kendrick-Jones J, Buss F. Myo1c regulates lipid raft recycling to control cell spreading, migration and Salmonella invasion. J Cell Sci. 2012;125:1991–2003. doi: 10.1242/jcs.097212. [DOI] [PMC free article] [PubMed] [Google Scholar]
- 3.Bose A, et al. Unconventional myosin Myo1c promotes membrane fusion in a regulated exocytic pathway. Mol Cell Biol. 2004;24:5447–5458. doi: 10.1128/MCB.24.12.5447-5458.2004. [DOI] [PMC free article] [PubMed] [Google Scholar]
- 4.Bose A, et al. Glucose transporter recycling in response to insulin is facilitated by myosin Myo1c. Nature. 2002;420:821–824. doi: 10.1038/nature01246. [DOI] [PubMed] [Google Scholar]
- 5.Chen XW, Leto D, Chiang SH, Wang Q, Saltiel AR. Activation of RalA is required for insulin-stimulated Glut4 trafficking to the plasma membrane via the exocyst and the motor protein Myo1c. Dev Cell. 2007;13:391–404. doi: 10.1016/j.devcel.2007.07.007. [DOI] [PubMed] [Google Scholar]
- 6.Ruppert C, et al. Localization of the rat myosin I molecules myr 1 and myr 2 and in vivo targeting of their tail domains. J Cell Sci. 1995;108:3775–3786. doi: 10.1242/jcs.108.12.3775. [DOI] [PubMed] [Google Scholar]
- 7.Pestic-Dragovich L, et al. A myosin I isoform in the nucleus. Science. 2000;290:337–341. doi: 10.1126/science.290.5490.337. [DOI] [PubMed] [Google Scholar]
- 8.Steinberg T, et al. Strain response in fibroblasts indicates a possible role of the Ca(2+)-dependent nuclear transcription factor NM1 in RNA synthesis. Cell Calcium. 2011;49:259–271. doi: 10.1016/j.ceca.2011.03.001. [DOI] [PubMed] [Google Scholar]
- 9.Stauffer EA, et al. Fast adaptation in vestibular hair cells requires myosin-1c activity. Neuron. 2005;47:541–553. doi: 10.1016/j.neuron.2005.07.024. [DOI] [PMC free article] [PubMed] [Google Scholar]
- 10.Adamek N, Coluccio LM, Geeves MA. Calcium sensitivity of the cross-bridge cycle of Myo1c, the adaptation motor in the inner ear. Proc Natl Acad Sci USA. 2008;105:5710–5715. doi: 10.1073/pnas.0710520105. [DOI] [PMC free article] [PubMed] [Google Scholar]
- 11.Gillespie PG. Myosin I and adaptation of mechanical transduction by the inner ear. Philos Trans R Soc Lond B Biol Sci. 2004;359:1945–1951. doi: 10.1098/rstb.2004.1564. [DOI] [PMC free article] [PubMed] [Google Scholar]
- 12.Batters C, et al. Myo1c is designed for the adaptation response in the inner ear. EMBO J. 2004;23:1433–1440. doi: 10.1038/sj.emboj.7600169. [DOI] [PMC free article] [PubMed] [Google Scholar]
- 13.Holt JR, et al. A chemical-genetic strategy implicates myosin-1c in adaptation by hair cells. Cell. 2002;108:371–381. doi: 10.1016/s0092-8674(02)00629-3. [DOI] [PubMed] [Google Scholar]
- 14.Hokanson DE, Laakso JM, Lin T, Sept D, Ostap EM. Myo1c binds phosphoinositides through a putative Pleckstrin homology domain. Mol Biol Cell. 2006;17:4856–4865. doi: 10.1091/mbc.E06-05-0449. [DOI] [PMC free article] [PubMed] [Google Scholar]
- 15.Hokanson DE, Ostap EM. Myo1c binds tightly and specifically to phosphatidylinositol 4,5-bisphosphate and inositol 1,4,5-trisphosphate. Proc Natl Acad Sci USA. 2006;103:3118–3123. doi: 10.1073/pnas.0505685103. [DOI] [PMC free article] [PubMed] [Google Scholar]
- 16.Lin T, Greenberg MJ, Moore JR, Ostap EM. A hearing loss-associated myo1c mutation (R156W) decreases the myosin duty ratio and force sensitivity. Biochemistry. 2011;50:1831–1838. doi: 10.1021/bi1016777. [DOI] [PMC free article] [PubMed] [Google Scholar]
- 17.Lymn RW, Taylor EW. Mechanism of adenosine triphosphate hydrolysis by actomyosin. Biochemistry. 1971;10:4617–4624. doi: 10.1021/bi00801a004. [DOI] [PubMed] [Google Scholar]
- 18.De La Cruz EM, Wells AL, Rosenfeld SS, Ostap EM, Sweeney HL. The kinetic mechanism of myosin V. Proc Natl Acad Sci USA. 1999;96:13726–13731. doi: 10.1073/pnas.96.24.13726. [DOI] [PMC free article] [PubMed] [Google Scholar]
- 19.Lewis JH, Lin T, Hokanson DE, Ostap EM. Temperature dependence of nucleotide association and kinetic characterization of myo1b. Biochemistry. 2006;45:11589–11597. doi: 10.1021/bi0611917. [DOI] [PMC free article] [PubMed] [Google Scholar]
- 20.Laakso JM, Lewis JH, Shuman H, Ostap EM. Myosin I can act as a molecular force sensor. Science. 2008;321:133–136. doi: 10.1126/science.1159419. [DOI] [PMC free article] [PubMed] [Google Scholar]
- 21.Lin T, Tang N, Ostap EM. Biochemical and motile properties of Myo1b splice isoforms. J Biol Chem. 2005;280:41562–41567. doi: 10.1074/jbc.M508653200. [DOI] [PubMed] [Google Scholar]
- 22.Nyitrai M, Geeves MA. Adenosine diphosphate and strain sensitivity in myosin motors. Philos Trans R Soc Lond B Biol Sci. 2004;359:1867–1877. doi: 10.1098/rstb.2004.1560. [DOI] [PMC free article] [PubMed] [Google Scholar]
- 23.Bloemink MJ, Geeves MA. Shaking the myosin family tree: Biochemical kinetics defines four types of myosin motor. Semin Cell Dev Biol. 2011;22:961–967. doi: 10.1016/j.semcdb.2011.09.015. [DOI] [PMC free article] [PubMed] [Google Scholar]
- 24.Veigel C, et al. The motor protein myosin-I produces its working stroke in two steps. Nature. 1999;398:530–533. doi: 10.1038/19104. [DOI] [PubMed] [Google Scholar]
- 25.Veigel C, Schmitz S, Wang F, Sellers JR. Load-dependent kinetics of myosin-V can explain its high processivity. Nat Cell Biol. 2005;7:861–869. doi: 10.1038/ncb1287. [DOI] [PubMed] [Google Scholar]
- 26.Dantzig JA, Barsotti RJ, Manz S, Sweeney HL, Goldman YE. The ADP release step of the smooth muscle cross-bridge cycle is not directly associated with force generation. Biophys J. 1999;77:386–397. doi: 10.1016/S0006-3495(99)76897-9. [DOI] [PMC free article] [PubMed] [Google Scholar]
- 27.Veigel C, Molloy JE, Schmitz S, Kendrick-Jones J. Load-dependent kinetics of force production by smooth muscle myosin measured with optical tweezers. Nat Cell Biol. 2003;5:980–986. doi: 10.1038/ncb1060. [DOI] [PubMed] [Google Scholar]
- 28.Geeves MA, Perreault-Micale C, Coluccio LM. Kinetic analyses of a truncated mammalian myosin I suggest a novel isomerization event preceding nucleotide binding. J Biol Chem. 2000;275:21624–21630. doi: 10.1074/jbc.M000342200. [DOI] [PubMed] [Google Scholar]
- 29.Coluccio LM, Geeves MA. Transient kinetic analysis of the 130-kDa myosin I (MYR-1 gene product) from rat liver. A myosin I designed for maintenance of tension? J Biol Chem. 1999;274:21575–21580. doi: 10.1074/jbc.274.31.21575. [DOI] [PubMed] [Google Scholar]
- 30.Laakso JM, Lewis JH, Shuman H, Ostap EM. Control of myosin-I force sensing by alternative splicing. Proc Natl Acad Sci USA. 2010;107:698–702. doi: 10.1073/pnas.0911426107. [DOI] [PMC free article] [PubMed] [Google Scholar]
- 31.Finer JT, Simmons RM, Spudich JA. Single myosin molecule mechanics: Piconewton forces and nanometre steps. Nature. 1994;368:113–119. doi: 10.1038/368113a0. [DOI] [PubMed] [Google Scholar]
- 32.Chen C, et al. Kinetic schemes for post-synchronized single molecule dynamics. Biophys J. 2012;102:L23–L25. doi: 10.1016/j.bpj.2012.01.054. [DOI] [PMC free article] [PubMed] [Google Scholar]
- 33.Veigel C, Wang F, Bartoo ML, Sellers JR, Molloy JE. The gated gait of the processive molecular motor, myosin V. Nat Cell Biol. 2002;4:59–65. doi: 10.1038/ncb732. [DOI] [PubMed] [Google Scholar]
- 34.Takagi Y, Shuman H, Goldman YE. Coupling between phosphate release and force generation in muscle actomyosin. Philos Trans R Soc Lond B Biol Sci. 2004;359:1913–1920. doi: 10.1098/rstb.2004.1561. [DOI] [PMC free article] [PubMed] [Google Scholar]
- 35.Takagi Y, Homsher EE, Goldman YE, Shuman H. Force generation in single conventional actomyosin complexes under high dynamic load. Biophys J. 2006;90:1295–1307. doi: 10.1529/biophysj.105.068429. [DOI] [PMC free article] [PubMed] [Google Scholar]
- 36.Steffen W, Smith D, Simmons R, Sleep J. Mapping the actin filament with myosin. Proc Natl Acad Sci USA. 2001;98:14949–14954. doi: 10.1073/pnas.261560698. [DOI] [PMC free article] [PubMed] [Google Scholar]
- 37.Press WH. Numerical Recipes in C: The Art of Scientific Computing. 2nd Ed. New York: Cambridge Univ Press; 1992. p. xxvi. [Google Scholar]
- 38.Bell GI. Models for the specific adhesion of cells to cells. Science. 1978;200:618–627. doi: 10.1126/science.347575. [DOI] [PubMed] [Google Scholar]
- 39.Altman D, Sweeney HL, Spudich JA. The mechanism of myosin VI translocation and its load-induced anchoring. Cell. 2004;116:737–749. doi: 10.1016/s0092-8674(04)00211-9. [DOI] [PubMed] [Google Scholar]
- 40.Greenberg MJ, Kazmierczak K, Szczesna-Cordary D, Moore JR. Cardiomyopathy-linked myosin regulatory light chain mutations disrupt myosin strain-dependent biochemistry. Proc Natl Acad Sci USA. 2010;107:17403–17408. doi: 10.1073/pnas.1009619107. [DOI] [PMC free article] [PubMed] [Google Scholar]
- 41.Nesmelov YE, et al. Structural kinetics of myosin by transient time-resolved FRET. Proc Natl Acad Sci USA. 2011;108:1891–1896. doi: 10.1073/pnas.1012320108. [DOI] [PMC free article] [PubMed] [Google Scholar]
- 42.Howard J. Mechanics of Motor Proteins and the Cytoskeleton. Sunderland, MA: Sinauer Associates, Inc.; 2001. p. 367. [Google Scholar]
- 43.Batters C, Wallace MI, Coluccio LM, Molloy JE. A model of stereocilia adaptation based on single molecule mechanical studies of myosin I. Philos Trans R Soc Lond B Biol Sci. 2004;359:1895–1905. doi: 10.1098/rstb.2004.1559. [DOI] [PMC free article] [PubMed] [Google Scholar]
- 44.Visscher K, Schnitzer MJ, Block SM. Single kinesin molecules studied with a molecular force clamp. Nature. 1999;400:184–189. doi: 10.1038/22146. [DOI] [PubMed] [Google Scholar]
- 45.Adamek N, Lieto-Trivedi A, Geeves MA, Coluccio LM. Modification of loop 1 affects the nucleotide binding properties of Myo1c, the adaptation motor in the inner ear. Biochemistry. 2010;49:958–971. doi: 10.1021/bi901803j. [DOI] [PMC free article] [PubMed] [Google Scholar]
- 46.Sweeney HL, et al. How myosin VI coordinates its heads during processive movement. EMBO J. 2007;26:2682–2692. doi: 10.1038/sj.emboj.7601720. [DOI] [PMC free article] [PubMed] [Google Scholar]
- 47.Chuan P, Spudich JA, Dunn AR. Robust mechanosensing and tension generation by myosin VI. J Mol Biol. 2011;405:105–112. doi: 10.1016/j.jmb.2010.10.010. [DOI] [PMC free article] [PubMed] [Google Scholar]
- 48.Robblee JP, Olivares AO, de la Cruz EM. Mechanism of nucleotide binding to actomyosin VI: Evidence for allosteric head-head communication. J Biol Chem. 2004;279:38608–38617. doi: 10.1074/jbc.M403504200. [DOI] [PubMed] [Google Scholar]
- 49.Dunn AR, Chuan P, Bryant Z, Spudich JA. Contribution of the myosin VI tail domain to processive stepping and intramolecular tension sensing. Proc Natl Acad Sci USA. 2010;107:7746–7750. doi: 10.1073/pnas.1002430107. [DOI] [PMC free article] [PubMed] [Google Scholar]
- 50.Jontes JD, Milligan RA, Pollard TD, Ostap EM. Kinetic characterization of brush border myosin-I ATPase. Proc Natl Acad Sci USA. 1997;94:14332–14337. doi: 10.1073/pnas.94.26.14332. [DOI] [PMC free article] [PubMed] [Google Scholar]
- 51.Wachsstock DH, Schwarz WH, Pollard TD. Cross-linker dynamics determine the mechanical properties of actin gels. Biophys J. 1994;66:801–809. doi: 10.1016/s0006-3495(94)80856-2. [DOI] [PMC free article] [PubMed] [Google Scholar]
- 52.Lewis JH, Greenberg MJ, Laakso JM, Shuman H, Ostap EM. Calcium regulation of myosin-I tension sensing. Biophys J. 2012;102:2799–2807. doi: 10.1016/j.bpj.2012.05.014. [DOI] [PMC free article] [PubMed] [Google Scholar]
- 53.Spudich JA, Watt S. The regulation of rabbit skeletal muscle contraction. I. Biochemical studies of the interaction of the tropomyosin-troponin complex with actin and the proteolytic fragments of myosin. J Biol Chem. 1971;246:4866–4871. [PubMed] [Google Scholar]
- 54.Putkey JA, Slaughter GR, Means AR. Bacterial expression and characterization of proteins derived from the chicken calmodulin cDNA and a calmodulin processed gene. J Biol Chem. 1985;260:4704–4712. [PubMed] [Google Scholar]
- 55.Pollard TD. Purification of a high molecular weight actin filament gelation protein from Acanthamoeba that shares antigenic determinants with vertebrate spectrins. J Cell Biol. 1984;99:1970–1980. doi: 10.1083/jcb.99.6.1970. [DOI] [PMC free article] [PubMed] [Google Scholar]
- 56.Borrego-Diaz E, et al. Crystal structure of the actin-binding domain of alpha-actinin 1: Evaluating two competing actin-binding models. J Struct Biol. 2006;155:230–238. doi: 10.1016/j.jsb.2006.01.013. [DOI] [PubMed] [Google Scholar]
