Abstract
Purpose: Here, the authors explore the feasibility of discriminating cancer patients from healthy controls by serum RNA detection based on surface-enhanced Raman spectroscopy (SERS) and multivariate analysis.
Methods: MgSO4-aggregated silver nanoparticles (Ag NP) as the SERS-active substrate presented strong SERS signals to RNA. SERS measurements were performed on two groups of serum RNA samples: one group from patients (n = 31) with gastric cancer and the other group from healthy volunteers (n = 34).
Results: Tentative assignments of the Raman bands in the normalized SERS spectra demonstrated that there are differential expressions of circulating RNA between the gastric cancer group and the control group. Principal component analysis (PCA) combined with linear discriminate analysis (LDA) was introduced to differentiate gastric cancer from normal and achieved sensitivity of 100% and specificity of 94.1%.
Conclusions: This exploratory study demonstrated potential for developing serum RNA SERS analysis into a useful clinical tool for noninvasive screening and detection of cancer.
Keywords: surface-enhanced Raman scattering (SERS), gastric cancer, circulating nucleic acids, cancer screening
INTRODUCTION
Currently gastric cancer is the second leading cause of cancer-associated death; accounting for approximately 600 000 annual deaths worldwide.1 The patients with gastric cancer have poor survival rates mainly due to the advanced stages upon the initial time of diagnosis when cancer cells have metastasized into other parts of the body. Early diagnosis and localization of malignant lesions together with appropriate curative treatment is critical to reduce the mortality rates of the patients.2 However, at present conventional methods such as gastroscope, barium meal, fecal occult blood testing, and conventional tumor markers cannot meet all of the desired criteria of an ideal screening tool which is highly sensitive and specific, fast, and widely accessible.3
Since the discovery of circulating nucleic acids in 1948, many researchers speculated that circulating RNA markers not only provide new targets for cancer detection but also open up the possibility of noninvasive gene expression profiling for cancers.4, 5 Development of rapid and sensitive circulating nucleic acids profiling methods is essential for evaluating the pattern of circulating nucleic acids expression that varies across normal and diseased states. Recently, surface-enhanced Raman scattering (SERS) has emerged as such a technology with great promise for ultrasensitive detection of RNA/DNA.6, 7
Here, we report a new methodology based on SERS technology to analyze RNA in the circulation obtained from gastric cancer patients and healthy volunteers for the purpose of noninvasive detection and diagnosis of cancer. MgSO4-aggregated Ag colloids as an excellent SERS-active substrate were used for detection of serum RNA. PCA-LDA multivariate analysis of the SERS spectra was applied for differentiation of gastric cancer patients from healthy subjects.
EXPERIMENTS AND METHODS
Samples collection and preparation
In this study, a set of 65 blood samples, including 34 normal and 31 gastric cancers (diagnosed according to the 2010 World Health Organization (WHO) histological criteria and classification) were collected from Fujian Provincial Tumor Hospital and had similar ethnic and socioeconomic backgrounds. The mean age for the gastric cancer group was 60 years and the control group was 41 years. There are 17 cases of stage I-II, 14 cases of stage III-IV in gastric cancer group, respectively. Thirty four normal controls were H. pylori negative and 28 in 31 gastric cancers were H. pylori positive.
Serum sample was separated from the whole blood within 2 h after blood was derived and was immediately stored at −80 °C.8 Total RNA was extracted from 250 μl of serum using Trizol Reagent (Invitrogen, Carlsbad, CA) according to the manufacturer's protocol.8 The concentration of total RNA extracted from serum ranged from 18.0 to 55.2 ng/μl.
SERS-active substrate preparation
Briefly, silver colloid solutions were prepared by the aqueous reduction of silver nitrate with sodium citrate according to Lee and Meisel.9 The resulting particles diameter ranged from 70 to 80 nm with an average diameter of 75 nm. Then the silver colloidal solution was concentrated at 10 000 rpm for 10 min. A certain amount of 0.1 M MgSO4 solution was added to the concentrated Ag colloids on the surface of a rectangle aluminum plate. Finally, 5μl of RNA sample was added to the dry aggregated Ag colloids and incubated for 3 min at room temperature before SERS measurements.
SERS measurements
A Renishaw InVia micro-Raman spectroscopy system with a ∼2λ spatial resolution, a 20 mW, 785 nm semiconductor laser as excitation source, was used for the collection of SERS spectra. The detection of Raman signal was carried out with a Peltier cooled charge-coupled device (CCD) camera. Extended scan spectra with a spectral range of 500–1500 cm−1 were acquired using an integration time of 10 s. Three spectra were collected from different locations for each RNA sample to ensure representative sampling and incorporate spot-to-spot variability in signal. DEPC-treated water was used as a control. An automated algorithm for autofluorescence background removal was applied to the measured raw data to extract pure Raman spectra.10 Then all of the pure SERS spectra were normalized to the integrated area under the curve. This reduces the spectral intensity variations between different spectra and facilitates more accurate spectral shape analysis.
Data analysis
The SPSS software package (SPSS Inc., Chicago) was used for data analysis. To test the capability of RNA SERS spectra for differentiating cancer from normal, principal component analysis (PCA) combined with linear discriminate analysis (LDA) was performed on the normalized RNA SERS spectra. The samples are randomly divided into a training set containing 2/3 of gastric cancer samples and 2/3 of normal control samples with the remaining forming the validation set. And then the division into training and validation set is repeated 20 times using a different random selection of samples each time. The classification ability is obtained by taking the average diagnostic accuracy for the 20 divisions. To further assess the performance of the PCA-LDA-based diagnostic algorithm for gastric cancer diagnosis, the receiver operating characteristic (ROC) curve was generated by varying the discrimination threshold levels with leave-one-out, cross validation method.11 One of the most popular measures of the accuracy of a diagnostic test is the area under the ROC curve.
RESULTS AND DISCUSSIONS
Characterization of the SERS-active substrate
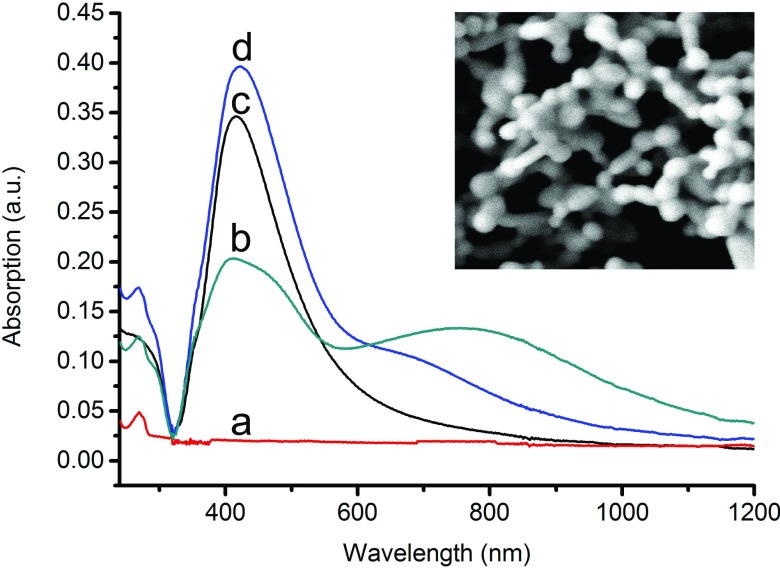
SEM image of MgSO4-aggregated Ag colloids on the surface of aluminum substrate is exhibited in the inserted picture of Fig. 1. Close examination of the SEM image reveals that there are ample nanocavities and nanogaps formed by repetitive stacking of closely adjacent nanoparticles, which can produce great enhancement effects to the Raman signals of RNA samples. From UV- visible spectra (as shown in Fig. 1), we can see the strong absorption band of RNA is at about 269 nm (a) and the intense absorption band of pure silver colloids is at 417 nm (d). When a certain amount of MgSO4 solution was added to the mixture of Ag colloid and RNA, a coupled localized surfaced plasma (LSP) peak emerged in the wavelength region from 700 nm to 900 nm (b), while RNA with the addition of Ag sol did not (c). This phenomenon is usually believed to originate from the surface plasma resonance of aggregated silver nanoparticles.
Figure 1.
The UV-visible absorption spectra of RNA (curve a), pure Ag sol (curve d), the mixture of Ag colloidal and RNA (curve c), and the mixture of Ag colloidal, MgSO4, and RNA solution (curve b). The inserted picture shows SEM images of MgSO4-aggregated Ag colloids on the surface of aluminum substrate.
Spectral assignments and analysis
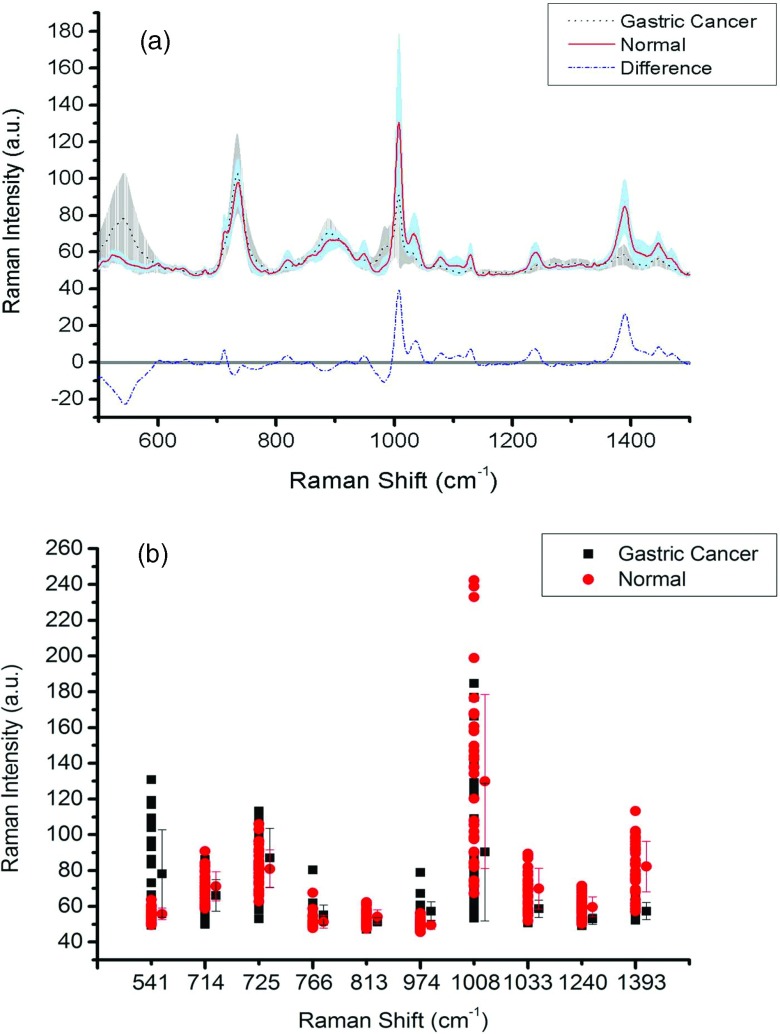
As shown on top of Fig. 2a are the mean SERS spectra of serum RNA obtained from 34 healthy subjects and 31 gastric cancer patients with the standard deviations overlying as different shaded area. The stripe shadow represents the standard deviations of the gastric cancer mean spectra, while the other shaded area indicates the standard deviations of the normal mean spectra. From the mean spectra, we can see that the SERS spectra of serum RNA from gastric cancer and normal groups are very similar to each other. The major spectral difference between gastric cancer and normal groups are in the relative intensities of the bands 541, 714, 725, 766, 813, 974, 1008, 1033, 1240, and 1393 cm−1 which can be viewed more clearly in the difference SERS spectrum [as shown at the bottom of Fig. 2a]. Figure 2b is a scatter plot of the intensity value of selected peaks from normal and gastric cancer spectra and their average peak value with associated standard deviations. All indicated peaks have significantly different mean intensities as determined by student's t-test analysis (p < 0.01). As can be seen clearly, the intensities of SERS peaks at 714, 813, 1008, 1033, 1240, and 1393 cm−1 are obviously greater for normal than for tumor, while SERS bands at 541, 725, 766, and 974 cm−1 are more intense in cancer group.
Figure 2.
(a) Comparison of the normalized mean spectra of serum RNA samples obtained from 31 gastric cancer patients versus 34 healthy volunteers. The shaded areas represent the standard deviations (SD) of the means spectra. The stripe shadow represents the standard deviations of the gastric cancer mean spectra, while the gray shaded area indicates the standard deviations of the normal mean spectra. Also shown at the bottom is the difference spectrum. (b) Comparison of the mean intensities and standard deviations of selected peaks with the most distinguishable differences between gastric cancer and normal serum RNA.
In general, Raman bands can be associated with the vibration of a particular chemical bond or a single functional group in the molecule, therefore distinctive SERS spectral features and intensity differences could discriminate normal from cancer.12, 13 Moreover, in recent years, tumor-associated changes have been observed in the circulating nucleic acids of cancer patients and have been proposed to be useful for the detection and monitoring of cancers.14 Herein, we analyze and characterize the spectral differences of sera RNA between normal and gastric cancer groups.
The SERS spectra that we obtained from normal and gastric cancer groups are very similar to each other except for some peaks’ height. To better understand the molecular components and relative content of serum RNA samples, Table 1 lists tentative assignments for the observed SERS bands (cm−1), according to the literature.15, 16, 17 The major significant SERS spectral differences between the serum RNA of normal and gastric cancer groups were in the relative intensities of the bands such as the modes at 714, 725, and 766 cm−1 that are due to ring breathing modes in the RNA bases, 813, 1240 cm−1 which attribute to the stretch of PO2, and 974 cm−1 which assigns to ribose vibration. These changes might reflect aberrations on malignant transformation associated circulating RNA relative contents. Recently, a number of researches have shown that many tumor-associated microRNAs are upregulated or downregulated in plasma/sera of gastric cancer patients as compared with control samples through high throughput methods, indicating that tumor-associated microRNA in plasma/sera can be used as novel noninvasive biomarkers for gastric cancer early detection.18 In addition, circulating RNA alterations might be detectable ahead of cancer diagnosis, and increasing tumor-relative RNA content might correlate with higher histological grade and worse prognosis (as shown in Figs. S3 and S4 in the supplementary material19). This put forward the possibility of exploiting SERS spectra of circulating RNA as noninvasive biomarkers for diagnosis of cancers and monitoring the recurrence and progression of cancers.
Table 1.
SERS peak positions and vibrational mode assignments.
| Peak | |
|---|---|
| (cm−1) | Assignment |
| 541 | ν(S-S) trans-gauche-trans |
| 714 | Ring breathing modes of Adenine |
| 725 | Ring breathing modes of Adenine |
| 766 | Pyrimidine ring breathing mode |
| 813 | C′ 5–O–P–O–C′ 3 phosphodiester bands in RNA |
| 974 | Ribose vibration |
| 1008 | Stretching of C–O and C–C |
| 1033 | Stretching of C–O and C–C |
| 1240 | Stretching of asymmetric phosphate [PO2- (asym.)] |
| 1393 | CH rocking |
Multivariate analysis
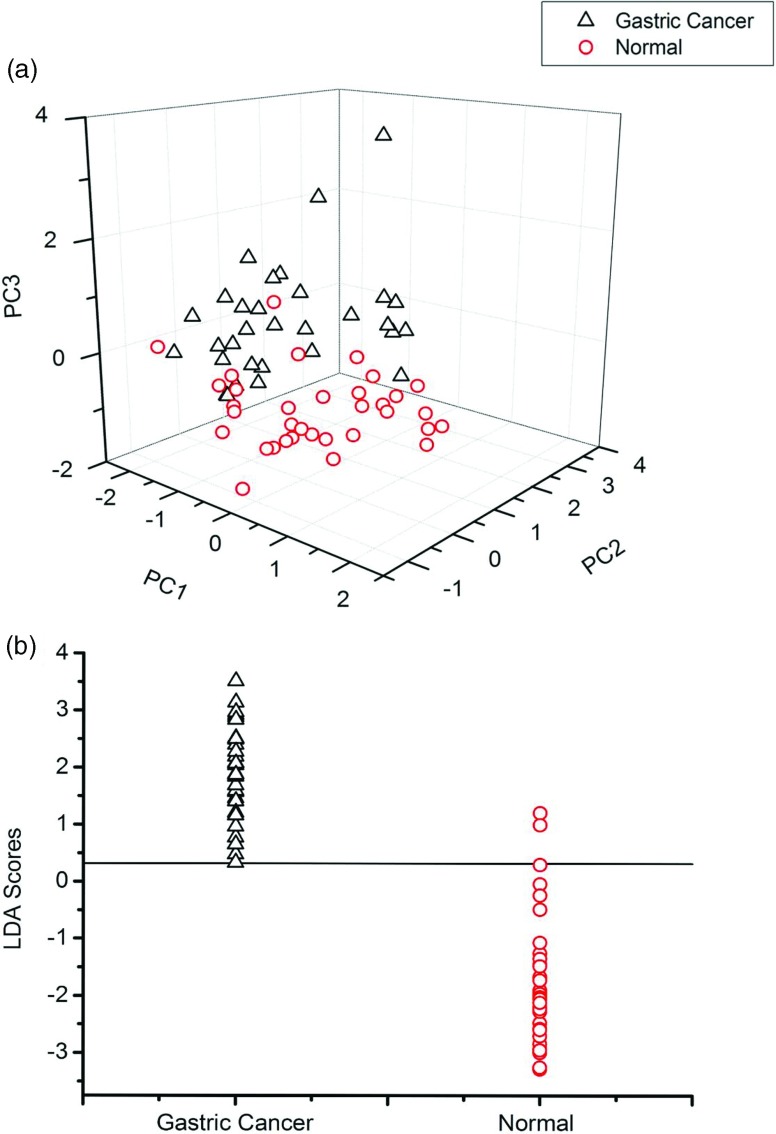
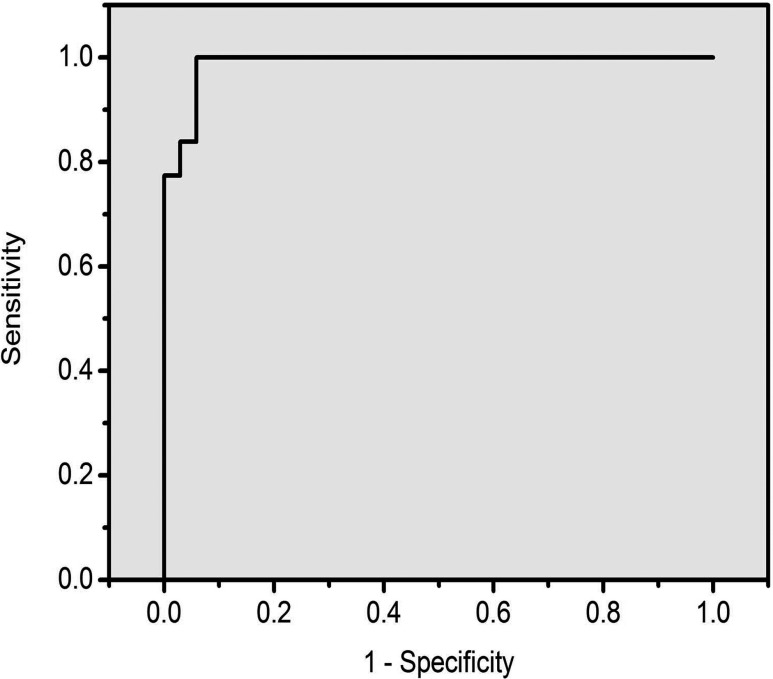
Multivariate analysis based on PCA and LDA was performed on all of the normalized SERS spectra. In this analysis, 31 serum RNA SERS spectra of gastric cancer were compared with 34 normal serum RNA SERS spectra. Independent-sample T-test on all the PC scores comparing normal and gastric cancer groups displayed that PC1, PC2, and PC3 were the most diagnostically significant (p < 0.01) for discriminating normal and gastric cancer groups. From the three-dimensional scatter plot of PC scores [Fig. 3a], we can clearly see that normal and gastric cancer groups are distributed in separate clusters, namely, the healthy control group forms one cluster and the gastric cancer group forms the other. Also as can be seen in the figure of LDA scores [Fig. 3b], a clear distinction can be made between normal and gastric cancer with few overlaps, except two outlier values from the normal group mixed with the cancer group, suggesting that the SERS spectra of the gastric cancer group can be differentiated from the healthy group via multivariate analysis method. The sensitivity of this technique for identifying gastric cancer from normal is calculated to be 100%, with specificity of 94.1%. The ROC curve was generated by varying the discrimination threshold levels. The ROC curve area can take on values between 0.0 and 1.0. And the closer the ROC curve area is to 1.0, the better the diagnostic test.20 The area under the ROC curve is 0.989 for normal versus gastric cancer groups (as shown in Fig. 4). These results demonstrate the potential of serum RNA SERS spectra for cancer detection and diagnosis with good sensitivity and specificity.
Figure 3.
(a) Principal component analysis of all serum RNA samples: a 3D mapping of the PCA result for gastric caner and healthy volunteer group. (b) LDA scores: gastric cancer versus healthy subject. The solid line represents the classification cut-value (y = 0.3130).
Figure 4.
The ROC curve of the discrimination result for using PCA-LDA-based SERS spectral classification with leave-one-out, cross validation method. The integrated area under the ROC curve was 0.989.
Independent-sample T-test on all the PC scores comparing stage I-II and stage III-IV showed that there were diagnostically significant PCs (p < 0.05) for discriminating the two groups (as shown in Fig. S3). Figure S4 in the supplementary material19 shows the ROC curve of the discrimination result. The integrated area under the ROC curve is 0.744. The results show that there were differences in samples derived from the different stages of cancer, indicating the potential correlation with cancer staging. Meanwhile, we compared the spectral differences between different ages in the cancerous group and normal group. The result showed no significant difference of RNA spectra between different age groups with the same pathology type (as shown in Figs. S5–S8 in the supplementary material19). However, the sample size is not big enough to analyze the correlation with every single cancer stages and age. We need to collect sufficient samples to validate the reliability of the correlations with cancer stages and age.
According to Forman et al., H. pylori infection may be an important cause of gastric cancer; between 35% and 55% of all cases may be associated with such an infection.21 Recently, Li et al.22 found that microRNA-222 (miR-222) was up-regulated in H. pylori-infected gastric mucosa and gastric cancer. Ectopic expression of miR-222 promoted cell proliferation and colony formation in vitro. Therefore, H. pylori may function as an initiator in the process of carcinogenesis by up-regulating miR-222, which further participates in the progression of cancer. In this study, the SERS spectra of the gastric cancer group can be differentiated from the healthy group, which may be partially attributed to the H. pylori infection of the cancer patients.
Gastric malignancies in gastrointestinal tract are the major causes of cancer-associated death in human.23 The patients with gastrointestinal cancers have poor survival rates mainly due to the advanced stages upon the initial time of diagnosis when cancer cells have metastasized into other parts of the body. So early diagnosis and localization of malignant lesions together with appropriate curative treatment is critical to reduce the mortality rates of the patients.2 Unfortunately, the existing conventional tumor markers, e.g., CEA and CA19-9 are not sensitive for early diagnosis of cancer. In this regard, SERS based serum RNA analysis combined with PCA and LDA nearly meet the desired criteria of an ideal screening tool such as sensitive and specific, fast and noninvasive, which can both prevent cancer progression and reduce cancer related mortality and healthcare cost.
CONCLUSIONS
To the best of our knowledge, this is the first report on employing serum RNA SERS for discriminating gastric cancer from normal. Here, we use MgSO4-aggregated Ag colloid as a SERS-active substrate for detection of serum RNA. PCA-LDA multivariate analysis of the SERS spectra revealed that gastric cancer can be differentiated from normal with good diagnostic sensitivity and specificity. The results of this preliminary study demonstrated the potential for developing SERS based serum RNA analysis into a clinical tool for noninvasive screening and diagnosis of cancer. Further work needs to be carried out for large-scale validation of the reliability of this new cancer detection method including other systematic cancers and precancer lesions, as well as H. pylori-infected gastritis and gastric cancer related analysis.
ACKNOWLEDGMENTS
The authors thank Longfeng Ke for excellent technical assistance, Zheng Lin for statistic analysis, Min-hua Hu for providing samples, Jing Wang, Yun Yu, and Zufang Huang for their support on this project and helpful comments on the manuscript. This work was supported by the National Natural Science Foundation of China (NNSFC) (Grant Nos. 11104030, 61178090, and 81101110), the program for Changjiang Scholars and Innovative Research Team in University (IRT1115), the Project of the Educational Office of Fujian Province (No. JA11055), and the Canadian Institutes of Health Research International Scientific Exchange Program.
References
- Dicken B. J., Bigam D. L., Cass C., Mackey J. R., Joy A. A., and Hamilton S. M., “Gastric adenocarcinoma: Review and considerations for future directions,” Ann. Surg. 241, 27–39 (2005). [DOI] [PMC free article] [PubMed] [Google Scholar]
- Lee K. S., Oh D. K., Han M. A., Lee H. Y., Jun J. K., Choi K. S., and Park E. C., “Gastric cancer screening in Korea: Report on the National Cancer Screening Program in 2008,” Cancer Res. Treat. 43, 83–88 (2011). 10.4143/crt.2011.43.2.83 [DOI] [PMC free article] [PubMed] [Google Scholar]
- Ahlquist D., “Molecular detection of colorectal neoplasia,” Gastroenterology 138, 2127–2139 (2010). 10.1053/j.gastro.2010.01.055 [DOI] [PubMed] [Google Scholar]
- Tie Y., Liu B., Fu H., and Zheng X., “Circulating miRNA and cancer diagnosis,” Sci. China, Ser. C: Life Sci. 52, 1117–1122 (2009). 10.1007/s11427-009-0158-5 [DOI] [PubMed] [Google Scholar]
- Mitchell P., Parkin R., Kroh E., Fritz B., Wyman S., Pogosova-Agadjanyan E., Peterson A., Noteboom J., O’Briant K., and Allen A., “Circulating microRNAs as stable blood-based markers for cancer detection,” Proc. Natl. Acad. Sci. 105, 10513–10518 (2008). 10.1073/pnas.0804549105 [DOI] [PMC free article] [PubMed] [Google Scholar]
- Driskell J., Seto A., Jones L., Jokela S., Dluhy R., Zhao Y., and Tripp R., “Rapid microRNA (miRNA) detection and classification via surface-enhanced Raman spectroscopy (SERS),” Biosen. Bioelectron. 24, 917–922 (2008). 10.1016/j.bios.2008.07.060 [DOI] [PubMed] [Google Scholar]
- Driskell J., Primera-Pedrozo O., Dluhy R., Zhao Y., and Tripp R., “Quantitative surface-enhanced raman spectroscopy based analysis of microRNA mixtures,” Appl. Spectrosc. 63, 1107–1114 (2009). 10.1366/000370209789553183 [DOI] [PubMed] [Google Scholar]
- Chen X., Ba Y., Ma L., Cai X., Yin Y., Wang K., Guo J., Zhang Y., Chen J., and Guo X., “Characterization of microRNAs in serum: A novel class of biomarkers for diagnosis of cancer and other diseases,” Cell Res. 18, 997–1006 (2008). 10.1038/cr.2008.282 [DOI] [PubMed] [Google Scholar]
- Lee P. and Meisel D., “Adsorption and surface-enhanced Raman of dyes on silver and gold sols,” J. Phys. Chem. 86, 3391–3395 (1982). 10.1021/j100214a025 [DOI] [Google Scholar]
- Zhao J., Lui H., McLean D., and Zeng H., “Automated autofluorescence background subtraction algorithm for biomedical Raman spectroscopy,” Appl. Spectrosc. 61, 1225–1232 (2007). 10.1366/000370207782597003 [DOI] [PubMed] [Google Scholar]
- Lasko T. A., Bhagwat J. G., Zou K. H., and Ohno-Machado L., “The use of receiver operating characteristic curves in biomedical informatics,” J. Biomed. Inf. 38, 404–415 (2005). 10.1016/j.jbi.2005.02.008 [DOI] [PubMed] [Google Scholar]
- Feng S., Lin J., Cheng M., Li Y., Chen G., Huang Z., Yu Y., Chen R., and Zeng H., “Gold nanoparticle based surface-enhanced Raman scattering spectroscopy of cancerous and normal nasopharyngeal tissues under near-infrared laser excitation,” Appl. Spectrosc. 63, 1089–1094 (2009). 10.1366/000370209789553291 [DOI] [PubMed] [Google Scholar]
- Feng S., Chen R., Lin J., Pan J., Chen G., Li Y., Cheng M., Huang Z., Chen J., and Zeng H., “Nasopharyngeal cancer detection based on blood plasma surface-enhanced Raman spectroscopy and multivariate analysis,” Biosen. Bioelectron. 25, 2414–2419 (2010). 10.1016/j.bios.2010.03.033 [DOI] [PubMed] [Google Scholar]
- Chan K. and Lo Y., “Circulating tumour-derived nucleic acids in cancer patients: Potential applications as tumour markers,” Br. J. Cancer 96, 681–685 (2007). 10.1038/sj.bjc.6603625 [DOI] [PMC free article] [PubMed] [Google Scholar]
- Movasaghi Z., Rehman S., and Rehman I., “Raman spectroscopy of biological tissues,” Appl. Spectrosc. Rev. 42, 493–541 (2007). 10.1080/05704920701551530 [DOI] [Google Scholar]
- Huser T., Orme C., Hollars C., Corzett M., and Balhorn R., “Raman spectroscopy of DNA packaging in individual human sperm cells distinguishes normal from abnormal cells,” J. Biophotonics 2, 322–332 (2009). 10.1002/jbio.200910012 [DOI] [PubMed] [Google Scholar]
- De Gelder J., De Gussem K., Vandenabeele P., and Moens L., “Reference database of Raman spectra of biological molecules,” J. Raman Spectrosc. 38, 1133–1147 (2007). 10.1002/jrs.1734 [DOI] [Google Scholar]
- Song M. Y., Pan K. F, Su H. J., Zhang L., Ma J. L., Li J. Y., Yuasa Y., Kang D., Kim Y. S., and You W. C., “Identification of serum MicroRNAs as novel non-invasive biomarkers for early detection of gastric cancer,” PLoS ONE 7, e33608 (2012). 10.1371/journal.pone.0033608 [DOI] [PMC free article] [PubMed] [Google Scholar]
- See supplementary material at http://dx.doi.org/10.1118/1.4747269 for preparation of silver colloid solutions, effect of the aggregating agent to the SERS signal of RNA and comparison of the SERS spectra between the different stage and age groups.
- Obuchowski N. A., Lieber M. L., and F. H.WiansJr., “ROC curves in clinical chemistry: uses, misuses, and possible solutions,” Clin. Chem. 50, 1118–1125 (2004). 10.1373/clinchem.2004.031823 [DOI] [PubMed] [Google Scholar]
- Forman D., Newell D., Fullerton F., Yarnell J., Stacey A., Wald N., and Sita F., “Association between infection with Helicobacter pylori and risk of gastric cancer: evidence from a prospective investigation,” Br. Med. J. 302, 1302–1305 (1991). 10.1136/bmj.302.6788.1302 [DOI] [PMC free article] [PubMed] [Google Scholar]
- Li N., Tang B., Zhu E. D, Li B. S, Zhuang Y., Yu S., Lu D. S, Zou Q. M., Xiao B., and Mao X. H., “Increased miR-222 in H. pylori-associated gastric cancer correlated with tumor progression by promoting cancer cell proliferation and targeting RECK,” FEBS Lett. 586, 722–728 (2012). 10.1016/j.febslet.2012.01.025 [DOI] [PubMed] [Google Scholar]
- Bergholt M. S., Zheng W., Lin K., Ho K. Y., Teh M., Yeoh K. G., So J. B. Y., and Huang Z., “Characterizing variability in vivo Raman spectra of different anatomical locations in the upper gastrointestinal tract toward cancer detection,” J. Biomed. Opt. 16, 037003 (2011). 10.1117/1.3556723 [DOI] [PubMed] [Google Scholar]


