Abstract
Ribavirin is frontline treatment for hepatitis C virus infection. To determine the role of nucleoside transporters in the intestinal absorption of orally administered ribavirin, we perfused the intestines of Ent1(−/−) and wild-type mice, in situ, with [3H] ribavirin (20, 200 and 5000 μM) in the presence and absence of sodium. The decrease in luminal ribavirin concentration over 30 minutes was measured at 5-minute intervals. Blood samples were collected approximately every 10 minutes. Ribavirin plus phosphorylated metabolite concentrations (hereafter referred to as ribavirin) were determined in tissue, blood and plasma by HPLC fractionation and scintillation counting. There was no significant difference between wild-type and Ent1(−/−) mice in intestinal loss of ribavirin at any ribavirin concentration studied. Perfusions without sodium drastically reduced the intestinal loss of ribavirin in both wild-type and Ent1(−/−) mice. After 20 μM ribavirin perfusions, Ent1(−/−) intestinal tissue contained 8-fold greater ribavirin than wild-type mice (p<0.01). Ribavirin concentrations in the wild-type intestinal tissue were 70-fold higher after 200 vs. 20 μM perfusions (p<0.001), indicating saturation of intestinal ribavirin efflux and possibly other processes as well. Ribavirin plasma concentrations were significantly higher in wild-type mice (2.7-fold) vs. Ent1(−/−) mice at 30 minutes after the 20 μM perfusion (p<0.01). These results suggest that, at lower intestinal concentrations of ribavirin, concentrative and equilibrative nucleoside transporters are important in the intestinal absorption of ribavirin. At higher intestinal concentrations, these transporters are saturated and other processes in the intestine (transport and/or metabolism) play an important role in the absorption of ribavirin.
Keywords: Ribavirin, nucleoside transporter, hepatitis C, absorption, perfusion
Introduction
Ribavirin (1-(β-D-Ribofuranosyl)-1H-1,2,4-triazole-3-carboxamide), in combination with pegylated interferon-α, is the frontline therapy for treating chronic hepatitis C virus (HCV) infection. The addition of ribavirin to interferon-based therapy increases the percentage of sustained viral responders from 23% to over 60% 1. However, the dose of ribavirin is limited by its hematological toxicity (hemolytic anemia). As a result, 10–14% of patients experiencing this toxicity require ribavirin dose reduction or cessation 2, thus preventing effective treatment of the disease.
Ribavirin is a prodrug which requires intracellular phosphorylation to be activated 3. Because ribavirin is hydrophilic (LogP ~ −2.0 to −2.5), it relies on nucleoside transporters to permeate cellular membranes 3–4. There are two families of nucleoside transporters, concentrative and sodium-dependent (CNTs) or equilibrative and sodium-independent (ENTs) 5. Of these nucleoside transporters, ribavirin is a substrate of ENT1 6, ENT2 7, the purine nucleoside selective transporter CNT2 8 and the broadly selective purine and pyrimidine nucleoside transporter, CNT3 9.
The standard ribavirin dose for the treatment of hepatitis C is 600 mg administered orally twice-daily. While ribavirin is well absorbed from the lumen of the intestine (<15% radioactive ribavirin excreted in feces) 10, the absolute bioavailability of orally administered ribavirin at this dose is highly variable, ranging from 33 to 64% 10–11. Although the ribavirin area under the plasma concentration time curve (AUC) increases linearly over the dose range 200–1200 mg/day, the maximum plasma concentration (Cmax) does not 10. These data suggest the rate of absorption of ribavirin from the intestine is saturable. We have previously reported that the Na+-dependent hCNT1 and 2, but not hCNT3, are expressed at the brush-border membranes of the enterocytes in the human small intestine 12 and that ribavirin is efficiently transported by the purine nucleoside transporter, hCNT2 8. In addition, the equilibrative nucleoside transporters are expressed in the human intestine, primarily hENT1 13, but their localization is concentrated in the crypt cells with minimal expression at brush border membranes of enterocytes 12–13, 14. Based on these data, we have hypothesized that both hCNT2 and hENT1 may be important in the oral absorption of ribavirin.
To test this hypothesis, we conducted a dose-ranging oral pharmacokinetic study of ribavirin in wild-type and Ent1(−/−) mice 15. When ribavirin was administered orally (in solution) to mice at increasing doses of 0.024, 0.244 and 6.1 mg/kg (as 20, 200 and 5000 μM solutions), the absolute bioavailability of ribavirin decreased from 96.5, to 31.5 and 25.0 % respectively. Furthermore, at the same doses, the absolute bioavailability of ribavirin in Ent1(−/−) mice is 27.3, 18.4 and 17.4 %. Based on these data we hypothesized that mouse Cnt2 on the apical membranes of the enterocytes mediates the transport of ribavirin into the enterocytes and that this transport is saturated as the ribavirin dose (concentration) is increased from 0.024 mg/kg (20 μM) to 6.1 mg/kg (5000 μM). Furthermore, we hypothesized that mEnt1 mediates the egress of ribavirin from the intestine into the blood and this egress is compromised in the Ent1 (−/−) mice. To test this hypothesis, we used the in situ closed-loop perfusion technique 16 to measure the intestinal absorption of ribavirin in Ent1(−/−) and wild-type mice under different experimental conditions.
Materials and Methods
Materials
Ribavirin, thymidine, formycin B, G-418 and 1x powder PBS were purchased from Sigma-Aldrich (St. Louis, MO). [3H]-Ribavirin (3.6 Ci/mmol), ribavirin monophosphate (RMP), ribavirin triphosphate (RTP) and [14C]-mannitol (53 mCi/mmol) were purchased from Moravek Biochemicals (Brea, CA). All other chemicals were of reagent or analytical grade and purchased through a commercial supplier. The Ent1(−/−) mice were provided by Dr. Robert O. Messing and Dr. Doo-Sup Choi of the Ernest Gallo Clinic and Research Center, Department of Neurology, University of California, San Francisco.
Mouse Husbandry
All animal procedures were reviewed and approved by the University of Washington Institutional Animal Care and Use Committee (IACUC). Ent1(+/+) and Ent1(−/−) mouse colonies were maintained as previously described 17.
Absorption Studies
In situ Intestinal Perfusion Technique in Wild-Type and Ent1(−/−) Mice
The closed loop in situ intestinal perfusion technique previously described in rats 16, 18 was slightly modified in this study for use in mice. Male and female mice (n=4 per genotype per treatment) weighing approximately 20–25 g were used in this study and were allowed access to food and water until 4 hours before surgery at which time only the food was removed. Each mouse was anesthetized with 2–3% isoflurane and kept on a heating pad for the duration of the study to maintain appropriate body temperature. The entire small intestine was isolated for this study, from approximately 1 cm distal to the stomach to 1–1.5 cm proximal to the caecum. The intestine was rinsed 5 times gently with PBS (or water in the case of perfusions lacking sodium) to remove debris. As much fluid as possible was removed from the intestine prior to beginning the study.
Ribavirin Perfusion Study
The perfusate solution contained 2 mL 20, 200, or 5000 μM ribavirin (corresponding to 0.4, 4.0 and 100 mg/kg, respectively), [3H]-ribavirin (0.188 μCi/mL), and a tracer concentration of [14C]-mannitol (0.1 μCi/mL) in either PBS or isotonic sodium-free transport buffer (20 mM Tris-HCl, 3 mM K2HPO4, 1 mM MgCl2•6H2O, 2 mM CaCl2, 5 mM glucose, 130 mM N-methyl-D-glucamine, pH 7.0). Mannitol was included as a non-absorbable marker of the integrity of the intestinal epithelium. The perfusion solution was allowed to reside in the isolated intestine for 5-minute intervals, at which time the entire solution was slowly flushed to one of the attached glass syringes and a 50-μL sample was removed. The solution was then flushed back into the intestine until the next 5-minute time-point and, alternating syringes, repeated until 30 minutes had elapsed. Each 50-μL sample was immediately divided into equal 25-μL aliquots and one of these was immediately frozen in liquid nitrogen for later HPLC analysis and the other stored on ice and analyzed for radioactivity via liquid scintillation counting within 2 hours. In addition, intestinal perfusions containing 20 μM ribavirin, [3H]-ribavirin (0.188 μCi/mL), and 250 μM thymidine or 500 μM formycin B were conducted in wild-type mice as inhibitors of mCnt1/3 and mCnt2/3, respectively. These concentrations of inhibitors were chosen based upon their affinity (and therefore their competitive inhibitory potential) for these specific transporters 13a, 19. Because no inhibition of ribavirin disappearance from the intestine was observed when co-perfused with thymidine, to observe the maximal possible inhibition during the formycin B perfusions, the intestine was pre-perfused with PBS containing 500 μM formycin B for 5 minutes.
Water Reabsorption Calculation
A previously described method 20 was used to calculate the extent of water absorption in mice at each of the sample times listed above. The fluid reabsorption from each animal was used to correct the sample concentration at each time point, Ce, as follows:
where C represents the concentration in the intestine that would exist in the absence of the water reabsorption process at time t, V0 is the initial volume, and Vt is the final volume measured in each animal.
Tissue and Blood Collection
At 13 minutes and 23 minutes after ribavirin was introduced into the intestine, blood samples were collected retro-orbitally with a heparinised capillary tube. At the end of the perfusion, at approximately 32 minutes, a blood sample (250 – 500 μL) was collected via cardiac puncture. After measuring the hematocrit, the whole blood, plasma and red blood cell fractions were stored at −80°C for HPLC analysis and for total radioactivity measurement via liquid scintillation counting. Immediately following the perfusion, the small intestine was removed and any remaining perfusate was collected into pre-weighed collection tubes to measure the final volume, assuming a perfusate density of 1g/mL. The removed small intestine was then opened lengthwise and rinsed with 20 mL of identical buffer solution used during the perfusion (without drug), and snap-frozen in liquid nitrogen.
Analysis of Total [3H]-Radioactivity in Perfusate, Plasma and Intestinal Tissue
Total [3H]-radioactivity concentrations (μCi/mL) were determined in plasma according to a previously described procedure 15. Twenty-five μL perfusate was aliquoted into 7 mL glass scintillation vials and 5 mL of scintillation fluid was added. To analyze intestinal tissue, 200 mg of frozen tissue was homogenized in 2 mL PBS. Two hundred μL of homogenate was aliquoted into a 10 mL glass liquid scintillation vial and incubated with Biosol (National Diagnostics, Atlanta, GA) according to the manufacturer’s instructions. Once completely dissolved, the samples were decolorized with 500 μL of 30% H2O2, agitated for 4 hours at 50°C on a plate shaker, and 9 mL of scintillation fluid was added to each sample. Total [3H]-radioactivity concentrations were determined in all of the above using liquid scintillation counting and the specific activity (Ci/mmol) of the perfused [3H]-ribavirin, assuming that 1 gram of intestinal tissue has a volume of 1 mL.
Sample Workup and HPLC Analysis to Determine Ribavirin Composition
The phosphorylated nucleotides [3H]-RMP and [3H]-RTP (Moravek Biochemicals, Brea, CA) exhibited spontaneous degradation to ribavirin in the presence of erythrocyte lysate and tissue homogenate. Pilot study data confirmed that RMP and RTP were not detected in the plasma at either 15 minutes or ~3 hours after intravenous dosing. Because of this, tissue samples containing ribavirin plus its nucleotides (RMP, RDP and RTP) were dephosphorylated to ribavirin as described previously 15. Therefore, all reference here to ribavirin tissue concentrations should be read as the concentrations of ribavirin plus its phosphorylated metabolites.
One hundred μL of homogenized tissue and 20 μL plasma were used for HPLC analysis (after dephosphorylation in the case of tissue). The protein in each sample was precipitated by the addition of 2 volumes of 6% perchloric acid (PCA) and vortexed 1 minute. The samples were neutralized by the addition of one-third volume 2 M K2HPO4, and then centrifuged at 20,000 g for 15 minutes at 4 °C. Twenty μL of the supernatant was added to a 7 mL scintillation vial and counted using scintillation counting to determine the percent radioactivity recovered after sample processing. Recovery of radioactivity by this method was >96% for all matrices analyzed. One hundred twenty μL of the supernatant was analyzed by HPLC using a method that resolved ribavirin from its non-phosphorylated metabolites (RTCOOH, TCONH2, TCOOH; kindly provided by Valeant Pharmaceuticals International), and the phosphorylated metabolites, RMP and RTP (Moravek Biochemicals, Brea, CA) 17. The radioactivity co-eluting at the retention time of the unlabeled ribavirin standard (as determined by UV detection) was expressed as a percentage of the total radioactivity injected to determine the percent ribavirin composition in the sample.
Perfusion Data Analysis
As described previously 21, the apparent first-order absorption rate constant, ka, was determined by non-linear regression analysis (WinNonLin™) of the concentration remaining in the lumen (corrected for water reabsorption as described above) (C) at each time point, t, in the following expression:
where C0 is the concentration at time = 5 minutes. In addition to this method, ka of ribavirin was also estimated based on the perfusion data using a 2-point, linear regression. There was no difference between the estimates of ka between the two methods. Only data from concentrations 5 minutes onwards were used to take into consideration slight dilution due to remaining solution in the intestine, non-specific binding and enterocyte loading 20a, 21–22. The effective apparent permeability (Peff) was used as an absorption index and was calculated for each of the test conditions using the following relationship:
where R is the radius of the intestine calculated from the initial volume of solution used during the perfusions and the average study length of the wild-type and Ent1(−/−) mouse intestines used in this study 20a, 23.
To estimate the saturable (Vmax, Km) and non-saturable (kd) loss of ribavirin from the intestine, the data from all of the intestinal perfusion experiments (i.e. at three different ribavirin concentrations) conducted in the presence of sodium were modelled simultaneously using the following expression in WinNonLin™ (Pharsight, Mountain View, CA):
where Vmax is the maximal rate of ribavirin disappearance, C is the concentration of ribavirin in the perfusion solution, Km is the concentration of ribavirin in the perfusion solution when half-maximal disappearance rate is observed, and kd is the diffusion rate constant. The data in the absence of sodium were also included, but in this case the saturable component was set to zero.
Construction of MDCK cells expressing recombinant mCnt2
The mouse transporter mCnt2 was expressed in MDCK cells using the retroviral pLNCX2 vector and restriction sites SalI and HindIII. Briefly, mCnt2, was first cloned from the pcDNA3.1 vector (Invitrogen Corporation, Carlsbad, CA), followed by subcloning into the pLNCX2 vector, amplified in competent E. coli bacteria, and purified using a QIAprep Spin Miniprep plasmid isolation kit (Qiagen Inc., Valencia, CA). Then, MDCK cells were transfected with mCnt2 using the Phoenix amphotropic retroviral packaging cell line (Orbigen, Inc., San Diego, CA) and FuGene 6 (Roche Applied Science, Mannheim, Germany) following the manufacturer’s instructions. The resulting infected MDCK cells, expressing the mCnt2-LNCX2 plasmid, were selected and maintained in the presence of G-418 (400 μg/mL).
Ribavirin Transport Kinetics in mCnt2 Over-Expressing MDCK Cells
The kinetics of ribavirin transport by mCnt2-MDCK cells was measured as follows. Cells were pre-incubated for 10 minutes at 37 °C with the transport buffer (Tris-HCl 20 mM, K2HPO4 3 mM, MgCl2-6H2O 1 mM, CaCl2 2 mM, glucose 5 mM, NaCl 130 mM, pH 7.4). Then, the cells were incubated for 1 min. with fresh transport buffer (500 μL) containing 270 nmoles [3H]-ribavirin plus unlabeled ribavirin ranging in concentration from 0.001 to 4.0 mM. Transport was terminated with the addition (1 mL) and subsequent washes (500 μL) with ice-cold sodium-free transport buffer. The kinetic parameters Km, kd and Vmax were determined by non-linear regression analysis (WinNonLin™) of the transport rates in the presence of increasing unlabeled substrate by fitting the following model to the data 24:
Where v* is the velocity of transport of the labeled substrate, Scold is the concentration of the unlabeled substrate, T is the concentration of the labeled substrate, and Vmax, Km and kd (diffusion rate constant) are the transport parameters. The mean and standard deviations were determined from three independent experiments.
Statistical analysis
All the data were analyzed using ANOVA followed by the students t-test (paired or unpaired) or by the latter. P<0.05 was considered statistically significant.
Results
In situ Intestinal Perfusions
Concentration and Sodium Dependency of Ribavirin Intestinal Permeability
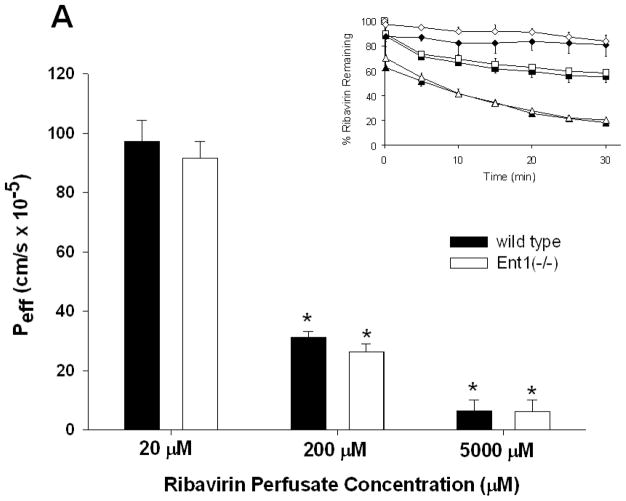
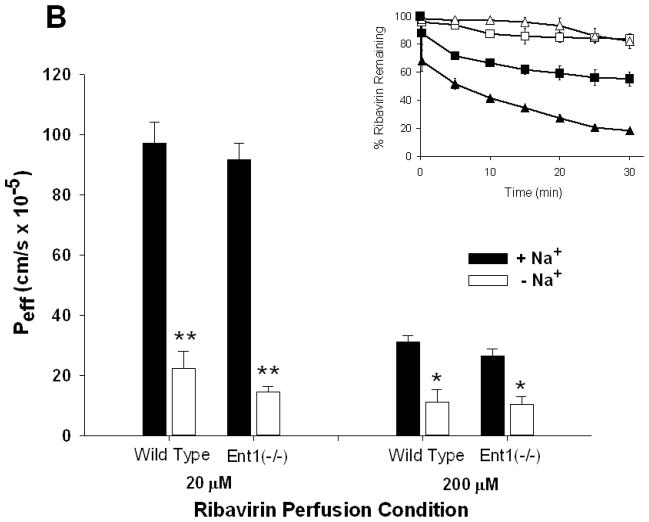
As the ribavirin intestinal perfusion concentration increased from 20 to 5000 μM, the intestinal permeability (Peff) of ribavirin in wild-type and Ent1(−/−) mice decreased significantly (15.3-fold higher in wild-type vs. Ent1(−/−) mice (p<0.01), Figure 1A) indicating the decrease in luminal ribavirin concentration was saturable. Peff was not significantly different between wild-type and Ent1(−/−) mice at all ribavirin intestinal perfusate concentrations. However, during the 20 μM and 200 μM ribavirin perfusions, the removal of sodium from the perfusate solution resulted in a substantial decrease in Peff (~4- and ~3-fold decreases, respectively (p<0.01) in wild-type and Ent1(−/−) mice Figure 1B). In the absence of sodium, despite the large reduction in Peff in the wild-type mice, ribavirin’s Peff at 20 μM perfusate concentration (2.24 ± 0.56 × 10⁻⁵ cm/s) remained significantly greater than ribavirin’s Peff at 5000 μM perfusate concentration in the presence of sodium (0.64 ± 0.38 × 10⁻⁵cm/s; p<0.05) when presumably ribavirin transport was saturated. Similar results were obtained when the apparent clearance associated with the loss of ribavirin from the intestine was computed. Ribavirin was stable in the perfusate through the duration of the experiment with no degradation products or metabolites detected. The concentration of [14C]-mannitol in the perfusion solution did not significantly change during any of the 30-minute perfusions, nor was there any detectable [14C]-radioactivity in tissue or blood samples (data not shown).
Figure 1.
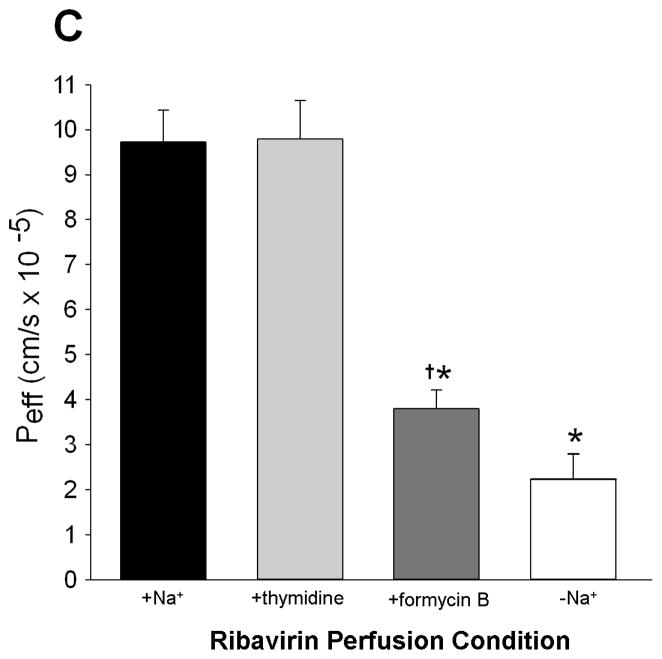
The effective ribavirin intestinal permeability (Peff) in wild-type mice was not significantly different than in Ent1(−/−) mice, in the presence of sodium, after 30 minutes of 20, 200 or 5000 μM ribavirin intestinal perfusions (A). In contrast, ribavirin’s Peff in wild-type and Ent1(−/−) mice was significantly reduced in the absence of sodium (B). Ribavirin’s Peff after 20 μM perfusions was unaffected by 250 μM thymidine, a Cnt3 inhibitor, but was significantly reduced by 500 μM formycin B, a Cnt2 inhibitor (C). The inset graphs in 1A and 1B display the % ribavirin remaining in the intestinal lumen of mice during 20 μM (triangles), 200 μM (squares) and 5000 μM (diamonds, 1A only) perfusions displayed by the main graph. In 1A, **= p<0.01, compared to higher concentrations. In 1B **= p<0.01, *= p<0.05 compared to same concentration in absence of sodium. In 1C *= p<0.05 compared to +Na+; †= p<0.05 compared to –Na+. N=4 for all treatments. Error bars indicate standard deviations in all panels.
In the presence of 500 μM formycin B (a Cnt2/3 inhibitor), ribavirin Peff during 20 μM intestinal perfusions of wild-type mice was significantly lower (3.79 ± 0.42 × 10⁻⁵cm/s) than in the absence of formycin B (9.73 ± 0.71 × 10⁻⁵ cm/s (p<0.05); Figure 1C). In contrast, in the presence of 250 μM thymidine (a Cnt1/3 inhibitor), the ribavirin Peff during 20 μM intestinal perfusions of wild-type mice was not significantly different (9.79 ± 0.86 × 10⁻⁵ cm/s) from that in the absence of thymidine. The concentration of thymidine in the perfusion at 30 minutes was 161.88 ± 9.97 μM, indicating that it was not substantially depleted during this period.
Kinetic Analysis of in vivo and in vitro Experiments
Analysis of the kinetics of intestinal decease of [3H]-ribavirin showed that the Km, Vmax and kd of this process were 44.5 ± 7.6 μM, 3.27 ± 0.51 pmol•ml−1•min−1 and 0.0025 ± 0.0016 min−1, respectively. In vitro, in MDCK cells over-expressing mCnt2, the Km, Vmax and kd of ribavirin transport were estimated as 29.2 ± 2.9 μM, 3137.7 ± 293.9 pmol•mg−1 •min−1 and 21578 ± 1334 pmol•mg−1•min−1•nM−1 respectively.
Accumulation of Ribavirin in Intestinal Tissue
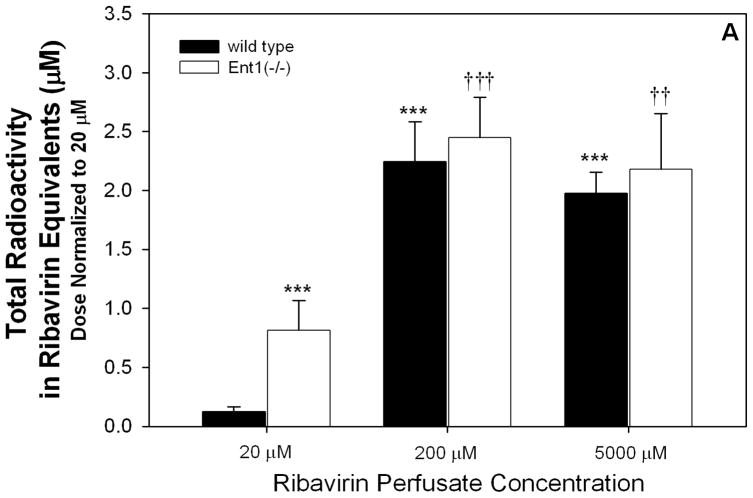
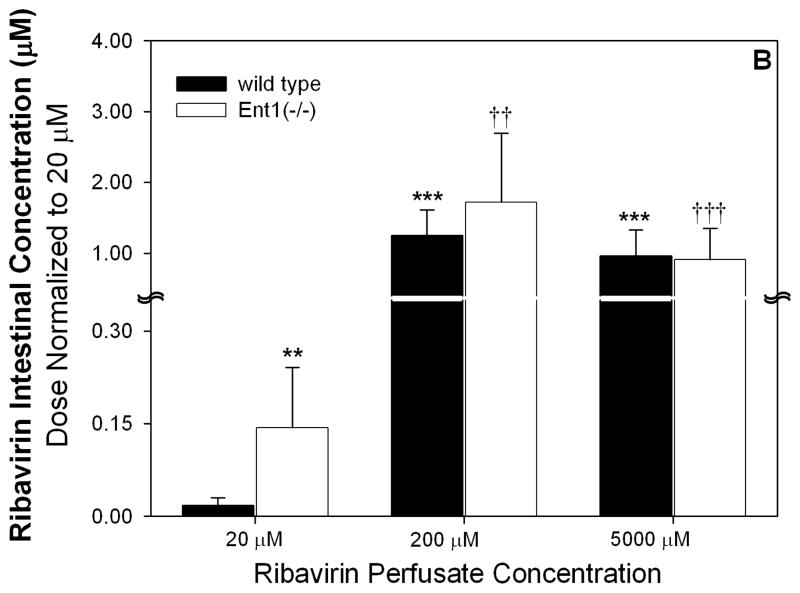
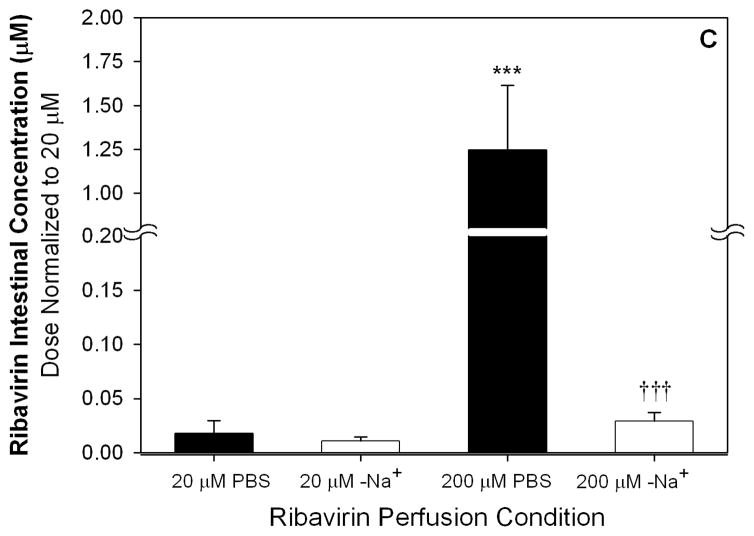
After 20 μM ribavirin perfusions, the dose-normalized intestinal tissue total radioactivity was significantly greater (6.6-fold) in Ent1(−/−) mice than in the wild-type mice (p<0.001, Figure 2A). This difference was absent after perfusions with 200 or 5000 μM ribavirin. Compared to the 20 μM perfusions, the 200 and 5000 μM perfusions (dose normalized) resulted in 18.2- (p<0.001) and 16.0-fold greater (p<0.001) total radioactivity in the intestinal tissue of wild-type mice and 3.0- (p<0.001) and 2.7-fold greater (p<0.01) total radioactivity in the intestinal tissue of Ent1(−/−) mice, respectively. After 20 μM ribavirin perfusions, the dose-normalized intestinal tissue accumulation of ribavirin (plus phosphorylated metabolites) was significantly greater (8-fold) in the Ent1(−/−) mice than in the wild-type mice (p<0.01, Figure 2B). In contrast, this difference was absent after perfusions with 200 or 5000 μM ribavirin. After the 200 μM perfusions, ribavirin’s accumulation in wild-type and Ent1(−/−) mice intestinal tissue increased more than proportionally (wild-type: ~700- and ~13511-fold; Ent1(−/−): ~120- and ~1584-fold) to that observed after the 20 μM perfusion. Moreover, dose-normalized intestinal tissue accumulation of ribavirin in wild-type mice after 200 and 5000 μM ribavirin perfusions was significantly greater (70.1- and 66.2-fold, p<0.001) than the accumulation after perfusions with 20 μM ribavirin. The ratio of intestinal tissue total radioactivity to radioactivity attributable to ribavirin and its phosphorylated metabolites decreased as the perfusate concentration increased (Table 1). During the 200 μM ribavirin perfusions, the intestinal tissue accumulation of ribavirin was significantly reduced in the absence of sodium (Figure 2B, p<0.001). In contrast, there was no significant difference in ribavirin intestinal tissue accumulation after 20 μM ribavirin perfusions in wild-type mice in the presence or absence of sodium.
Figure 2.
Dose-normalized intestinal total radioactivity concentrations at 30 minutes after 200 and 5000 μM ribavirin intestinal perfusions in wild-type and Ent1(−/−) mice in the presence of sodium were significantly greater than after 20 μM perfusions (A). The same trend was observed for intestinal ribavirin plus phosphorylated metabolites concentration, but the fold-change was greater between 200 and 5000 vs. 20 μM perfusions (B). In contrast to the perfusions in the presence of sodium, in the absence of sodium, the intestinal ribavirin concentration after 200 μM perfusions was considerably reduced (C). In 2A and 2B, ***= p<0.001, **=p<0.01 compared to 20 μM wild-type; †††= p<0.001, ††= p<0.01 compared to 20 μM Ent1(−/−). In 2C, ***= p<0.001 compared to all others; †††= p<0.001 compared to 20 μM in absence of sodium. N=4 for all treatments. Error bars indicate standard deviations in all panels.
Table 1.
Intestinal total [3H]-radioactivity, radioactivity attributed to ribavirin plus its phosphorylated metabolites, or the ratio of these values in wild type and Ent1(−/−) mice after 30 minute intestinal perfusions with ribavirin at the concentrations listed.
| Total Radioactivity (Ribavirin Equivalents, μM)
|
Ribavirin + Phosphorylated Metabolites, μM
|
Total Radioactivity
|
||||
|---|---|---|---|---|---|---|
| RBV+Phosphorylated Metabolites | ||||||
| Perfusate Conc. (μM) | Wild Type | Ent1(−/−) | Wild Type | Ent1(−/−) | Wild Type | Ent1(−/−) |
| 20 | 0.12 ± 0.04 | 0.81 ± 0.25*** | 0.02 ± 0.01 | 0.14 ± 0.10*** | 6.00 ± 3.83 | 5.79 ± 1.55 |
| 200 | 22.50 ± 0.34*** | 24.50 ± 0.34††† | 12.50 ± 3.7*** | 17.20 ± 9.8††† | 1.79 ± 0.81* | 1.42 ± 0.99† |
| 5000 | 495.00 ± 0.18*** | 545.00± 0.47††† | 240.00 ± 92.5*** | 227.50 ± 112.5†† | 2.06 ± 1.30* | 2.40 ± 1.36 |
Values = mean ± standard deviation from 4 independent experiments. Significant differences are for dose-normalized comparisons.
p<0.001,
p<0.01,
p<0.05 compared to wild type 20 μM
p<0.001,
p<0.01,
p<0.05 compared to wild type 20 μM
Ribavirin Plasma Concentrations
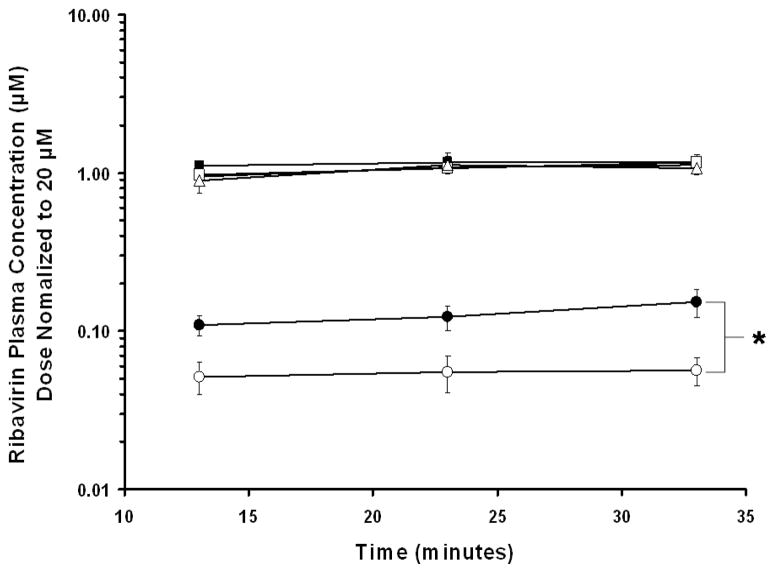
Compared to the plasma concentrations after the 20 μM perfusions, the absolute plasma ribavirin concentrations increased 73- and 1925-fold in wild-type mice and 190- and 5160-fold in Ent1(−/−) mice after the 200 and 5000 μM perfusions, respectively. In the presence of sodium, after 20 μM ribavirin perfusions, wild-type mice had higher concentrations of ribavirin in their plasma than did Ent1(−/−) mice at all time points studied (Figure 3). The difference was greatest at the end of the 30 minute perfusion, when the wild-type mice had approximately 3-fold higher ribavirin concentrations in plasma than Ent1(−/−) mice (p<0.05). After 20 μM sodium-free ribavirin perfusions, ribavirin plasma concentrations were below the limit of detection in both wild-type and Ent1(−/−) mice. After 200 or 5000 μM ribavirin perfusions (in the presence or absence of sodium), there was no statistically significant difference in dose-normalized ribavirin plasma concentration between wild-type and Ent1(−/−) mice.
Figure 3.
Dose-normalized plasma ribavirin concentrations after 20 μM (●) ribavirin intestinal perfusions in wild-type mice (filled symbols) were significantly greater than in Ent1(−/−) mice (open symbols) at 33 minutes, but there was no significant difference after 200 (▲)or 5000 (■) μM perfusions. *= p<0.05 20 μM wild-type compared to 20 μM Ent1(−/−). N=4 for all treatments. Error bars indicate standard deviations in all panels.
Discussion
The intestinal permeability (Peff) of ribavirin was unaffected by the absence of mEnt1 at any of the ribavirin perfusate concentrations examined (Figure 1A), indicating that mEnt1 does not mediate the absorption of ribavirin from the intestinal lumen in mice. In contrast, the large reduction of ribavirin transport in the absence of sodium as well as the saturability of the process with increasing ribavirin perfusate concentration indicate that the absorption of ribavirin from the intestinal lumen in mice is an active, sodium-dependent process, most likely mediated by the concentrative nucleoside transporters (Cnts) (Fig. 1A). The data obtained after co-perfusion with 500 μM formycin B (Cnt2 inhibitor) or 250 μM thymidine (Cnt3 inhibitor) confirmed that this transport was dominated by mCnt2 (Figure 1C). The Ki value of formycin B for hCNT2 is ~200 μM 19. Assuming competitive inhibition, we would expect 64% inhibition of mCnt2 by formycin B at 500 μM - we obtained 61% inhibition. The dominant role of mCnt2 is supported by the similarity in the Km of ribavirin loss from the intestinal lumen (44.5 ± 7.6 μM) with the in vitro Km of ribavirin uptake into MDCK cells over-expressing mCnt2 (29.2 ± 2.9 μM).
Although others have suggested that Ent1 may contribute to the uptake of nucleosides across the enterocyte brush border membrane 25, we found no such involvement of mEnt1 in the absorption of ribavirin into the enterocytes in the mouse (Figures 1A and 1B). This observation is consistent with our functional and expression data where we found minimal hENT1 activity/expression at the brush border membrane of the human enterocytes 12–13, 14, but found high expression at the membranes of the crypt cells 26 and lesser expression at the basolateral membrane of the enterocytes. Our results demonstrate that mEnt1 does not play a role in the absorption of ribavirin into the enterocytes, therefore Ent1 expression in the enterocytes is either minimal or basolateral. If the same holds true in humans, this differential localization of hCNT2 on the brush border membrane of the enterocytes and hENT1 on the basolateral membrane of the enterocytes and the crypt cells suggest that these nucleoside transporters work in tandem to vectorially transport substrates from the lumen of the intestine into the mesenteric circulation. We tested this hypothesis by analyzing the ribavirin concentration in the intestinal tissue from wild-type and Ent1(−/−) mice after each of the ribavirin perfusions. Consistent with our hypothesis, after the 20 μM ribavirin perfusion, there was significantly greater accumulation (8.0-fold) of ribavirin in the intestinal tissue of Ent1(−/−) mice than in wild-type mice (Figure 2A). That is, when mEnt1 was absent in the intestine, ribavirin’s vectorial transport into the mesenteric circulation was compromised.
Surprisingly, the difference in intestinal accumulation of ribavirin between wild-type and Ent1(−/−) after 20 μM perfusions disappeared after the 200 and 5000 μM ribavirin perfusions. After the 200 μM perfusions, ribavirin’s accumulation in the wild-type and Ent1(−/−) mice intestine increased more than proportionally compared to that observed after the 20 μM perfusion (Figure 2A; note that the values plotted are dose-normalized to 20 μM perfusions). This increase is surprising because if mEnt1 transport was the rate-limiting step in the egress of ribavirin from the intestinal tissue, the dose-normalized intestinal tissue ribavirin concentration in the Ent1(−/−) mice should not have increased with increasing ribavirin perfusate concentration. In addition, in the wild-type mice, when the intestinal ribavirin perfusate concentration was increased, the intestinal ribavirin tissue concentration should have increased until ribavirin’s mEnt1-mediated egress from the intestine was saturated. Consequently, the dose-normalized accumulation of ribavirin in the intestinal tissue of wild-type mice, at the 200 and 5000 μM intestinal perfusate concentrations, should not exceed that in the Ent1(−/−) mice at 20 μM. The fact that it did suggests the presence of additional processes involved in the elimination of ribavirin from the intestinal tissue, which are saturated as the perfusate ribavirin concentration was increased from 20 to 200 μM and 5000 μM. This conclusion is supported upon examination of the total radioactivity accumulated in the intestinal tissue (Figure 2B). In both Ent1(−/−) and wild-type mice, the ratio of total intestinal radioactivity to radioactivity attributable to ribavirin (plus phosphorylated metabolites) decreased as the perfusate concentration increased (Table 1). This indicates that non-phosphorylation metabolism of ribavirin (e.g. deribosylation) was most likely saturated. However, simultaneous saturation of transporters other than mEnt1 (e.g. nucleobase transporters or perhaps MRP727) cannot be discounted. At the higher perfusate ribavirin concentrations (200 and 5000 μM), the intestinal tissue concentrations of ribavirin increased in proportion to the dose (i.e. they are not significantly different when dose normalized). These data suggest that during 200 and 5000 μM perfusions, although the ribavirin concentrations were above the Km for mCnt2 and most likely saturating, the remaining concentrative transport plus diffusion into the enterocytes was of such magnitude that all processes responsible for egress (including mEnt1) or metabolism (other than phosphorylation) of ribavirin were saturated and ribavirin egress from the intestine became a diffusion-limited process. At first sight, saturation of mEnt1 does not appear to be consistent with the concentrations of ribavirin observed in the intestinal tissue (~10 – 250 μM), which is lower than the Km of ribavirin transport by mEnt1 (~321 μM) 17. However, it is important to note that the measured ribavirin concentration was that in the entire intestine rather than only where mEnt1 is expressed. Therefore, the ribavirin concentrations within the regions expressing mEnt1 may have been much greater than the Km of ribavirin transport by mEnt1.
Consistent with the egress of ribavirin from the intestine being rate-limited by mEnt1 after the 20 μM ribavirin perfusions, the dose-normalized ribavirin plasma concentrations (at 33 minutes) in wild-type mice were 3-fold greater than in the Ent1(−/−) mice (Figure 3). At first sight, the greater than proportional increase in absolute plasma ribavirin concentrations in wild-type and Ent1(−/−) mice after the 200 and 5000 μM perfusions compared to the 20 μM perfusions appears contradictory to our conclusion that egress from the intestine is rate-limiting at the 20 μM perfusate concentrations. However, these data can potentially be explained by saturable first-pass hepatic extraction during the 200 and 5000 μM ribavirin perfusions, which we have demonstrated28.
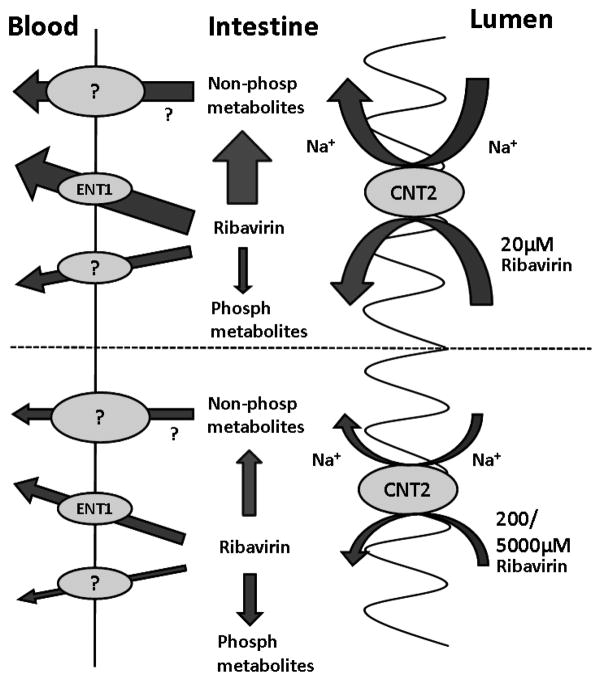
In summary, we have presented an in situ perfusion study in wild-type and Ent1(−/−) mice which allowed us to elucidate the contribution of the nucleoside transporters to the intestinal absorption of ribavirin. The perfusion data presented here show that ribavirin’s bioavailability after oral administration to mice is rate-limited by several processes represented in Figure 4. First, the absorption of ribavirin into the enterocytes from the intestine lumen is a saturable, sodium-dependent process, largely mediated by mCnt2. However, once in the enterocytes, the vectorial transport of ribavirin into the mesenteric blood is mediated by mEnt1 plus other unknown processes (metabolism and transport) which are also saturable. These observations in mice are largely consistent with observations made (where possible) in humans and suggest that a more optimal dosing strategy for ribavirin should be considered which takes these complex intestinal transport processes into consideration. Since the liver is the target of ribavirin therapy it is important to determine the in vivo role of nucleoside transporters in the hepatic distribution of ribavirin. In vitro studies in our laboratory with human hepatocytes suggest that hENT1 plays a dominant role in the hepatic distribution of ribavirin 26. However, studies need to be conducted in vivo, in both Ent1(−/−) mice as well as in humans, to gain a better understanding of factors that govern the in vivo bioavailability (intestinal absorption and hepatic bioavailability) of ribavirin. Such studies could help guide development of therapeutic strategies that maximize the efficacy and reduce the toxicity of ribavirin in patients with hepatitis C virus infection.
Figure 4.
A graphical illustration describing the proposed mechanisms of intestinal absorption of 20 or 200 and 5000 μM ribavirin in mice. The absorption of ribavirin into the enterocytes from the intestinal lumen is a saturable, sodium-dependent process, largely mediated by mCnt2. Once in the enterocytes, the vectorial transport of ribavirin into the mesenteric blood is mediated by mEnt1 plus other unknown transport processes which are also saturable. In addition, phosphorylation as well as non-phosphorylation metabolism are saturable elimination processes that influence the intestinal bioavailability and portal concentrations of ribavirin or its metabolites. The size of the arrows show the relative magnitude of the pathways.
Acknowledgments
This work was supported by National Institute of Health [Grants GM54447 (to J.D.U.), and AA015164 (to D.-S. C)], and in part by the Eli Lilly Foundation (to A.M.M.). A portion of the perfusion work was performed by A.M.M. at Amgen, Inc., Seattle, Washington during an internship. We thank Zufei Zhang for assistance in drawing Fig 4.
List of nonstandard abbreviations
- AK
Adenosine Kinase
- AUC
Area Under the Curve
- CNT
Concentrative nucleoside transporter
- EDTA
ethylene diamine tetraacetic acid
- ENT
Equilibrative nucleoside transporter
- hCNT
Human Concentrative Nucleoside Transporter
- hENT
Human Equilibrative Nucleoside Transporter
- HPLC
High Performance Liquid Chromatography
- mCnt
Mouse Concentrative Nucleoside Transporter
- MDCK
Madin-Darby canine kidney
- MEM
Minimal Essential Media
- mEnt
Mouse Equilibrative Nucleoside Transporter
- NBMPR
nitro-benzyl-mercapto-purine-riboside
- PBS
Phosphate Buffered Saline
- RMP
ribavirin monophosphate
- RTCOOH
1-β-D-ribofuranosyl-1,2,4-triazole-3-carboxylic acid
- RTP
ribavirin triphosphate TCONH2, 1,2,4-triazole-3-carboxamide
- TCOOH
1,2,4-triazole-3-carboxylic acid
References
- 1.(a) Keeffe EB. Chronic hepatitis C: management of treatment failures. Clin Gastroenterol Hepatol. 2005;3(10 Suppl 2):S102–5. doi: 10.1016/s1542-3565(05)00698-1. [DOI] [PubMed] [Google Scholar]; (b) Russo MW, Fried MW. Side effects of therapy for chronic hepatitis C. Gastroenterology. 2003;124(6):1711–9. doi: 10.1016/s0016-5085(03)00394-9. [DOI] [PubMed] [Google Scholar]; (c) Fried MW, Hadziyannis SJ. Treatment of chronic hepatitis C infection with peginterferons plus ribavirin. Semin Liver Dis. 2004;24(Suppl 2):47–54. doi: 10.1055/s-2004-832928. [DOI] [PubMed] [Google Scholar]
- 2.(a) Fried MW. Side effects of therapy of hepatitis C and their management. Hepatology. 2002;36(5 Suppl 1):S237–44. doi: 10.1053/jhep.2002.36810. [DOI] [PubMed] [Google Scholar]; (b) Rendon AL, Nunez M, Romero M, Barreiro P, Martin-Carbonero L, Garcia-Samaniego J, Jimenez-Nacher I, Gonzalez-Lahoz J, Soriano V. Early monitoring of ribavirin plasma concentrations may predict anemia and early virologic response in HIV/hepatitis C virus-coinfected patients. J Acquir Immune Defic Syndr. 2005;39(4):401–5. doi: 10.1097/01.qai.0000170034.90438.68. [DOI] [PubMed] [Google Scholar]
- 3.Parker WB. Metabolism and antiviral activity of ribavirin. Virus Res. 2005;107(2):165–71. doi: 10.1016/j.virusres.2004.11.006. [DOI] [PubMed] [Google Scholar]
- 4.(a) Russmann S, Grattagliano I, Portincasa P, Palmieri VO, Palasciano G. Ribavirin-induced anemia: mechanisms, risk factors and related targets for future research. Curr Med Chem. 2006;13(27):3351–7. doi: 10.2174/092986706778773059. [DOI] [PubMed] [Google Scholar]; (b) Winiwarter S, Bonham NM, Ax F, Hallberg A, Lennernas H, Karlen A. Correlation of human jejunal permeability (in vivo) of drugs with experimentally and theoretically derived parameters. A multivariate data analysis approach. J Med Chem. 1998;41(25):4939–49. doi: 10.1021/jm9810102. [DOI] [PubMed] [Google Scholar]
- 5.Kong W, Engel K, Wang J. Mammalian nucleoside transporters. Curr Drug Metab. 2004;5(1):63–84. doi: 10.2174/1389200043489162. [DOI] [PubMed] [Google Scholar]
- 6.Jarvis SM, Thorn JA, Glue P. Ribavirin uptake by human erythrocytes and the involvement of nitrobenzylthioinosine-sensitive (es)-nucleoside transporters. Br J Pharmacol. 1998;123(8):1587–92. doi: 10.1038/sj.bjp.0701775. [DOI] [PMC free article] [PubMed] [Google Scholar]
- 7.Yamamoto T, Kuniki K, Takekuma Y, Hirano T, Iseki K, Sugawara M. Ribavirin uptake by cultured human choriocarcinoma (BeWo) cells and Xenopus laevis oocytes expressing recombinant plasma membrane human nucleoside transporters. Eur J Pharmacol. 2007;557(1):1–8. doi: 10.1016/j.ejphar.2006.10.062. [DOI] [PubMed] [Google Scholar]
- 8.Patil SD, Ngo LY, Glue P, Unadkat JD. Intestinal absorption of ribavirin is preferentially mediated by the Na+-nucleoside purine (N1) transporter. Pharm Res. 1998;15(6):950–2. doi: 10.1023/a:1011945103455. [DOI] [PubMed] [Google Scholar]
- 9.Hu H, Endres CJ, Chang C, Umapathy NS, Lee EW, Fei YJ, Itagaki S, Swaan PW, Ganapathy V, Unadkat JD. Electrophysiological characterization and modeling of the structure activity relationship of the human concentrative nucleoside transporter 3 (hCNT3) Mol Pharmacol. 2006;69(5):1542–53. doi: 10.1124/mol.105.018945. [DOI] [PubMed] [Google Scholar]
- 10.Glue P. The clinical pharmacology of ribavirin. Semin Liver Dis. 1999;19(Suppl 1):17–24. [PubMed] [Google Scholar]
- 11.(a) Connor E, Morrison S, Lane J, Oleske J, Sonke RL, Connor J. Safety, tolerance, and pharmacokinetics of systemic ribavirin in children with human immunodeficiency virus infection. Antimicrob Agents Chemother. 1993;37(3):532–9. doi: 10.1128/aac.37.3.532. [DOI] [PMC free article] [PubMed] [Google Scholar]; (b) Paroni R, Del Puppo M, Borghi C, Sirtori CR, Galli Kienle M. Pharmacokinetics of ribavirin and urinary excretion of the major metabolite 1,2,4-triazole-3-carboxamide in normal volunteers. Int J Clin Pharmacol Ther Toxicol. 1989;27(6):302–7. [PubMed] [Google Scholar]; (c) Preston SL, Drusano GL, Glue P, Nash J, Gupta SK, McNamara P. Pharmacokinetics and absolute bioavailability of ribavirin in healthy volunteers as determined by stable-isotope methodology. Antimicrob Agents Chemother. 1999;43(10):2451–6. doi: 10.1128/aac.43.10.2451. [DOI] [PMC free article] [PubMed] [Google Scholar]
- 12.(a) Patil SD, Unadkat JD. Sodium-dependent nucleoside transport in the human intestinal brush-border membrane. Am J Physiol. 1997;272(6 Pt 1):G1314–20. doi: 10.1152/ajpgi.1997.272.6.G1314. [DOI] [PubMed] [Google Scholar]; (b) Govindarajan R, Bakken AH, Hudkins KL, Lai Y, Casado FJ, Pastor-Anglada M, Tse CM, Hayashi J, Unadkat JD. In situ hybridization and immunolocalization of concentrative and equilibrative nucleoside transporters in the human intestine, liver, kidneys, and placenta. Am J Physiol Regul Integr Comp Physiol. 2007;293(5):R1809–22. doi: 10.1152/ajpregu.00293.2007. [DOI] [PubMed] [Google Scholar]
- 13.(a) Chandrasena G, Giltay R, Patil SD, Bakken A, Unadkat JD. Functional expression of human intestinal Na+-dependent and Na+-independent nucleoside transporters in Xenopus laevis oocytes. Biochem Pharmacol. 1997;53(12):1909–18. doi: 10.1016/s0006-2952(97)00170-6. [DOI] [PubMed] [Google Scholar]; (b) Kim HR, Park SW, Cho HJ, Chae KA, Sung JM, Kim JS, Landowski CP, Sun D, Abd El-Aty AM, Amidon GL, Shin HC. Comparative gene expression profiles of intestinal transporters in mice, rats and humans. Pharmacol Res. 2007;56(3):224–36. doi: 10.1016/j.phrs.2007.06.005. [DOI] [PubMed] [Google Scholar]
- 14.Lum PY, Ngo LY, Bakken AH, Unadkat JD. Human intestinal es nucleoside transporter: molecular characterization and nucleoside inhibitory profiles. Cancer Chemother Pharmacol. 2000;45(4):273–8. doi: 10.1007/s002800050040. [DOI] [PubMed] [Google Scholar]
- 15.Endres CJ, Moss AM, Govindarajan R, Choi DS, Unadkat JD. The Role of Nucleoside Transporters in the Erythrocyte Disposition and Oral Absorption of Ribavirin in the Wild-Type and Equilibrative Nucleoside Transporter 1 (−/−) Mice. J Pharmacol Exp Ther. 2009 doi: 10.1124/jpet.109.153130. [DOI] [PMC free article] [PubMed] [Google Scholar]
- 16.Doluisio JT, Billups NF, Dittert LW, Sugita ET, Swintosky JV. Drug absorption. I. An in situ rat gut technique yielding realistic absorption rates. J Pharm Sci. 1969;58(10):1196–200. doi: 10.1002/jps.2600581006. [DOI] [PubMed] [Google Scholar]
- 17.Endres CJ, Moss AM, Ke B, Govindarajan R, Choi DS, Messing RO, Unadkat JD. The role of the equilibrative nucleoside transporter 1 (ENT1) in transport and metabolism of ribavirin by human and wild-type or Ent1−/− mouse erythrocytes. J Pharmacol Exp Ther. 2009;329(1):387–98. doi: 10.1124/jpet.108.145854. [DOI] [PMC free article] [PubMed] [Google Scholar]
- 18.(a) Merino M, Peris-Ribera JE, Torres-Molina F, Sanchez-Pico A, Garcia-Carbonell MC, Casabo VG, Martin-Villodre A, Pla-Delfina JM. Evidence of a specialized transport mechanism for the intestinal absorption of baclofen. Biopharm Drug Dispos. 1989;10(3):279–97. doi: 10.1002/bdd.2510100307. [DOI] [PubMed] [Google Scholar]; (b) Martin-Algarra RV, Pascual-Costa RM, Merino M, Casabo VG. Intestinal absorption kinetics of amiodarone in rat small intestine. Biopharm Drug Dispos. 1997;18(6):523–32. doi: 10.1002/(sici)1099-081x(199708)18:6<523::aid-bdd39>3.0.co;2-2. [DOI] [PubMed] [Google Scholar]
- 19.Nagai K, Nagasawa K, Ishimoto A, Fujimoto S. Pirarubicin is taken up by a uridine-transportable sodium-dependent concentrative nucleoside transporter in Ehrlich ascites carcinoma cells. Cancer Chemother Pharmacol. 2003;51(6):512–8. doi: 10.1007/s00280-003-0569-0. [DOI] [PubMed] [Google Scholar]
- 20.(a) Fernandez-Teruel C, Gonzalez-Alvarez I, Casabo VG, Ruiz-Garcia A, Bermejo M. Kinetic modelling of the intestinal transport of sarafloxacin. Studies in situ in rat and in vitro in Caco-2 cells. J Drug Target. 2005;13(3):199–212. doi: 10.1080/10611860500087835. [DOI] [PubMed] [Google Scholar]; (b) Merino V, Freixas J, del Val Bermejo M, Garrigues TM, Moreno J, Pla-Delfina JM. Biophysical models as an approach to study passive absorption in drug development: 6-fluoroquinolones. J Pharm Sci. 1995;84(6):777–82. doi: 10.1002/jps.2600840622. [DOI] [PubMed] [Google Scholar]
- 21.Montalar M, Nalda-Molina R, Rodriguez-Ibanez M, Garcia-Valcarcel I, Garrigues TM, Merino V, Bermejo M. Kinetic modeling of triamterene intestinal absorption and its inhibition by folic acid and methotrexate. J Drug Target. 2003;11(4):215–23. doi: 10.1080/10611860310001615947. [DOI] [PubMed] [Google Scholar]
- 22.Valenzuela B, Nacher A, Casabo VG, Martin-Villodre A. The influence of active secretion processes on intestinal absorption of salbutamol in the rat. Eur J Pharm Biopharm. 2001;52(1):31–7. doi: 10.1016/s0939-6411(01)00155-2. [DOI] [PubMed] [Google Scholar]
- 23.Gonzalez-Alvarez I, Fernandez-Teruel C, Casabo-Alos VG, Garrigues TM, Polli JE, Ruiz-Garcia A, Bermejo M. In situ kinetic modelling of intestinal efflux in rats: functional characterization of segmental differences and correlation with in vitro results. Biopharm Drug Dispos. 2007;28(5):229–39. doi: 10.1002/bdd.548. [DOI] [PubMed] [Google Scholar]
- 24.Malo C, Berteloot A. Analysis of kinetic data in transport studies: new insights from kinetic studies of Na(+)-D-glucose cotransport in human intestinal brush-border membrane vesicles using a fast sampling, rapid filtration apparatus. J Membr Biol. 1991;122(2):127–41. doi: 10.1007/BF01872636. [DOI] [PubMed] [Google Scholar]
- 25.Ishida K, Takaai M, Yotsutani A, Taguchi M, Hashimoto Y. Membrane transport mechanisms of mizoribine in the rat intestine and human epithelial LS180 cells. Biol Pharm Bull. 2009;32(4):741–5. doi: 10.1248/bpb.32.741. [DOI] [PubMed] [Google Scholar]
- 26.Govindarajan R, Endres CJ, Whittington D, LeCluyse E, Pastor-Anglada M, Tse CM, Unadkat JD. Expression and hepatobiliary transport characteristics of the concentrative and equilibrative nucleoside transporters in sandwich-cultured human hepatocytes. Am J Physiol Gastrointest Liver Physiol. 2008;295(3):G570–80. doi: 10.1152/ajpgi.00542.2007. [DOI] [PMC free article] [PubMed] [Google Scholar]
- 27.Hopper-Borge E, Xu X, Shen T, Shi Z, Chen ZS, Kruh GD. Human multidrug resistance protein 7 (ABCC10) is a resistance factor for nucleoside analogues and epothilone B. Cancer Res. 2009;69(1):178–84. doi: 10.1158/0008-5472.CAN-08-1420. [DOI] [PMC free article] [PubMed] [Google Scholar]
- 28.Moss AM, Endres CJ, Unadkat JD. Maximizing the Hepatic Delivery of Ribavirin while Decreasing its Erythrocyte Toxicity: The Role of the Equilibrative Nucleoside Transporter 1. Poster Presentation, AAPS Annual Meeting; 2009. [Google Scholar]


