Abstract
Extracting anatomical and functional significant structures renders one of the important tasks for both the theoretical study of the medical image analysis, and the clinical and practical community. In the past, much work has been dedicated only to the algorithmic development. Nevertheless, for clinical end users, a well designed algorithm with an interactive software is necessary for an algorithm to be utilized in their daily work. Furthermore, the software would better be open sourced in order to be used and validated by not only the authors but also the entire community. Therefore, the contribution of the present work is twofolds: First, we propose a new robust statistics based conformal metric and the conformal area driven multiple active contour framework, to simultaneously extract multiple targets from MR and CT medical imagery in 3D. Second, an open source graphically interactive 3D segmentation tool based on the aforementioned contour evolution is implemented and is publicly available for end users on multiple platforms. In using this software for the segmentation task, the process is initiated by the user drawn strokes (seeds) in the target region in the image. Then, the local robust statistics are used to describe the object features, and such features are learned adaptively from the seeds under a non-parametric estimation scheme. Subsequently, several active contours evolve simultaneously with their interactions being motivated by the principles of action and reaction — This not only guarantees mutual exclusiveness among the contours, but also no longer relies upon the assumption that the multiple objects fill the entire image domain, which was tacitly or explicitly assumed in many previous works. In doing so, the contours interact and converge to equilibrium at the desired positions of the desired multiple objects. Furthermore, with the aim of not only validating the algorithm and the software, but also demonstrating how the tool is to be used, we provide the reader reproducible experiments that demonstrate the capability of the proposed segmentation tool on several public available data sets.
Keywords: Interactive segmentation, Open science, Multiple object segmentation, Active contours, Robust statistics
1. Introduction
Extracting anatomically and/or functionally significant regions from medical imagery, i.e., segmentation, is a challenging and important task in medical image analysis and clinical communities. One common practice consists of user initialization with one or several “seeds” in the target, and the algorithm then takes over to extract the desired object. Such user initialization renders two key roles: Position: the positions of the initial seeds indicate the estimated position of the target; Feature: the image information in a given neighborhood of the seeds should be employed to learn the necessary characteristics of the desired object as well as to drive the segmentation. However, many previous techniques only utilize the position information from the initialization, but for the feature, they use some general assumption or model rather than those that could be learned from the seeds, to drive the segmentation. For example, high gradient magnitude controls the contour propagation and convergence in (Kass et al., 1988; Malladi et al., 1995; Kichenassamy et al., 1995; Caselles et al., 1997; Li et al., 2004; Grady, 2006; Criminisi et al., 2008). Some other methods use the statistics difference between the inside and outside regions of the contour, for example (Zhu and Yuille, 1996; Yezzi et al., 1997, 1999; Chan and Vese, 2001; Michailovich et al., 2007; Lankton and Tannenbaum, 2008). Contrastingly, the method proposed here aims to make better use of the image information around the seeds in an adaptive fashion, rather than just using seeds as the initial contour location. Basically, the target object characteristics are learned online from the user inputs. Then the active contour evolves from the given places and converges to the desired boundary of the target.
Apart from the active contour framework, another strategy for the interactive segmentation employs the graph theory methodologies (Boykov and Jolly, 2001; Boykov and Kolmogorov, 2003, 2004; Boykov and Funka-Lea, 2006; Li et al., 2006). In that, the image grid is considered as a graph and the user given object and background seeds are treated as sources and sinks. Consequently, the segmentation boundary (curve in 2D and surface in 3D) is a cut in the graph which separate the sources and the sinks. Moreover, it is shown that many segmentation related energy functionals defined on the graph can be optimized by finding the minimal cut of the graph (Kolmogorov and Zabin, 2004). Along that line of research, in the GrabCut algorithm, the target information is learned by constructing the Gaussian mixture models for the target and the background, where the graph cut is then used to separate the image into two regions with largest model discrepancy (Rother et al., 2004). Furthermore, it is noted that the GrabCut algorithm is implemented in the open source OpenCV package (Bradski, 2000), which greatly benefits the 2D image segmentation community in both theoretic and practical aspects.
Moreover, another desired feature for segmentation is the ability to simultaneously extract multiple objects. This can be quite advantageous in medical image analysis, where several related targets all need to be captured. However, most active contour algorithms are tailored to handle only one target at a time. Thus, the given algorithm needs to be executed sequentially several times in order to obtain the required multiple objects. However, since the individual segmentation processes do not interact with each other, it is difficult to guarantee mutual exclusiveness among the contours. To address that, multiple object segmentation has been discussed in several papers (Zhu and Yuille, 1996; Brox and Weickert, 2006; Vese and Chan, 2002; Grady, 2006; Zhao et al., 1996; Shi and Malik, 2000). In these works, the algorithms require the contours to be mutually exclusive (not overlapping). In addition, they also assume that the union of the regions bounded by the contours must be equal to the entire image domain. However, this is usually not a valid assumption for many medical imaging tasks. For example, one wants to extract four organs, two kidneys, the liver, and the stomach, from an abdominal image. Evidently, those targets do not take up the entire image volume. Nevertheless, one can assign all the objects, other than the four we want to extract, to be within the fifth contour, and proceed with the algorithms with such requirement. However, in doing so, the image information in the fifth contour will have too large variation. Then, if each contour evolves to enclose those regions similar to what’s been inside, this fifth contour will eventually enclose too much area. Because of this, we need to drop the previous assumption which was necessary for formulating a constraint variational problem, and proceed with the contour interaction scheme as in the presented work. It is also noted that under the graph theory framework, the multi-object segmentation is also being actively studied. Unfortunately, unlike the bi-partition problem where polynomial time global solution can be found, the multi-way cut problem is NP-hard (Boykov and Funka-Lea, 2006). Therefore, researchers seek the approximation algorithm to handle such situation. Moreover, researchers in (Yan et al., 2005; Yang et al., 2004a) used the shape prior to achieve the multiple target objective. This type of methodology not only requires a learning data set for the shape prior, but also the mutual exclusiveness among the contours that may not be guaranteed. Our methodology does not rely on this assumption, which makes it more suitable for many medical imaging problems. This is accomplished by incorporating the idea from the simple principles of action and reaction into the contour interactions, which also handles the aforementioned problem of overlapping. Thus the algorithm naturally treats the issue of leakage. It is noted that a very preliminary version of this work appeared in the (Gao et al., 2011).
1.1. Tools
The framework of drawing a few strokes and then evolving the contour has been central to many existing interactive segmentation methods. Essentially, the user initiates the segmentation process by providing drawing/strokes in the image domain and the algorithm then takes over to extract the object using image features. From the process one can imagine that for any interactive segmentation method to be conveniently used by the end users, it is necessary to have an integrated environment including all the functionalities such as graphical user interface, label map drawing capability, the subsequent computation process, and contour corrections. Moreover, the algorithm will be most widely used if it is open source. Unfortunately, comparing to the theoretical literature, there are much fewer published works that combine the theory with an end user oriented software, even fewer are they open sourced. Among them, for example, the ITK-SNAP software is a very nice software providing not only the algorithm but also an entire user friendly environment for three dimensional image segmentation based on active contour evolution (Yushkevich et al., 2006). Still, the contour evolution in ITK-SNAP only utilizes the image gradient information and/or the global intensity as the criteria for the contour evolution. Because of that, in the case where the target contains inhomogeneous intensity, the segmentation results may not be optimal. Similarly, Seg3D is another example of well developed open source volume segmentation and processing tool (University of Utah SCI, 2010), and it also utilizes the image processing and segmentation functionalities in the Insight Toolkit library (Ibanez et al., 2003). In addition, the OpenCV package implements many computer vision algorithm (not specific to the medical applications), mostly for 2D images, including the above mentioned GrabCut algorithm (Rother et al., 2004).
Following the same open science philosophy of not only proposing an algorithm but also providing the implementation, user interface and user reproducible experiments, in this work, out proposed method has not only been implemented and tested locally, but it is also released as a module in and open source medical image analysis software/platform called 3D Slicer (Pieper et al., 2004)1. By doing this, the reader can download and test the algorithm without re-implementation. Moreover, as the user feedback indicates, the algorithm/software is already being used by a wide range of users.
The remainder of the paper is organized as follows. In Section 2, we detail the proposed semi-automatic segmentation method. After that, the implementation of the algorithm, along with the running environment are addressed. In particular, since the method is public available and is ready for testing, we provide several examples demonstrating the usage and tuning of the software under different scenarios in Section 3. Finally, the paper is concluded with future and ongoing work discussed in Section 4.
2. Method
If we consider the segmentation process in our own visual system, we observe that several basic steps take place in sequence when human is recognizing the objects in a scene (Palmer, 1999). We will illustrate this via an example. Suppose that we want to trace out the boundary of both the liver and the right kidney in medical imagery. First, prior anatomy knowledge drives our attention to the right abdominal region. Second, we focus at an area where we believe to be most “liver-like,” and learn the liver characteristics in this particular image. With such knowledge, we then move our focus to enclose more tissue that looks similar to those representative regions. Usually, such similarity ends when we reach a remote area. In particular, at the boundary where the liver touches the right kidney, the decision is difficult. Under such a situation, we apply a similar procedure to the kidney, and we come back to the same ambiguous region. However, this time with the information from both sides (liver and kidney), internally we perform a competition: we compare the current voxel with both the liver and the kidney to decide which boundary should advance, so the other should retreat. Finally, the boundaries of liver and kidney are placed at the balanced locations of the competition.
The segmentation scheme presented in this paper is based on a mathematical model for the above process. It is a semi-automatic method because the first step above is achieved by the user providing a label map indicating different targets by different labels. Each subsequent step is handled by an automatic algorithm and is detailed in what follows below.
2.1. Online feature learning
Denote the image to be segmented as I : Ω → ℝ where Ω ⊂ ℝd and d ∈ {2, 3}. Likewise, the user provided label map is denoted as L : Ω → ℕ ∪ {0} where 0 indicates background and non-zero positive integers indicate the target object labels. For ease of discussion, in this paper, we assume the distinct labels to be consecutively ranging from 0 to N, an arbitrary positive integer. Moreover, the labeled region can be defined by several initial “seeds”, and does not have to be close to the desired boundary. Next, voxels with the non-zero labels are categorized into different “seed groups” as Gi = {x ∈ Ω : L(x) = i}.
In order to fully utilize the information given by the label map, we note that the seed group not only indicates the location of the target, but also provides some sample voxels contained in it. Hence, instead of making general assumptions on the target characteristics such as brighter/darker than surrounding area, we can learn their characteristics from the user provided seed region. In many cases, the image intensity alone is not descriptive enough. Hence, a feature vector is extracted at each voxel, forming a feature image f : Ω → ℝDf. Subsequently, the segmentation is performed in the feature space. There are many choices for the feature vector such as wavelet coefficients, Fourier descriptors, Hessian matrix, etc. In this paper, we choose local robust statistics (Huber and Ronchetti, 2009; Pichon et al., 2004) because they are not sensitive to image noise, and may be computed quickly.
To this end, for each voxel x in the image, we define the feature vector f(x) ∈ ℝDf by combining several robust statistics derived in a neighborhood B(x) ⊂ Ω around x. More explicitly, we denote MED(x) as the intensity median within B(x). In addition, the local intensity range is also an important characteristic, but is sensitive to the noise. To address this issue, the distance between the first and third quartiles, namely the interquartile range (IQR(x)), is calculated as the second feature. Furthermore, the local intensity variance is a good candidate but again it is sensitive to outliers. In contrast, the median absolute deviation (MAD) is much more robust and is computed as MAD(x) ≔ mediany∈B(x) (|I(y) − MED(x)|). Consequently, we define the feature vector f(x) as:
| (1) |
Numerically, in computing the robust statistics, the neighborhood size B(x) is fixed at 3 × 3 × 3. Then, with the space of feature vectors thus defined, seed groups are now characterized by the probability density function of the feature vectors estimated by:
| (2) |
where K is the kernel function. In this work, we use the Gaussian kernel. Its variance is chosen to be the MAD of the seed group divided by η, whose value can be adjusted.
2.2. Contour evolution
The pi value in Equation (2) can be considered as the conformal metric defined on the image domain (Kichenassamy et al., 1996; Caselles et al., 1997). Contrasting to the edge based schemes where the curve length (or surface area) under the isotropic conformal metric or anisotropic Riemannian metric is minimized, here the intuition behind the discussion below is that we try to maximize the area the surface encloses under this conformal metric, with certain regularization. This is achieved by the following variational approach.
Similar to (Caselles et al., 1997), we will use the term “contour” for both 2D curve and 3D surface. In particular, the following discussion is carried on in 3D. First, we denote the family of evolving closed contour as Ci ⊂ Ω. Without interactions among contour (interaction is addressed in Section 2.3 below), each contour evolves independently in order to minimize the energy functional:
| (3) |
where in the first term the x traverses the space in Ω inside the closed surface Ci and the second term is the surface area (curve length in 2D). Moreover, the pc is the cutoff probability density used to prevent the contour leakage (Yang et al., 2004b) and is fixed at 0.1 as suggested there. Essentially, if on certain region the image feature does not seem to be sufficiently close to those learned in the seeded region, the probability of observing such feature is small. Therefore, with pc = 0.1, we penalize the contour from growing into a region, the probability of observing whose image feature is less than 10%. Likewise, λ > 0 is the smoothness factor. Computing the first variation of Ei and we obtain the flow of Ci:
| (4) |
in which q is the spatial parametrization of the contour, Ni is the inward unit normal vector field on Ci, and κi is the mean curvature of the contour.
2.3. Contour interaction
Although the pc term in Equation (3) helps to prevent contour leakage, in many cases the result is not sufficiently satisfying. Indeed, it often results in the problem that certain regions are over-segmented, while some others are under-segmented. The leakage issue, i.e., making decisions in a transitional region, is sometimes a difficult task even for the human visual system. However, one particular strategy the visual system takes, is to approach the decision boundary from both sides by competition, rather than preventing the leakage from a single direction. To this end, we enable the interaction amongst the previously individually evolving contours analogous to the standard principles of action and reaction from Newtonian mechanics. First, we regard the right hand side of Equation (4) as the speed of the infinitesimal curve segment along the normal direction at the position Ci(q, t) ≕ p ∈ Ω. Now with the interaction among curves, such a curve segment will also be affected by the speeds of the other curves:
| (5) |
Accordingly, the curve flow Equation for Ci is now updated as:
| (6) |
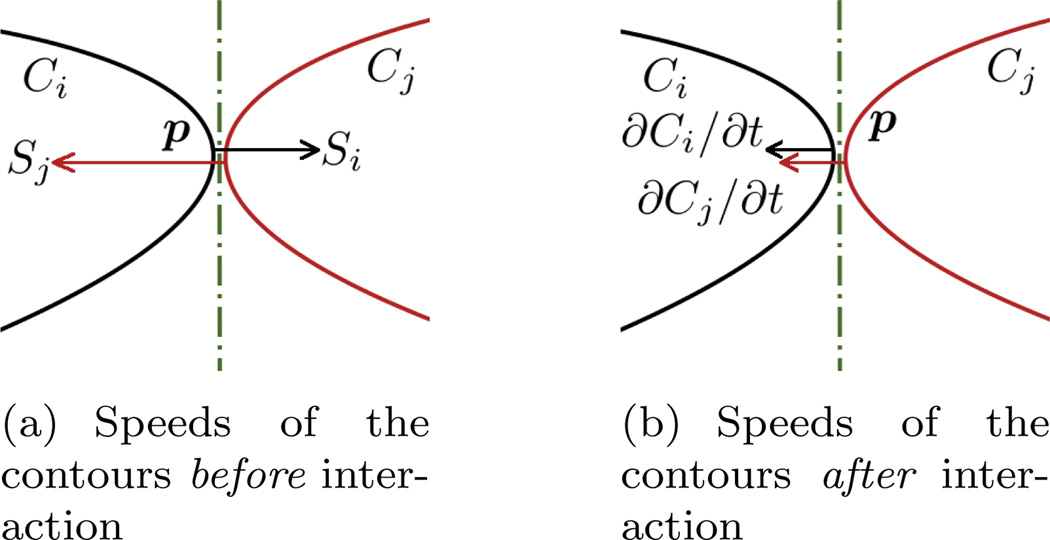
The exponential term controls the “inuence range” of the speed. When curves are far away, this term reduces the effectively to zero. In general, the contour evolution scenario is as follows: Initially, the contours do not touch each other because the seeds are sparsely scattered in the domain. Thus each is approximately zero and each contour evolves individually. As the evolution proceeds, the contours get closer and the mutual interactions begin to take place. Moreover, they will compete and finally rest at balanced (equilibrium) positions. Throughout the whole process, the contours speed are governed by the action/reaction principle from mechanics, and will never overlap with each other, which is a necessary feature for multi-object segmentation. Figure 1 is a schematic demonstration of the situation that when the two contours almost touch each other, how the intrusion into each other is avoided. In Figure 1(a), the section of the contour on the left is “almost touching” the contour on the right at the point p. By almost touching, we make the approximation so that the term |p − Cj(w, t)| ≈ 0 in Equation (5). (In the figures, some space is left between the two contours at point p for clearer demonstration.) Moreover, we assume the normal directions of the two contours coincide at that point, so that they share the same tangent plane and we only need to consider the speed but not the velocity vector. We then denote the current speed of the left contour as Si, pointing to the right and the current speed of the right contour is Sj, point to the left. Evidently, without contour interaction, the two contours would intersect with each other at the next time point. However, with the coupling of the speeds, the actual speed of the left contour is modified as Si−Sj (to the right) and the speed of the right contour is modified as Sj −Si (to the left). Consequently, the two contours moves in the same direction with the same speed and we arrive at the situation in Figure 1(b). In addition, the above analysis did not include the curvature regularizer term. With that term, each contour has the tendency to shrink and become smooth, which further reduces the chance of protrusion. Admittedly, the above analysis is not easy to be extended to the cases where three or more contours touches at a single point. However, on one hand in the continuum, singularity will develop when three or more curves/surfaces meet at a single point. But with the curvature regularization, the surfaces/curves are always infinitely many time differentiable without singularity. On the other hand, such situation is not observed in practices.
Figure 1.
Schematic plot demonstrates that the contours do not intersect during their evolutions. This can be understood as 2D contour interaction or 3D interaction displayed in a normal cutting plane. (a) When two contours almost touch each other, their respective internal speeds will cause intersection in the next time step. The dash-dotted line in the middle is the common tangent line of both contours. (b) After incorporating the speed of the other contours, the updated speed would not cause intersection.
Moreover, using the “sparse field level set” implementation (Whitaker, 1998), not only the topology of the contour is free to change, but also the computation of is very efficient. Indeed, for a point p on contour Ci to detect whether it is close to another contour Cj, it just need to read the level set function value of Cj at location p. Furthermore, to compute the integration on the contour, we only compute a local region where the exponential term in Equation 5 is larger than 10−3. In practice, this is a small region around p by 8 × 8 × 8. By doing this, we do not have to traverse all the points on each of the contours and the running time is significantly reduced without generating visually observable differences.
3. Implementation and Examples
In order for such segmentation algorithm to be useful for end users, a user-friendly interface is essential. Moreover, for the method to be beneficial and tested by the largest possible audience, the method as well as the software environment/platform it runs on should be open to public. For these reasons, we have chosen to use 3D Slicer package (Pieper et al., 2004). The algorithm proposed in the present work exists as a shared library command line module in Slicer. By doing this, the algorithm is compiled as a shared library and is loaded dynamically. Moreover, the data set on which the algorithm operates is directly transferred from memory, instead of being read from hard disk. Considering also that many medical images are compressed, the data loading time would further include decompression time, such memory transfer scheme reduces the run-time overhead substantially. Finally, the algorithm/software is released within 3D Slicer in the Segmentation module category, and all of the source code is within the 3D Slicer code hierarchy, in the path of Applications/CLI/RobustStatisticsSegmenter/.
Besides the source code, the testing data in this experiment section are also open accessible, therefore all the experiments here are very easy for the readers to reproduce and evaluate. Because of that, in this experiment sections we give some rather explicit details and thus they have both an experimentation and a tutorial flavors.
3.1. Meningioma Segmentation
In this section, we present an interactive study of the extraction of a meningioma from MR data. In order for the reader to reproduce the result we get here, this MR image is available online (NA-MIC, 2011a), so is the label image (NA-MIC, 2011b).
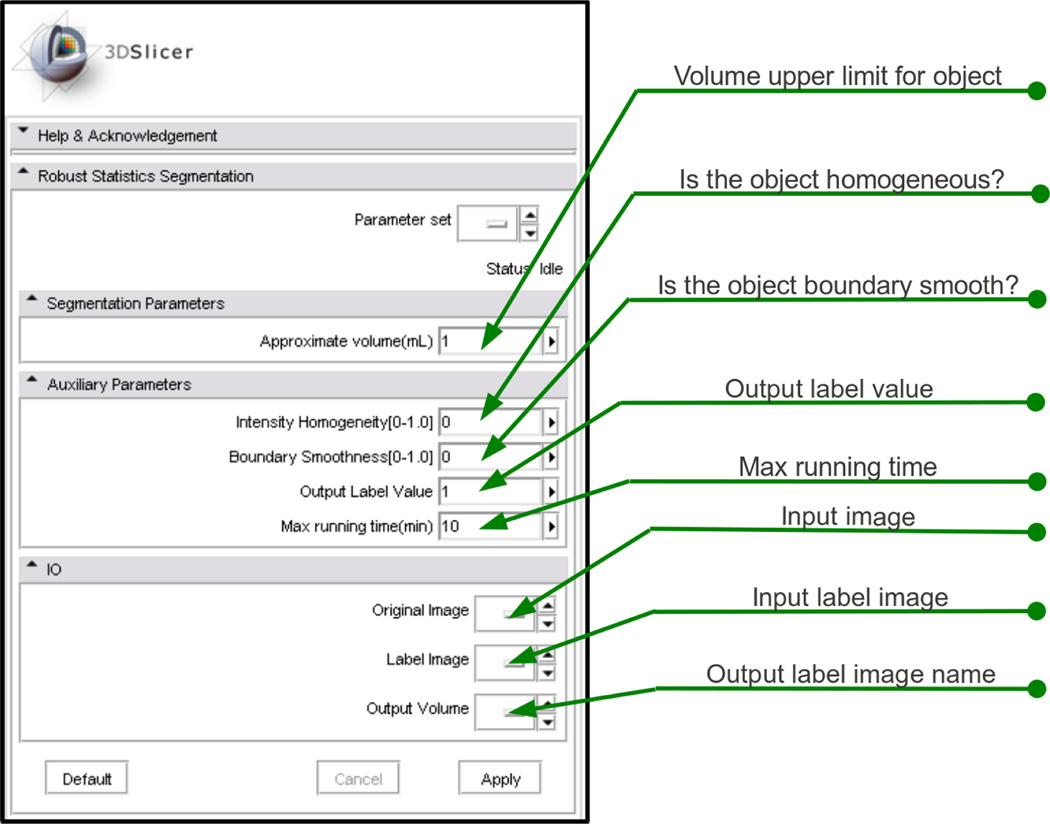
First, the module’s interface in 3D Slicer is shown in Figure 2. We note that the parameters are named so that the end users may better understand them. In particular, the “factor for kernel width” η in Equation (2) is very difficult for clinical people to understand. (Pichon et al., 2004) suggested a typical value of η = 10. However, for various types of data, we tested and found this parameter needs to be adjusted in the range from 0.1 to 20. Furthermore, we try to describe such technical parameter in a way which may be easier to be grasp by the clinical users. Hence we designed the “intensity homogeneity”(IH) parameter to be in the range of [0, 1] and it is related to the η in Equation (2) by η = IH × (20 − 0.1) + 0.1. Intuitively, this parameter is interpreted to clinical users as: a smaller IH will increase the likelihood of the contour growing into regions less similar to the seeded region. Similarly, the “boundary smoothness”(BS) parameter is the λ used in Equation (3), which adjusts the smoothness of the contour. And the “approximate volume” is where user provides the volume upper limit for the object. In addition to those algorithm related parameters, the module also has some drop-down boxes for the image IO and running time upper limit.
Figure 2.
The interface of the algorithm’s module.
The algorithm needs an initial seed/label image to learn the object features and start contour evolution, and this can be done with ease in the Slicer Editor module shown in Figure 3. In this figure, we show one free style stroke in one slice of the image. Indeed, the seeded region can be rather flexible as long as it is inside the object.
Figure 3.
Use the editing tool to draw a stroke in one slice. On the left, the red circle is the paint tool; on the right, the green circle indicates the blue stroke of the seeded region.
With the seeded region drawn in the label image, the label image is fed into the “Label Image” box of the module GUI. The algorithm runs about 3 seconds and the segmentation of the meningioma is computed and using the “Model Maker” module in 3D Slicer, we obtain a 3D view of the segmented object. For this data set, the IH parameter is set to 0.1 and the smoothness is set to 0.2. Sometimes, these two parameters need to be tuned via trial-and-error, however, in most of the cases a set of working parameters can be found very quickly. Indeed, the fast running speed due to the sparse field level set method makes the parameter tuning quite easy. The result of the procedure is shown in Figure 4, including the three standard views and the 3D surface model.
Figure 4.
Segmentation of the meningioma using proposed algorithm and module in 3D Slicer. The blue contours are generated by the proposed automatic segmentation algorithm, while the red contours are drawn manually by an expert radiologist in the Brigham & Women’s Hospital, and the green contour is where the automatic ones coincide with the manual ones.
3.2. Test on Robustness to Noise
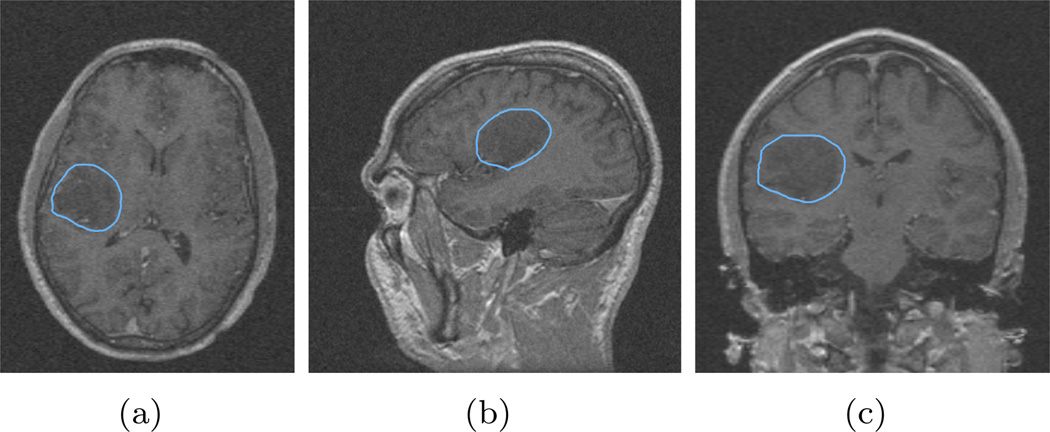
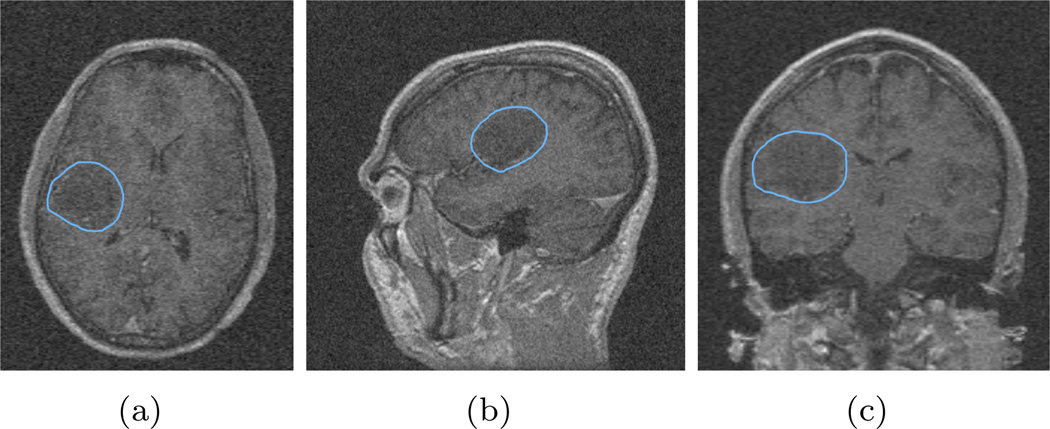
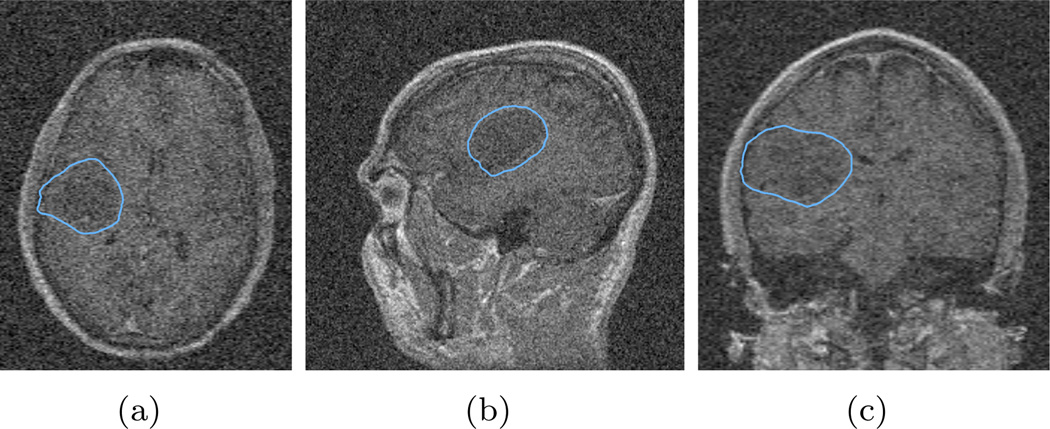
Using robust statistics as the feature inherits the property that the algorithm is robust to noise contamination. In this test, we use the same seed label image and same parameters as in the previous section, but we added zero mean Gaussian noise into the image to be segmented with various standard deviation (STD) levels. More explicitly, the original image has the intensity range from 0 to 481, and we first added Gaussian noise with standard deviation of 10. The three views of the segmentation result over-layed on the contaminated image, are shown in Figure 5. Furthermore, zero mean Gaussian noise with standard deviation of 20 and 40 are added, and their results are shown in Figure 6 and Figure 7.
Figure 5.
Segmentation of the image with additive zero mean Gaussian noise with standard deviation of 10. It can be seen that although the image contrast between the tumor and the surrounding tissue degrades, the algorithm still captures the tumor very well.
Figure 6.
Segmentation of the image with additive zero mean Gaussian noise with standard deviation of 20. It can be seen that some part of the tumor boundary is difficult to differentiate even for human. The algorithm result, though not as good as before, still captures the tumor correctly.
Figure 7.
Segmentation of the image with additive zero mean Gaussian noise with standard deviation of 40. In this case, the noise is too strong even for human observers. And the computed contour leaks out in the left-right direction.
In addition, the symmetric Hausdorff distances (HD) with respect to the expert segmentation results are provided in Table 1.
Table 1.
The Hausdorff distances (HD) of segmenting the meningioma, under various added noise level, with respect to the expert manual segmentation.
It is also noted that in all the Figures 5, 6, and 7, the window and level for display are the same, therefore their visual appearances are the same.
3.3. Guideline for the Drawing of the Seeds
With one real segmentation task demonstrated, we now turn to discuss the influence of the seed placement and how one may expect to place for better results. Evidently, the locations of the seeds/strokes affect the segmentation results. In this section, we try to explain some general rule for drawing the strokes. In fact, the only rule is that the strokes are preferred to be placed roughly around the center region of the target to be segmented. Indeed, this is because although we have schemes to prevent leakage, their capability is never perfect. If, however, assuming other conditions being fixed but we put the seeds very biased to one side of the target, the contour would touch this side of the target boundary much earlier than the other side. Then, the algorithm is required to hold this side of the contour from being leaking out, yet growing the other side to reach the other boundary. This is not a huge challenge for targets with evident discrepancy with respect to its surroundings. Nevertheless, it may leak in less perfect scenarios. Therefore, by putting the seeds in relative center region of the target, we give the algorithm less pressure on holding one side from being leaking while growing the other side to reach the boundary.
Indeed, in the testing case above and the following tests, we always roughly draw the strokes around the center region of the target. Or in the multi-target situation, the strokes of each target are also roughly around the center.
3.4. Multiple Object Extraction on the Same Data Set
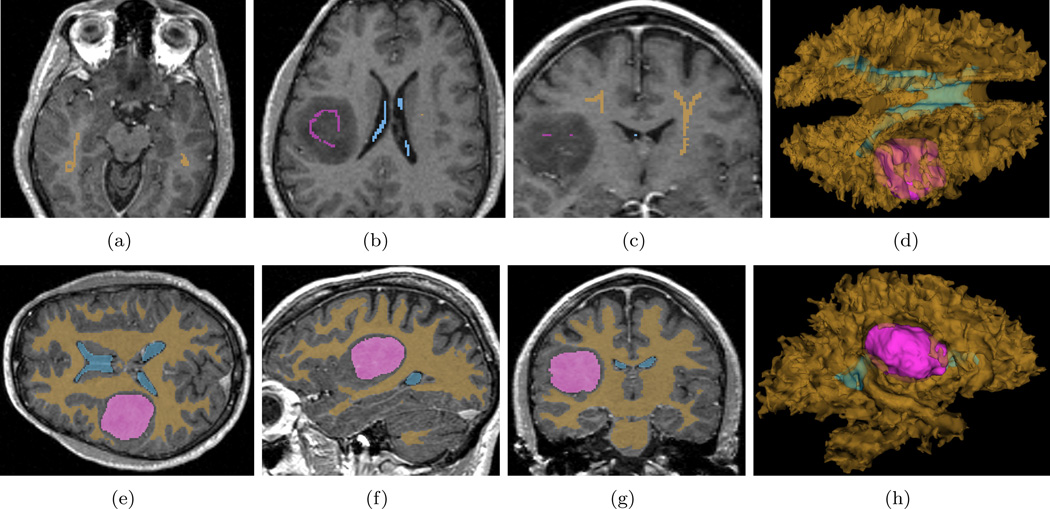
The previous section demonstrated using the module to extract a single object from the image. In the following sections, we demonstrate extraction of multiple objects simultaneously. In order to do that, one needs to turn on the module “Multiple Object RSS” in the “Extension Manager” of Slicer under the “View” menu item. The user interface is the same as the previous one, except that the “Expected Volume” and “Output Label Value” are removed due to the multiple objects. Further, in drawing the label image, we can now use different colored labels to indicate different objects. In this, we test this scheme on the same data set used in the previous section.
The label maps we draw for this task are shown in Figure 8. Basically, we freely draw two strokes for the white matter in a single axial and a single coronal view, and one stroke each for the meningioma and the ventricle, in a single axial slice. The IH is 0.2, the BS is 0.05, and the number of iterations is set to 1000. In order for the reader to reproduce the result we get here, this MR image as well as the label image are also public available at (NA-MIC, 2011a) and at (NA-MIC, 2011c), respectively.
Figure 8.
Multiple object RSS. (a, b, c): All the seeded labels drawn for this test. (e, f, g): Segmentation results in axial, sagittal, and coronal views. (d, h): 3D views from superior and left.
3.5. Heart CT Segmentation
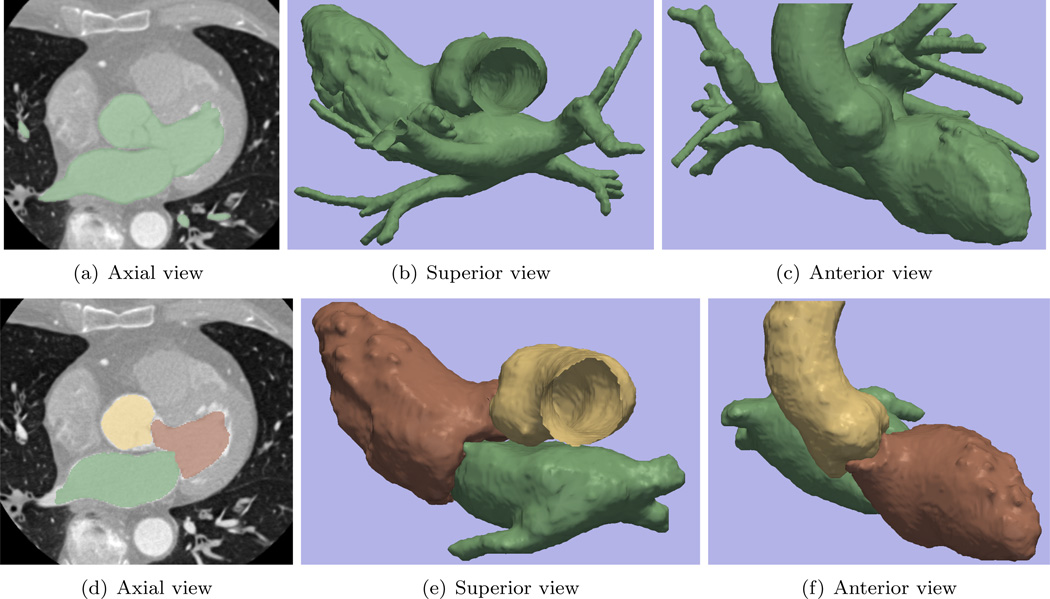
The module is next tested on the task of segmenting the left ventricle in the heart CT image, publicly available at (OsiriX, 2011a). Such task is a necessary step for evaluating the cardiac output and assessing cardiac functions (Paragios, 2003). To that end, we first tested the single target version of the module, and this result is shown in Figure 9(a) to Figure 9(c).
Figure 9.
In Sub-figure 9(a) through 9(c), we aim at only segmenting one object (left ventricle), but the contour leaks and also includes the left atrium and aorta. In 9(d) through 9(f), when segmenting several objects simultaneously, the interaction among the contours take places at the regions of mitral valve and the aortic valve, which effectively prevents the leakage. Moreover, we have the separated segmentations of the ventricle, atrium, as well as the aorta. In particular in the 3D views of Figure 9(e) and 9(f), we can see the chambers are separated by the valves very clearly.
Depending on the demands of the user, such segmentation may be satisfying because it correctly extracts the entire blood pool of the left heart and the aorta region. However, in some cases when only the left ventricle is needed, not only the other portions are unnecessary (caused by leakage), but also the valve (mitral valve and aortic valve) regions should have been excluded from the chamber segmentation. On the other hand, in such case, due to the partial volume effect, the contour leakage from the ventricle into the atrium and aorta is very difficult to be avoided. That is, the three parts are easier to be segmented as a whole then to be separated. Under such scenarios, many researchers utilize the ventricle shape as the prior knowledge to restrict the segmentation and prevent the leakage, see (McEachen and Duncan, 2002; Paragios, 2003; Tsai et al., 2003) and the references therein. However, that would further involve the registration and shape learning into the scene. Alternatively, here we take another route and employ the multiple target version of the module: We put seed labels in the left atrium, left ventricle, and the aorta. Then, the algorithm is able to identify different targets and invoke the contour interaction mechanism.
The result of the multiple target module is shown in Figure 9(d) to Figure 9(f). It can be seen that the final labeling of the left ventricle, shown in brown, not only fully captures the left ventricle region, but also effectively prevents leakage from intruding into both the atrium and the aorta. Furthermore, by comparing the 3D models of the multiple objects with the single target, we see that now the valves are correctly excluded from the chamber segmentations.
Again, in order for the readers to reproduce the results here, the testing image can be downloaded at (OsiriX, 2011b). It is noted that for faster computation, this is a sub-sampled (by a factor of two along each dimension) version of the original image. The label image to generate Figure 9(a) through 9(c) is at (OsiriX, 2011d), and the parameters are 0.01 and 0.1 for the intensity homogeneity and the smoothness. Moreover, the multi-label image is at (OsiriX, 2011c), with the parameters: 0.5 for intensity homogeneity, 0.6 for smoothness, and 600 for number of iterations.
ITK-SNAP and Seg3D are two publicly available softwares and are ready to be used by the non-algorithm oriented end-users. We therefore also tested the two softwares using the data sets used here. It is noted that the two softwares both use a combination of edge and regional information so they both assume that the target region would either have a strong edge (gradient) or a homogeneous intensity which is different from its outside. Therefore, as shown in Figure 11, for cases where such assumptions are valid, the segmentation is very similar to those in Figure 9.
Figure 11.
Heart segmentation by ITK-SNAP and Seg3D
When the intensity inhomogeneity of the target is larger or there are weak edges, even for a single target, the results obtained by the algorithms in the above softwares are less accurate. Take the meningioma segmentation for example in Figure 12. It can be seen that because the (non-meningioma) regions to the right and anterior of the meningioma have very similar intensity (only slightly brighter) to the main body of the meningioma, those regions are included into the result. On the other hand, if fewer iterations are used to avoid the leakage, some other regions will be under-segmented.
Figure 12.
Comparing ITK-SNAP to a manual segmentation. The yellow contours are generated by the ITK-SNAP, while the red contours are drawn manually, and the green contour is where the automatic ones coincide with the manual ones.
Although we illustrate some of the differences between our method and other interactive tools, a comprehensive comparison of all state of the art segmentation tools is beyond the scope of this paper. Therefore, we do not claim to have the best interactive segmenter of the field, but instead present a promising open-source GUI-integrated approach to an important medical imaging task.
3.6. Quantitative Analysis for Ventricle and Caudate Nucleus
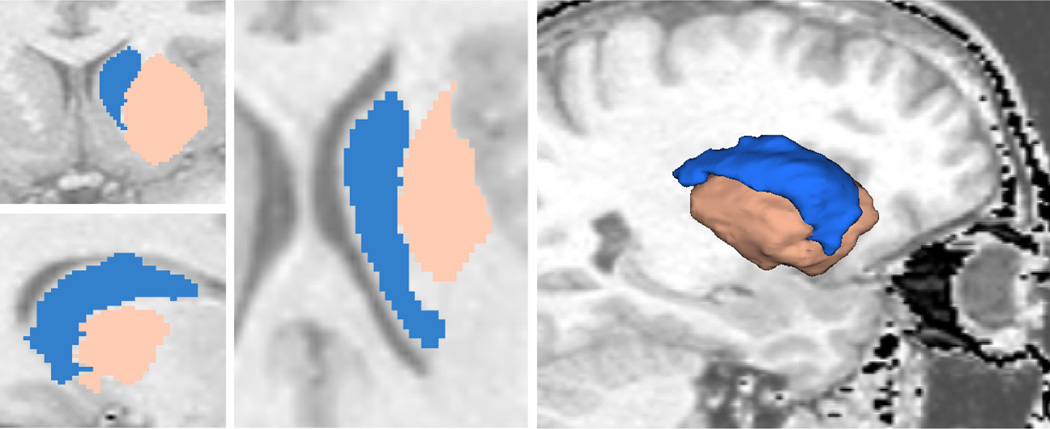
In this experiment, we extract both the ventricle and the caudate nucleus from MR images and present the results both qualitatively and quantitatively. The caudate nucleus is a difficult object to extract due to the poor contrast with its surrounding tissues. In fact, if we only place seeds in the caudate, we get the result shown in Figure 10(a) where the large leakage region is circled. On the other hand, if we also place some seeds around the caudate, we also capture some portion of white matter as shown in Figure 10(b) in almond color. Simultaneously, the caudate shape is kept intact and no leakage occurs. The almond part can be discarded because the caudate is the only object of interest; the final result is shown in Figure 10(c).
Figure 10.
If we only place seeds in caudate we get segmentation in Sub-figure 10(a) where the leakage is circled in yellow (3D view of the caudate above an axial slice from superior-right to highlight the leakage region). After putting some auxiliary seeds in the surrounding tissue we get results in the sagittal view in 10(b) where the caudate shape is kept intact. Discarding the auxiliary region and the caudate is shown alone in 10(c). (Sagittal view from right.)
Performing the same procedure on another subject gives the results in Figure 13 where we show both the segmentation and the original image. In addition to the caudate, the method is also applied on ventricle which is an easier segmentation task. In total, we performed 30 tests on different subjects. The Dice coefficients are computed against expert segmentations (manual contour provided by a neuroradiologist in the Brigham and Women’s Hospital, Harvard medical school), and are provided in Table 2 for ventricle and Figure 14 for the left and right caudate nuclei (blue and green bars, respectively).
Figure 13.
Overlay the segmentation results on the original images. The almond region is again auxiliary for preventing leakage.
Table 2.
The Dice coefficients of segmenting 30 ventricles, comparing with expert manual contours.
| ID# | 1 | 2 | 3 | 4 | 5 | 6 | 7 | 8 | 9 | 10 | 11 | 12 | 13 | 14 | 15 | 16 |
| Dice | 0.93 | 0.92 | 0.95 | 0.92 | 0.92 | 0.92 | 0.94 | 0.95 | 0.89 | 0.91 | 0.94 | 0.91 | 0.93 | 0.94 | 0.95 | 0.95 |
| ID# | 17 | 18 | 19 | 20 | 21 | 22 | 23 | 24 | 25 | 26 | 27 | 28 | 29 | 30 | Mean | STD |
| Dice | 0.93 | 0.91 | 0.91 | 0.91 | 0.95 | 0.91 | 0.95 | 0.91 | 0.95 | 0.92 | 0.91 | 0.91 | 0.93 | 0.93 | 0.93 | 0.017 |
Figure 14.
The Dice coefficients of segmenting 30 caudates, comparing with expert manual contours are shown in the blue and green bars for the left and right caudate, respectively. Furthermore, the seed images are edited, each for less than 15 seconds, and the increments are shown in the orange and red bar on top.
In order to demonstrate the fact that further editing of the seed images would increase the segmentation accuracy, we edit all the seed images for the caudate segmentation. The editing are based on the individual result of the previous segmentation: some need more seeds to include the tail, others need seeds to prevent leakage into the putamen, etc. While this process demonstrates the power of the interactive segmenter, the editing time for each image is controlled to be less than 15 seconds. The increments in the Dice coefficients are plotted in the orange and red colors on top of the original bar plots. As can be seen, apart from a few cases, all the segmentation accuracies improved with further editing.
3.7. Maneuverability test
Following the further editing tests performed for the caudate segmentation above, it is noticed that one desirable feature of the interactive segmentation tool is for the user to be able to drive the segmentation as close to his/her expected outcome as possible. In this section we investigate such maneuverability of the proposed method.
For single contour evolution schemes, the maneuverability is relatively limited because the users are only allowed to assign the target seeds. The graph-cut based algorithms, however, because of being able to assign both target and background seeds, provide better maneuverability. Unfortunately, the multi-target segmentation requires a multi-cut scheme for graph which has been shown to be NP-hard (Boykov and Funka-Lea, 2006) so one can only expect approximated algorithms. The proposed multi-contour evolution method, from this perspective, tries to incorporates the idea of assigning background seeds to prevent leakage and better maneuverability and perform multi-target segmentation as well.
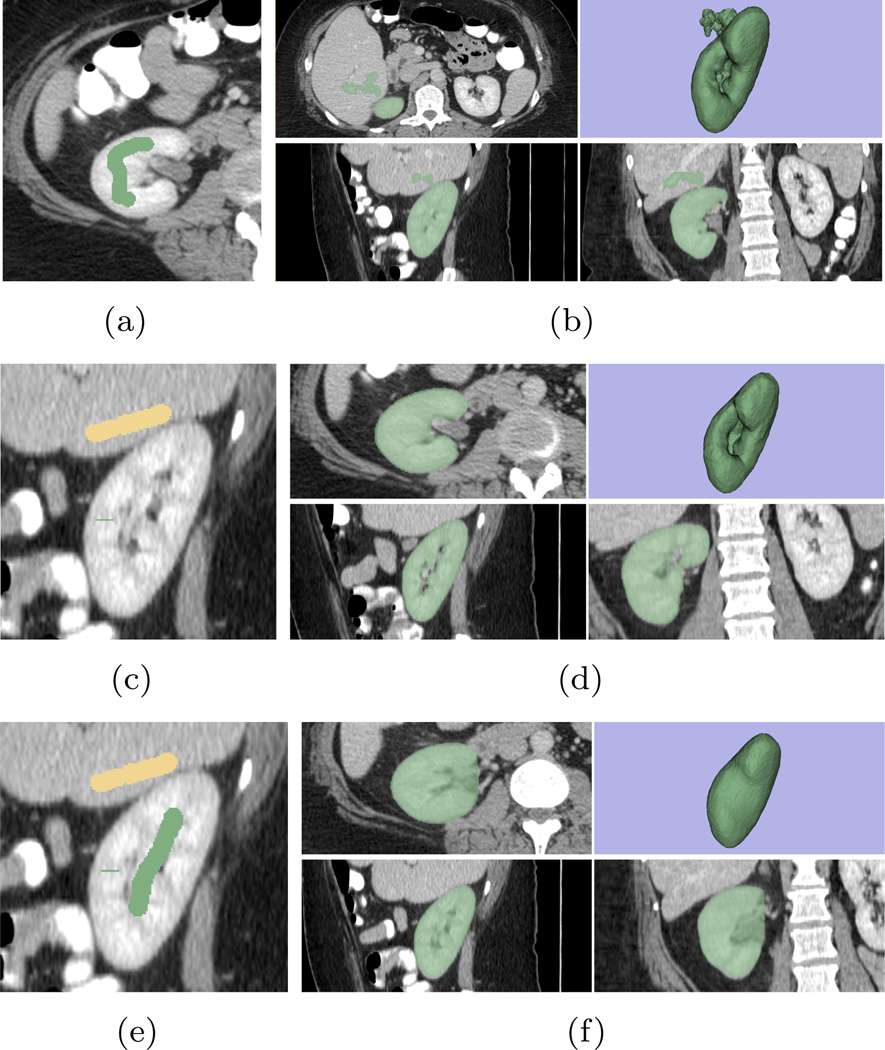
In this test we use an abdominal CT image for example and try to extract the right kidney from it. To that end, we draw a stroke in one of the axial slice, as shown in Figure 15(a). The result of such initial is shown in Figure 15(b) from which we can see that the surface leaks into the liver region because the two organs share very similar intensity. To prevent such leakage, one more stroke is added in one sagittal slice in the liver, shown in yellow color in Figure 15(c). With such input, the leakage is effectively removed, giving the result in Figure 15(d). Such result may be satisfactory for some applications. In some other cases, however, the user may want to include the pelvis into the segmentation. Such purpose can be achieved by adding some more strokes in the desired region, as shown in Figure 15(e) where a single stroke is added in one sagittal slice. (In this case this stroke is in the same sagittal slice as the previous one in the liver region. However it is not required.) With such new seeds, the pelvis region is now included in the resulting segmentation, as shown in Figure 15(f).
Figure 15.
The tests of the maneuverability of the proposed algorithm. (a) Initial (first round) stroke drawn to extract the right kidney. (b) The result of the first round: leakages into the liver are observed. (c) Adding stroke in one sagittal slice in liver, shown in the yellow color, to prevent leakage (second round). (d) The result of the second round. (e) Adding strokes to include the renal pelvis regions (f) The result of the third round.
3.8. Abdominal Organ Segmentation
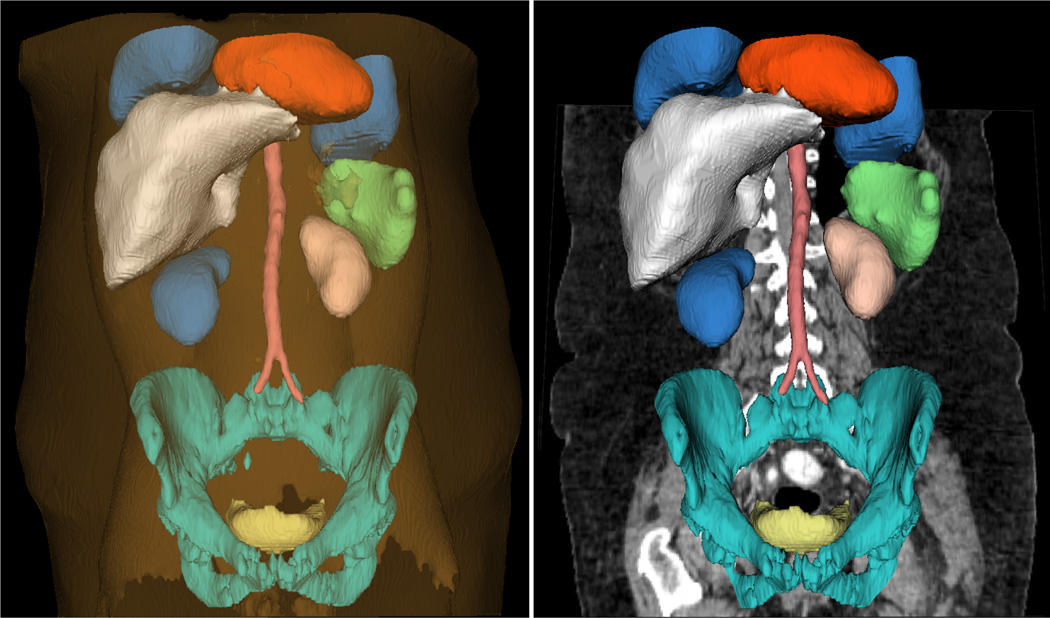
In order to demonstrate the wide applicability of the proposed algorithm, in this last experiment, 11 different organs/tissues are extracted from an abdominal CT image, and the result is shown in Figure 16.
Figure 16.
Segmentation of heart, two lungs, liver, two kidneys, spleen, abdominal aorta, pelvis, bladder, skin/muscle/fat. The Sub-figure on the right removes skin/muscle/fat but overlays the original image.
In addition, we use this experiment to demonstrate the process of contour interaction and the achievement of the balanced positions in Figure 17. At first, the two surfaces are far from each other and evolve separately. Because the kidney is smaller in size, its surface reaches kidney boundary first and leaks at where it touches the liver. While the kidney surface evolves in the liver region, the liver surface reaches these regions and the interaction begins. After that, the liver surface continues pushes the kidney out and they finally converge at the balanced position.
Figure 17.
The surface evolution process shown in one CT sagittal slice. This demonstrates the contour interaction and how they converge to the balanced positions. (a) Soon after two contours start evolution, no interaction in between. (b) Kidney contour intrudes into the liver. (c) The liver contour is pushing the kidney contour out. (d) The two contours converge at their balanced position.
3.9. Drawing Time, Number of Strokes, and Running Time
Although it has been mentioned previously in each case, here we sum-up the time used for drawing the strokes, the number of strokes and the algorithm running time, shown in Table 3.
Table 3.
The time used for drawing the strokes, the number of strokes, the algorithm running time, and the Dice after each running. The three targets for the heart are: aorta, left ventricle, left atrium. The three targets for the abdominal CT are: heart, left lung, right lung, liver, left kidney, right kidney, spleen, abdominal aorta, pelvis, bladder, skin+muscle+fat
| Meningioma | Meningioma ventricle,white matter |
heart (single target) |
heart (3 targets) |
Abdominal CT (11 targets) |
|
|---|---|---|---|---|---|
| Image Size | 256×256×123 | 256×256×123 | 256×256×186 | 256×256×186 | 512×512×204 |
| Drawing stroke time | <1 sec | 10 sec | <1 sec | 8 sec | 30 sec |
| Number of strokes | 1 | 1,2,2(1 on each side) | 1 | 3 (1 for each) | 11 (1 for each) |
| Algorithm running time | 3 sec | 2.8 min | 1.3 min | 1.5 min | 19 min |
| Editing stroke time | 0 | 3 sec | 0 | 15 sec | 20 sec |
| Number of new strokes | 0 | 0,0,2 | 0 | 0,5,3 | 1 (liver) 1 (R-kidney) 1 (aorta) 2 (pelvis) |
| Algorithm re-running time | 0 | 2.7 min | 0 | 1.4 min | 20 min |
4. Conclusions and Future Work
In this note, we proposed a general purpose image segmentation scheme for medical data. In particular, the image features are extracted using certain local robust statistics as the segmentation criteria. Subsequently, the object characteristics are learned from the user initialization, which is further used to guide the active contour evolution in a variational framework. Furthermore, we incorporate the interactions between the contours into the evolution motivated by simple principles of action and reaction. This not only effectively reduces the contour leakage, but also results in a multi-object segmentation scheme without assuming that the union of the segmentation regions is the entire domain.
The second contribution of this work is toward open science. The entire algorithm is now public available as a module in the 3D Slicer software/platform. Hence not only the readers do not have to re-implement the algorithm, but also the graphical user interface is ready to be tested. Based on that, our experiments also emphasize on the reproducibility: all the data and settings are open for readers. Moreover, as the user feedback indicates, the algorithm/software is already being used by a wide range of users.
Future work includes exploring more choices for the image features, such as Fourier/wavelet descriptors. We plan to incorporate shape priors for the multiple targets. Combined with the contour interaction, this is expected to further improve our results. Moreover, the user interaction can also be improved: Currently the intensity homogeneity and boundary smoothness in the multi-object segmentation are constant over all the contours for all the targets, and this limitation is due to the fact that the number of objects are dynamically computed from the user drawn label image, so it is difficult to know that in advance and provide the same number of slide bars on the control panel. We need to further improve this problem so individual contours can be controlled in a more flexible manner.
-
.
provide an open sourced, graphically user-interactive software for multiple object segmentation in 3D image
-
.
propose an active contour segmentation algorithm based on conformal area derived from robust statistics
-
.
propose an multiple active contour evolution framework with mutual exclusion criteria
Acknowledgments
The authors would like to thank the anonymous reviewers for their very valuable suggestions/comments, which we believe substantially improved the manuscript. We would thank Steve Pieper, Andrey Fedorov, and Katie Hayes for their help in 3D Slicer programming. This work was supported in part by grants from NSF, AFOSR, ARO, as well as by a grant from NIH (NAC P41 RR-13218) through Brigham and Women’s Hospital. This work was also supported by the NIH grant RO1 MH82918. This work is part of the National Alliance for Medical Image Computing (NAMIC), funded by the National Institutes of Health through the NIH Roadmap for Medical Research, Grant U54 EB005149. Information on the National Centers for Biomedical Computing can be obtained from http://nihroadmap.nih.gov/bioinformatics
Footnotes
Publisher's Disclaimer: This is a PDF file of an unedited manuscript that has been accepted for publication. As a service to our customers we are providing this early version of the manuscript. The manuscript will undergo copyediting, typesetting, and review of the resulting proof before it is published in its final citable form. Please note that during the production process errors may be discovered which could affect the content, and all legal disclaimers that apply to the journal pertain.
Contributor Information
Yi Gao, Email: gaoyi@bwh.harvard.edu.
Ron Kikinis, Email: kikinis@bwh.harvard.edu.
Sylvain Bouix, Email: sylvain@bwh.harvard.edu.
Martha Shenton, Email: shenton@bwh.harvard.edu.
Allen Tannenbaum, Email: tannenba@bu.edu.
References
- Boykov Y, Funka-Lea G. Graph cuts and efficient nd image segmentation. International Journal of Computer Vision. 2006;70:109–131. [Google Scholar]
- Boykov Y, Jolly M. Interactive graph cuts for optimal boundary & region segmentation of objects in nd images. IEEE ICCV, IEEE; 2001. pp. 105–112. [Google Scholar]
- Boykov Y, Kolmogorov V. Computing geodesics and minimal surfaces via graph cuts. IEEE ICCV, IEEE; 2003. pp. 26–33. [Google Scholar]
- Boykov Y, Kolmogorov V. An experimental comparison of min-cut/max-flow algorithms for energy minimization in vision. IEEE Transactions on Pattern Analysis and Machine Intelligence. 2004;26:1124–1137. doi: 10.1109/TPAMI.2004.60. [DOI] [PubMed] [Google Scholar]
- Bradski G. The OpenCV Library. Dr. Dobb’s Journal of Software Tools. 2000 [Google Scholar]
- Brox T, Weickert J. Level set segmentation with multiple regions. IEEE Transactions on Image Processing. 2006;15:3213. doi: 10.1109/tip.2006.877481. [DOI] [PubMed] [Google Scholar]
- Caselles V, Kimmel R, Sapiro G. Geodesic active contours. International Journal of Computer Vision. 1997;22:61–79. [Google Scholar]
- Chan T, Vese L. Active contours without edges. IEEE Transactions on Image Processing. 2001;10:266–277. doi: 10.1109/83.902291. [DOI] [PubMed] [Google Scholar]
- Criminisi A, Sharp T, Blake A. Geos: Geodesic image segmentation. Proceedings of the 10th European Conference on Computer Vision, Springer-Verlag; 2008. pp. 99–112. [Google Scholar]
- Gao Y, Tannenbaum A, Kikinis R. Lecture Notes in Computer Science, 2011. Volume 6533/2011. MICCAI 2010 Medical Computer Vision Workshop; 2011. Simultaneous Multi-Object Segmentation using Local Robust Statistics and Contour Interaction; pp. 195–203. [Google Scholar]
- Grady L. Random walks for image segmentation. IEEE Transactions on Pattern Analysis and Machine Intelligence. 2006;28:1768. doi: 10.1109/TPAMI.2006.233. [DOI] [PubMed] [Google Scholar]
- Huber P, Ronchetti E. Robust statistics. Wiley-Blackwell; 2009. [Google Scholar]
- Ibanez L, Schroeder W, Ng L, Cates J, et al. The ITK software guide. Kitware. 2003 [Google Scholar]
- Kass M, Witkin A, Terzopoulos D. Snakes: Active contour models. International Journal of Computer Vision. 1988;1:321–331. [Google Scholar]
- Kichenassamy S, Kumar A, Olver P, Tannenbaum A, Yezzi A. Gradient flows and geometric active contour models. IEEE ICCV; 1995. p. 810. [Google Scholar]
- Kichenassamy S, Kumar A, Olver P, Tannenbaum A, Yezzi A. Conformal curvature flows: from phase transitions to active vision. Archive for Rational Mechanics and Analysis. 1996;134:275–301. [Google Scholar]
- Kolmogorov V, Zabin R. What energy functions can be minimized via graph cuts? IEEE Transactions on Pattern Analysis and Machine Intelligence. 2004;26:147–159. doi: 10.1109/TPAMI.2004.1262177. [DOI] [PubMed] [Google Scholar]
- Lankton S, Tannenbaum A. Localizing Region-Based Active Contours. IEEE Transactions on Image Processing. 2008;17:2029–2039. doi: 10.1109/TIP.2008.2004611. [DOI] [PMC free article] [PubMed] [Google Scholar]
- Li K, Wu X, Chen D, Sonka M. Optimal surface segmentation in volumetric images-a graph-theoretic approach. IEEE Transactions on Pattern Analysis and Machine Intelligence. 2006;28:119–134. doi: 10.1109/TPAMI.2006.19. [DOI] [PMC free article] [PubMed] [Google Scholar]
- Li Y, Sun J, Tang C, Shum H. Lazy snapping. ACM Transactions on Graphics; 2004. pp. 303–308. [Google Scholar]
- Malladi R, Sethian J, Vemuri B, et al. Shape modeling with front propagation: A level set approach. IEEE Transactions on Pattern Analysis and Machine Intelligence. 1995;17:158–175. [Google Scholar]
- McEachen J, Duncan J. Shape-based tracking of left ventricular wall motion. IEEE Transactions on Medical Imaging. 2002;16:270–283. doi: 10.1109/42.585761. [DOI] [PubMed] [Google Scholar]
- Michailovich O, Rathi Y, Tannenbaum A. Image segmentation using active contours driven by the bhattacharyya gradient flow. IEEE Transactions on Image Processing. 2007;16:2787. doi: 10.1109/tip.2007.908073. [DOI] [PMC free article] [PubMed] [Google Scholar]
- NA-MIC. Brain data set. 2011a http://www.na-mic.org/Wiki/images/d/d6/RSS_Grayscale.nrrd. [Google Scholar]
- NA-MIC. Brain data set label image. 2011b http://www.na-mic.org/Wiki/images/4/44/RSS_Grayscale-label.nrrd. [Google Scholar]
- NA-MIC. Brain data set multi-label image. 2011c http://www.na-mic.org/Wiki/images/4/48/MORSS_Grayscale-multilabel.nrrd. [Google Scholar]
- OsiriX. Dicom sample image sets. 2011a http://pubimage.hcuge.ch.8080/DATA/CARDIX.zip. [Google Scholar]
- OsiriX. Downsampled cardix data set. 2011b http://www.na-mic.org/Wiki/images/b/bb/RSS_CARDIX-sub2.nrrd. [Google Scholar]
- OsiriX. Label image multiple target. 2011c http://www.na-mic.org/Wiki/images/f/f6/MORSS_CARDIX-sub2-multilabel.nrrd. [Google Scholar]
- OsiriX. Label image single target. 2011d http://www.na-mic.org/Wiki/images/a/a8/RSS_sub2_cardix_LVlabel.nrrd. [Google Scholar]
- Palmer S. Vision science: Photons to phenomenology. MIT press; 1999. [Google Scholar]
- Paragios N. A level set approach for shape-driven segmentation and tracking of the left ventricle. IEEE Transactions on Medical Imaging. 2003;22:773–776. doi: 10.1109/TMI.2003.814785. [DOI] [PubMed] [Google Scholar]
- Pichon E, Tannenbaum A, Kikinis R. A statistically based flow for image segmentation. Medical image analysis. 2004;8:267–274. doi: 10.1016/j.media.2004.06.006. [DOI] [PMC free article] [PubMed] [Google Scholar]
- Pieper S, Halle M, Kikinis R. IEEE ISBI, IEEE; 2004. 3D Slicer; pp. 632–635. [Google Scholar]
- Rother C, Kolmogorov V, Blake A. ACM Transactions on Graphics, ACM; 2004. Grabcut: Interactive foreground extraction using iterated graph cuts; pp. 309–314. [Google Scholar]
- Shi J, Malik J. Normalized cuts and image segmentation. IEEE Transactions on Pattern Analysis and Machine Intelligence. 2000;22:888–905. [Google Scholar]
- Tsai A, Yezzi A, Wells W, Tempany C, Tucker D, Fan A, Grimson W, Willsky A. A shape-based approach to the segmentation of medical imagery using level sets. IEEE Transactions on Medical Imaging. 2003;22:137–154. doi: 10.1109/TMI.2002.808355. [DOI] [PubMed] [Google Scholar]
- University of Utah SCI. Seg3D: Volumetric Image Segmentation and Visualization. Scientific Computing and Imaging Institute; 2010. Seg3D. [Google Scholar]
- Vese L, Chan T. A multiphase level set framework for image segmentation using the Mumford and Shah model. International Journal of Computer Vision. 2002;50:271–293. [Google Scholar]
- Whitaker R. A level-set approach to 3D reconstruction from range data. International Journal of Computer Vision. 1998;29:231. [Google Scholar]
- Yan P, Shen W, Kassim A, Shah M. Segmentation of neighboring organs in medical image with model competition. MICCAI. 2005:270. doi: 10.1007/11566465_34. [DOI] [PubMed] [Google Scholar]
- Yang J, Staib L, Duncan J. Neighbor-constrained segmentation with level set based 3-D deformable models. IEEE Transactions on Medical Imaging. 2004a;23:940. doi: 10.1109/TMI.2004.830802. [DOI] [PMC free article] [PubMed] [Google Scholar]
- Yang Y, Tannenbaum A, Giddens D, Coulter W. Knowledge-based 3D segmentation and reconstruction of coronary arteries using CT images. IEEE EMBS; 2004b. pp. 1664–1666. [DOI] [PubMed] [Google Scholar]
- Yezzi A, Kichenassamy S, Kumar A, Olver P, Tannenbaum A. A geometric snake model for segmentation of medical imagery. IEEE Transactions on Medical Imaging. 1997;16:199–209. doi: 10.1109/42.563665. [DOI] [PubMed] [Google Scholar]
- Yezzi A, Tsai A, Willsky A. IEEE ICCV; 1999. A statistical approach to snakes for bimodal and trimodal imagery; pp. 898–903. [Google Scholar]
- Yushkevich P, Piven J, Hazlett H, Smith R, Ho S, Gee J, Gerig G. User-guided 3D active contour segmentation of anatomical structures: significantly improved efficiency and reliability. Neuroimage. 2006;31:1116–1128. doi: 10.1016/j.neuroimage.2006.01.015. [DOI] [PubMed] [Google Scholar]
- Zhao H, Chan T, Merriman B, Osher S. A Variational Level Set Approach To Multiphase Motion. Journal of computational physics. 1996;127:179–195. [Google Scholar]
- Zhu S, Yuille A. Region competition: Unifying snakes, region growing, and bayes/MDL for multiband image segmentation. IEEE Transactions on Pattern Analysis and Machine Intelligence. 1996;18:884. [Google Scholar]


