Abstract
The deformation of the lung during inspiration and expiration involves regional variations in volume change and orientational preferences. Studies have reported techniques for measuring the displacement field in the lung based on imaging or image registration. However, means of interpreting all the information in the displacement field in a physiologically relevant manner is lacking. We propose three indices of lung deformation that are determinable from the displacement field: the Jacobian – a measure of volume change, the anisotropic deformation index – a measure of the magnitude of directional preference in volume change, and a slab-rod index – a measure of the nature of directional preference in volume change. To demonstrate the utility of these indices, they were determined for six human subjects using deformable image registration on static CT images, registered from FRC to TLC. Volume change was elevated in the inferior-dorsal region as should be expected for breathing in the supine position. The anisotropic deformation index was elevated in the inferior region owing to proximity to the diaphragm and in the lobar fissures owing to sliding. Vessel regions in the lung had a significantly rod-like deformation compared to the whole lung. Compared to upper lobes, lower lobes exhibited significantly greater volume change (19.4% and 21.3% greater in the right and left lungs on average; p<0.005) and anisotropy in deformation (26.3% and 21.8% greater in the right and left lungs on average; p<0.05) with remarkable consistency across subjects. The developed deformation indices lend themselves to exhaustive and physiologically intuitive interpretations of the displacement fields in the lung determined through image-registration techniques or finite element simulations.
Keywords: Lung, Deformation, Strain, Anisotropy, Registration
Introduction
Volume change is the primary metric for assessing lung expansion and its health. But volume change in the lungs is not regionally homogeneous (Olson and Rodarte 1984). The practice of image-guided radiotherapy brought a need for regional characterizations of lung deformations as lung pathology and the effects of interventions (radiological or otherwise) are essentially region-specific. Methods have been developed to determine regional volume change from the displacement field using deformable image registration and MRI-grid tagging (Reinhardt et al. 2008; Cai et al. 2009). Finite element simulations of lung deformation also yield a displacement field and, consequently, regional volume change.
Regional deformation of the lung during inspiration and expiration is more than just volume change. Volume change may also have orientational preference – anisotropy of deformation (West and Matthews 1972; Rodarte et al. 1985). Volume change and deformation anisotropy are independent quantities as a region may undergo no volume change, but still have deformed significantly – say, when the lengthening in one orientation is compensated by contraction along another orientation. Devoid of orientational preference, regional volume change alone may not do full justice to characterization of lung deformation, and this may have clinical implications. For example, consider two cases: one, a lung with fibrosis at its inferior region (close to the diaphragm); two, a healthy lung but with poorly functioning diaphragm. In both cases, the volume change may conceivably be lower at the inferior regions. But the anisotropy of deformation will likely be significantly affected only in the latter. Or perhaps, regions closest to the diaphragm are likely to experience more volume change in the vertical orientation, or regions closest to the heart may be more constrained from expanding normal to the heart.
In classical mechanics, deformation of structures is characterized by the regional distribution of a strain or stretch tensor. Previous reports have addressed lung deformation using traditional methods employed in mechanics. West et al. (West and Matthews 1972) computed and reported lung regional strains along the anatomical orientations using an idealized 3D finite element model under the influence of gravity. They made visual observations of shape changes that occurred in the inferior portion of the model, but stopped short of quantifying it. Rodarte et al. (Rodarte et al. 1985) used parenchymal markers to quantify regional strains along the anatomical orientations. A comparison of strain magnitudes revealed a dominant transverse strain throughout the lung, though mean strains tended to be greater in the lower lobes. Napadow et al. (Napadow et al. 2001) quantified strains using spin-inversion MRI. In addition to reporting strains along the standard anatomical orientations, they also reported the difference between strains in the coronal and sagittal axes – noted as in-plane shear strain. Cai et al. (Cai et al. 2009) used MRI grid-tagging to report regional ventilation and principal strains in two dimensions. Others have estimated point-wise displacements in the lung, but are often concerned only with accuracy of registration (verified using landmark error) which can be used for image-guided radiotherapy (Reinhardt et al. 2007; van Beek and Hoffman 2008; Brock 2010). While strains entirely capture the deformation, use of strains themselves (be it principal strains or strain components based on an intuitive coordinate system) to interpret the nature of lung deformation may not be the best approach for a few reasons. One, strain components lump the effect of volume change with the preferential directionalities involved in volume change rendering independent interpretations difficult. Two, strains aren’t physiologically intuitive within the context of lung deformation which is essentially about volume change. Three, the lungs do not have an intuitive coordinate system based on which individual strain components could be interpreted.
We submit that, regional lung deformation is best interpreted by indices that independently capture different aspects of lung deformation. The objective of this work is to develop indices of lung deformation that independently capture volume change and the level and nature of orientational preferences that occur in volume change; and that these indices be intuitive and relevant to the physiology of lung function. Such indices will permit future studies on regional lung deformation (both experimental and computational) to make physiologically relevant interpretations from displacement fields determined by image registration based measurements or by numerical modeling.
Methods
Development of indices
We propose quantification of regional lung deformation using three independent measures determined from the displacement field, such that their physical meanings accommodate the essentially volumetric nature of deformation in the lungs. The indices are volume change (J), an anisotropic deformation index (ADI) and a slab-rod index (SRI) – defined and explained subsequently.
To understand the rationale and definitions behind these indices, consider that a point at position X in a body moves to a position x resulting in a displacement vector, u = x − X. The deformation gradient tensor, F, describes the continuum deformation from the point-wise displacements.
F may be decomposed into a rotation tensor R and a stretch tensor U, Equation 2. Since the rotation tensor is orthogonal, it may be factored out by squaring F.
The eigenvalues of U are the principal stretches, λ1, λ2, and λ3. From the relation in Equation 3, the principal stretches may be calculated by Equation 4.
Physically, if we consider an infinitesimal cube at a given point stretching to a rectangular cuboid (in the general case), the principal stretches are the ratio of the deformed length to the undeformed length in each of its three essential dimensions. The eigenvectors of U represent the orientations along which the principal stretches occur. Together, the principal stretches (eigenvalues of U) and their orientations (eigenvectors) exhaustively capture regional lung deformation. But as with principal strains, principal stretches themselves do not quite help interpret the nature of lung deformation. Instead, the proposed indices (J, ADI and SRI) describe the relationships among the stretches with relevance to lung volumetric expansion. With three independent stretch ratios, there must be three independent indices of lung deformation for completeness.
The first index of lung deformation is the widely used Jacobian of deformation (J), a measure of volume change (Keall et al. 2005; Reinhardt et al. 2008) which in terms of the stretch ratios is,
J is the ratio of the current volume to reference volume for a given region. J varies from 0 to ∞. It can be equal to 1 corresponding to no volume change, less than 1 corresponding to reduction in volume (net contraction), or greater than 1 corresponding to an increase in volume (net expansion). J is not a new index we introduce, but rather an existing index, which we retain here as it captures regional volume change.
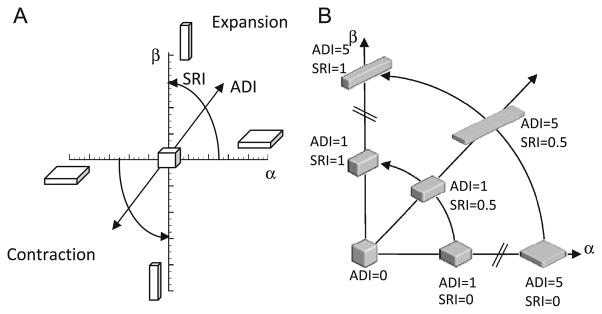
The second and third indices are derived from a shape-change spectrum graph. They capture the level and nature of orientational preference in volume change. Defining the principal stretches such that λ1 ≥ λ2 ≥ λ3 a plot may be created with α on the x-axis and β on the y-axis (see Equations 6 and 7).
This graph and the indices derived thereof is conceptually similar to the Zingg plot used in geology literature for characterizing pebble shapes (Zingg 1935). The plot was later adopted by Flinn for characterization of the deformation of rocks (Flinn 1956; Flinn 1962). We adopt these approaches, but with some modifications to suit our context. As opposed to characterizing shape, where the principal axes are all positive, deformation can be thought to have sign (expansion ‘+’, contraction ‘−’). When data points are plotted on this graph (see Figure 1A), for all regions within the lung where principal stretches are known, those regions undergoing volumetric expansion fall in the first quadrant and those undergoing volumetric contraction fall in the third quadrant. It should be noted that x and y axes are independent of volume change.
Figure 1.
(A) Illustration of the shape change spectrum graph. Anisotropic deformation index (ADI) corresponds to the radius of a point from the origin. SRI corresponds to the angle from the x-axis. J is constant over the entire graph but regions undergoing expansion and contraction are separated into the first and third quadrants respectively. (B) Illustration of the meanings of the shape change indices by placing a deformed cube at different positions on the shape spectrum. Volume change is held constant. In human subjects studied, the ADI ranged from 0 to 2.4 (5th to 95th percentile) and SRI from 0 to 1.
The origin represents regions that underwent perfectly isotropic volume change (λ1 = λ2 = λ3). The farther a point is from the origin, the more anisotropic the deformation. Thus, the distance of a data point from the origin captures the magnitude of anisotropy and is defined as the anisotropic deformation index (ADI). ADI ranges from 0 to ∞ where 0 indicates perfectly isotropic deformation.
In addition to the magnitude of anisotropic deformation, the nature of anisotropy – i.e., whether the volume change is predominant along one or two orientations – is captured by the angular position on this graph. Thus, points nearer to the y-axis (where ; stretching occurs mostly in one orientation) represent regions where a cube would turn into a prolate cuboid (rod-like) while points nearer the x-axis (where ; stretching occurs mostly in two orientations) represent regions where a cube turns into an oblate cuboid (slab-like). The angular position therefore captures where a particular region falls within the spectrum of shapes between these extremes. The angular position of a data point on this graph, normalized to a 0 to 1 range, thus captures the nature of anisotropy and defined as the slab-rod index (SRI).
Figure 1B demonstrates how the deformed cuboids would look at different positions on the shape spectrum; J is held constant at 1 and plotted in the 1st quadrant.
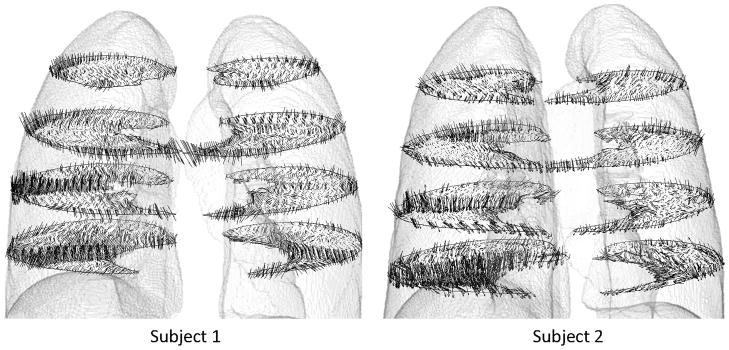
J, ADI and SRI are indices with independent physical meanings that describe both the volume change and orientational preferences to it. A final piece of information, that when accounted for would make the characterization of lung deformation exhaustive, is the orientations of the principal stretches (eigenvectors of U). For ease of interpretation, it may be worthwhile to study the orientation of the maximum principal stretch alone, when considering expansion, as this is the orientation of primary deformation during expansion. It is best perceived visually by plotting the orientation vectors along maximum principal stretch on a finite number of sectional slices of the lung. Because the orientation of the maximum principal stretch is of little consequence when ADI is low (isotropic), it is prudent to weight the maximum principal stretch vector lengths with ADI.
Evaluation of indices in human lungs
All data were gathered under a protocol approved by our institutional review board. Pairs of volumetric CT data sets from six normal human subjects in supine orientation were used in this study. Of the six subjects, four were male and two were female. Subject age ranged from 22–37 years with a mean of 27.3 years. Functional residual capacity (FRC) lung volumes ranged from 2.67–3.75 liters with a mean of 3.22 liters. The six patients were non-smokers with no recorded exclusion criteria (recent respiratory infection, medication other than contraception, cardiopulmonary abnormalities, pregnancy or breast feeding, diabetes mellitus, positive PPD or history of tuberculosis, CT scan within the last year). Each image pair was acquired with a Siemens Sensation 64 multi-detector row CT scanner (Forchheim, Germany) during breath-holds near FRC and total lung capacity (TLC) in the same scanning session. Voxel dimensions were approximately 0.6×0.6 mm in the axial plane with a section spacing of 0.5 mm along the longitudinal axis. Linear elastic image registration, parameterized by a uniform cubic B-spline function, was used to register the static scan image pairs to obtain a 3D displacement field. Minimization of a cost function was used to obtain reasonable registration results. The cost function minimized the sum of squared tissue volume difference (Yin et al. 2009) while incorporating a Laplacian smoothing filter. Detailed information on the registration process may be found in Cao et al. (Cao et al. 2010). The distribution of voxel-wise displacements were then used to estimate the regional distribution of principal stretches and J, ADI and SRI as previously described. Contour plots were constructed to visualize distribution patterns of the three indices for Subjects 1 and 2. A three-dimensional vector plot was used to visualize the orientation of the maximum principal stretch weighted by ADI. Lobar indicial statistics were evaluated for all six subjects. For post-processing, the parenchyma was segmented first using Hu et al.(Hu et al. 2001), followed by an automatic lobe segmentation algorithm defined by Ukil et al. (Ukil and Reinhardt 2009). Further, since vessel regions may be expected to have a particularly anisotropic deformation, the vessels were segmented and analyzed separately using the Pulmonary Workstation 2.0 (VIDA Diagnostics, Inc., Iowa City, IA) based on methods previously reported by our group (Masutani et al. 2001). Vessel data was available for Subjects 1 and 2.
Results
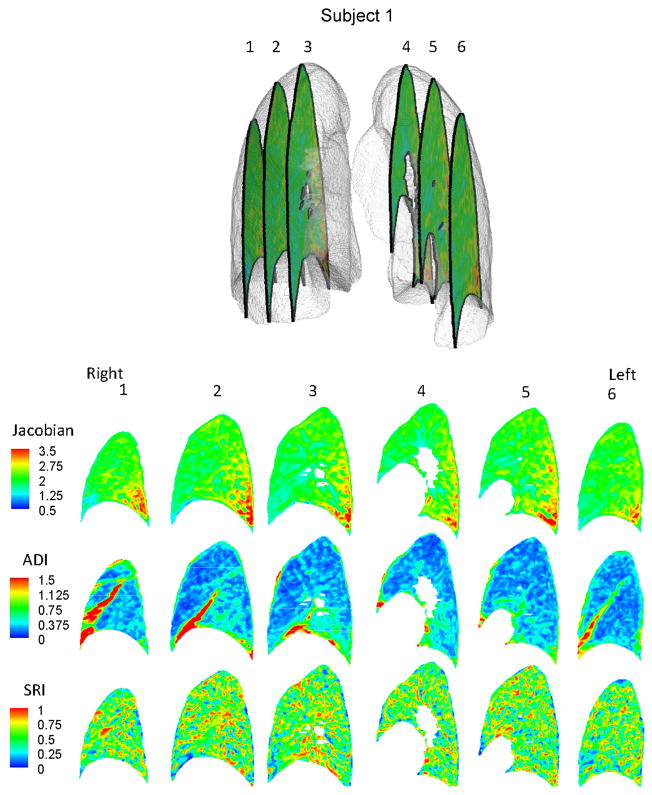
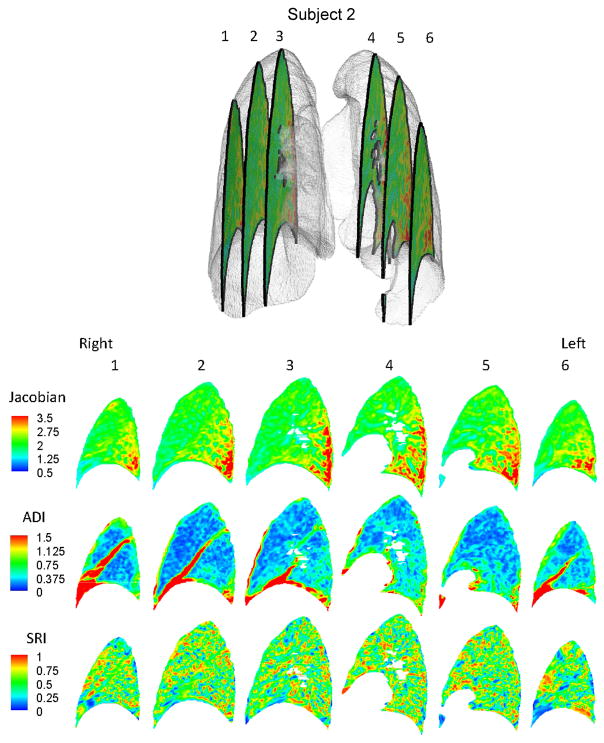
Regional variations exist in J, ADI and SRI for subjects as seen on sequential sagittal slices from right to left (see Figures 2 and 3). Regionally, J is elevated at the inferior and dorsal ends of the lungs. ADI is elevated at the inferior region close to the diaphragm and also roughly along lobar fissures. SRI is not elevated predominantly in any particular localized region, but rather appears elevated at various localized spots in the lung. The maximum principal stretch vectors weighted with ADI (vector length=0 at ADI=0) are plotted on transverse slices of the lung (Figure 4). At the inferior region of the lung, the vectors were longer (higher ADI) and oriented roughly toward the diaphragm surface suggestive of a preferential deformation along that orientation. The vectors further indicate that regions farther from the diaphragm generally do not tend to expand/contract in any one preferential orientation save a few regions near the chest wall boundary.
Figure 2.
Contour plots for Subject 1 showing the distribution of J, ADI and SRI on 6 sagittal slices from patient right to left.
Figure 3.
Contour plots for Subject 2 showing the distribution of J, ADI and SRI on 6 sagittal slices from patient right to left.
Figure 4.
Vector plot of maximum principal stretch orientation weighted with ADI. For clarity the vectors are plotted on 4 transverse slices. Only a fraction of the vectors in a given slice is shown for clarity.
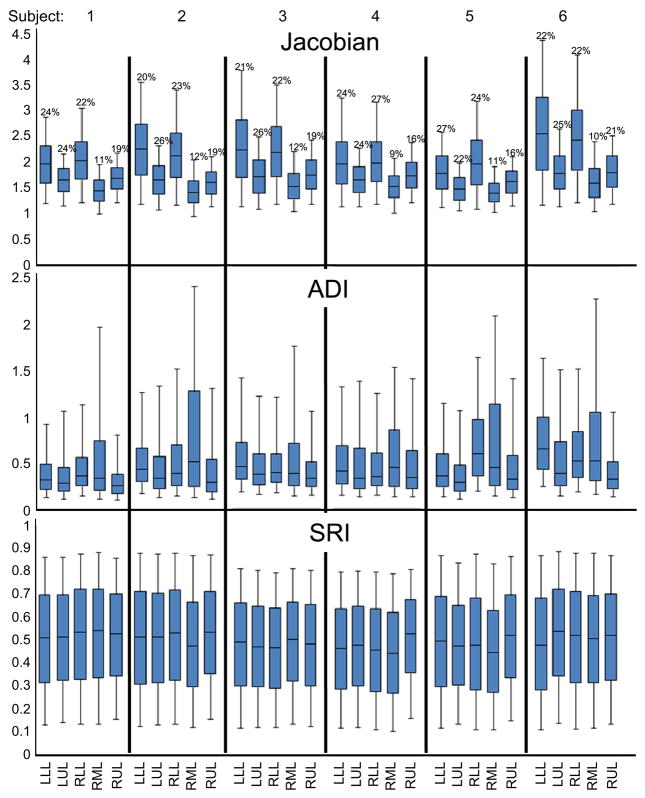
Indicial ranges were stratified on a lobar basis (see Figure 5). J was highest in the lower lobes and least in the right middle lobe with a remarkable consistency across subjects. ADI was highest in the right middle lobe and lowest in the upper lobes also consistently across subjects. No consistent trend was qualitatively identified for SRI between lobes. A paired student t-test showed that the medians of J and ADI in the lower lobes were greater than that for the corresponding upper lobes with statistical significance. J in the lower lobes was 19.4% and 21.3% greater than the upper lobes in the right (p<0.005) and left (p<0.005) lungs respectively (see Figure 5). Similarly, ADI in the lower lobes was 26.3% and 21.8% greater than in the upper lobes in right (p<0.05) and left (p<0.05) lungs respectively.
Figure 5.
Box plots of the distribution of J, ADI and SRI in the six study subjects stratified by lobe. The bounds of the box represent the 25th and 75th percentile; the horizontal line inside the box represents the median; and the error bars extend from the 5th to 95th percentile. The percentage above each box represents lobe volume as a fraction of the total lung volume at FRC for that subject. LLL – left lower lobe; LUL – left upper lobe; RLL – right lower lobe; RML – right middle lobe; RUL – right upper lobe. The sample sizes for the quartiles are roughly the number of voxels in the particular lung lobe and range between 175K and 700K.
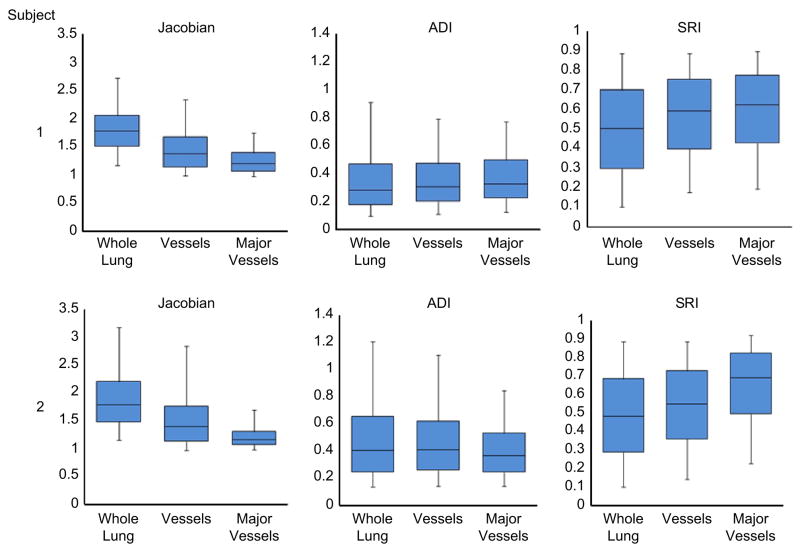
The indices were also evaluated for differences between the whole lung, all vessels, and only large vessels (roughly less than or equal to 4th–5th generation), (see Figure 6). When compared to the whole lung, J was substantially lower in the large vessels (32% and 35% lower medians for Subjects 1 and 2 respectively) and moderately lower in all vessels (23% and 22%). Similarly, compared to the whole lung, SRI was substantially elevated in major vessels (23% and 43% higher medians for Subjects 1 and 2 respectively) and moderately elevated in all vessel regions (17% and 14%). Differences in ADI, if they exist, were not noticeable.
Figure 6.
Box plots showing the distribution of J, ADI and SRI throughout the lung, in the vessels and in the major vessels (roughly the vessels of the 5th generation or lesser) only. The bounds of the box represent the 25th and 75th percentile; the horizontal line inside the box represents the median; and the error bars extend from the 5th to 95th percentile. The sample sizes for the quartiles are roughly the number of voxels in the associated data set and range between 33K (major vessels) and 2.7M (whole lung).
Discussion
Lung parenchymal deformation is primarily about local volume change. It can vary regionally, especially in the presence of localized pathologies. A complete description of local volume change must consider the amount of volume change as well as orientational preferences in volume change.
Conventionally, lung deformation is characterized by the amount of tissue ‘stretching’. But note that the term stretch may be used loosely when referencing the lung. Mechanically, tissue stretch is often associated with λ1. However, often lung tissue stretch refers to large inflation of the lung – that is three-dimensional expansion (large J, not large λ1 (Matthay et al. 2002; Quinn et al. 2002; Bailey et al. 2003; Chu et al. 2004). Reporting principal stretches alone leaves out physiologically relevant information and can lead to misinterpretations of lung function. While less prevalent, limitations of reporting one-dimensional shear indices instead of ADI is similar to the limitations in reporting λ1 instead of J. We proposed and demonstrated a set of regional indices that separates lung deformation into volume change and shape change characteristics in a physiologically intuitive manner. As deformation is three dimensional, complete quantification necessitates the use of three independent indices.
In the six human subjects evaluated in this study, the volume change index (J) was elevated at the dorsal, inferior region suggestive of a localized region of high volume change (Figures 2 and 3). The diaphragm is the primary driver of lung deformation and hence, the region closest to it – the inferior region – is likely experiencing elevated volume change compared to superior regions. Also, dorsal regions experience more volume change than ventral regions. These observations are all consistent with expected volume change for subjects in the supine position (Reinhardt et al. 2008) suggesting that the registration methods adopted are reasonable and the volume change index (J) captures that essential aspect of lung function. Only subjects in the supine position were analyzed from FRC to TLC. The distribution of J has been shown to change with patient orientation (West and Matthews 1972; Marcucci et al. 2001; Simon 2005) and at different stages of breathing (Ding 2008) therefore, it is likely that all indices will observe different distributions at different patient orientations and stages of breathing.
The fact that ADI was elevated in inferior regions is not unexpected when considering the boundary conditions. In the superior lung, the chest wall and diaphragm may have near equal contributions on expansion while in the inferior lung the vertically acting diaphragm is the primary driver of deformation. Elevated ADI values are also observed along the fissures where lobar sliding is expected (Ding et al. 2009). But since our methods use a continuum approach, sliding is reflected as a very anisotropic deformation resulting in an elevated ADI at the fissures. Fissure sliding may be the reason for elevated ADI in the right middle lobes which have a greater surface area experiencing sliding compared to its volume.
The contour plots yield no identifiable regional trends in SRI. However, comparison of deformation indices between vessel regions and the whole lung suggest that the former deform differently (see Figure 6-boxplots). Vessels are expected to undergo lower volume change compared to parenchyma during lung expansion and this is reflected in the lowered J for vessel regions. It is in this comparison that the utility of SRI becomes apparent. SRI places anisotropic deformation on the spectrum between rod-like (high) to slab-like (low) volume change. Conceivably, during lung expansion, the cylindrical vessels likely deform more by extending in length than by dilating radially (i.e., rod-like expansion). Such a rod-like expansion of vessel structures will result in high SRI. Some caution is warranted in interpreting SRI for contracting regions where the maximum principal strain is likely the least negative and has a smaller absolute value than the minimum principal strain, providing the motivation for separating expanding from contracting lung regions. In the contracting case a rod-like shape will result from contracting primarily in two orientations while a disk-like shape is from contracting in one orientation. Therefore, interpretation of SRI needs to be reversed when one considers a primarily contracting volume change such as during expiration. In this study, we have confined to reporting deformation from FRC to TLC where contracting regions are a small fraction of expanding regions and, therefore, this issue does not impact our interpretations. Unlike SRI, ADI in vessels was relatively similar, which highlights the importance of capturing anisotropy using two independent indices. SRI, a measure of the nature of anisotropy, uniquely captures phenomenon in deformation that ADI, a measure of the magnitude of anisotropy, does not capture. One remarkable observation in this study was the consistency across subjects in the lobe-specific volume change (Figure 5) – especially in J – even though the FRC-TLC total lung volume change differed by about 40% between subjects (2.67 L to 3.76 L).
With increasing improvements in registration techniques, there will be increasing fidelity in acquiring regional displacements within the lung. The proposed indices of regional lung deformation – J, ADI and SRI – and the orientation of maximum principal stretch allow for physiological interpretation of these displacement fields. Lung expansion is a result of lung tissue properties (parenchymal tissue stiffness, for e.g.) and boundary conditions (diaphragm and chest wall motion). Decoupling the causes (material properties and boundary effects) from their resulting effects (changes in observed deformation) can provide insights into disease detection and the effect of diseases on lung function. These indices may permit approximately decoupling these two determinants of lung expansion through the use of finite element simulations.
Acknowledgments
This work was supported in part by NIH grant HL079406 (to JMR).
Footnotes
Conflict of Interest
Dr. Reinhardt is a founder and shareholder of VIDA Diagnostics, Inc.
Publisher's Disclaimer: This is a PDF file of an unedited manuscript that has been accepted for publication. As a service to our customers we are providing this early version of the manuscript. The manuscript will undergo copyediting, typesetting, and review of the resulting proof before it is published in its final citable form. Please note that during the production process errors may be discovered which could affect the content, and all legal disclaimers that apply to the journal pertain.
References
- Bailey TC, Martin EL, Zhao L, Veldhuizen RA. High oxygen concentrations predispose mouse lungs to the deleterious effects of high stretch ventilation. J Appl Physiol. 2003;94(3):975–82. doi: 10.1152/japplphysiol.00619.2002. [DOI] [PubMed] [Google Scholar]
- Brock KK. Results of a multi-institution deformable registration accuracy study (MIDRAS) Int J Radiat Oncol Biol Phys. 2010;76(2):583–96. doi: 10.1016/j.ijrobp.2009.06.031. [DOI] [PubMed] [Google Scholar]
- Cai J, Sheng K, Benedict SH, Read PW, Larner JM, Mugler JP, 3rd, de Lange EE, Cates GD, Jr, Wilson Miller G. Dynamic MRI of Grid-Tagged Hyperpolarized Helium-3 for the Assessment of Lung Motion During Breathing. Int J Radiat Oncol Biol Phys. 2009 doi: 10.1016/j.ijrobp.2009.03.051. [DOI] [PMC free article] [PubMed] [Google Scholar]
- Cao K, Ding K, Christensen GE, Reinhardt JM. Tissue volume and vesselness measure preserving nonrigid registration of lung CT images. SPIE 2010 [Google Scholar]
- Chu EK, Whitehead T, Slutsky AS. Effects of cyclic opening and closing at low- and high-volume ventilation on bronchoalveolar lavage cytokines. Crit Care Med. 2004;32(1):168–74. doi: 10.1097/01.CCM.0000104203.20830.AE. [DOI] [PubMed] [Google Scholar]
- Ding K. Master’s thesis. University of Iowa; 2008. Registration-based regional lung mechanical analysis. [Google Scholar]
- Ding K, Yin Y, Cao K, Christensen GE, Lin CL, Hoffman EA, Reinhardt JM. Evaluation of lobar biomechanics during respiration using image registration. Med Image Comput Comput Assist Interv. 2009;12(Pt 1):739–46. doi: 10.1007/978-3-642-04268-3_91. [DOI] [PMC free article] [PubMed] [Google Scholar]
- Flinn D. On the Deformation of the Funzie Conglomerate, Fetlar, Shetland. Journal of Geology. 1956;64(5):480–505. [Google Scholar]
- Flinn D. On folding during three-dimensional progressive deformation. Quarterly Journal of the Geological Society. 1962;118(1–4):385–428. [Google Scholar]
- Hu S, Hoffman EA, Reinhardt JM. Automatic lung segmentation for accurate quantitation of volumetric X-ray CT images. IEEE Trans Med Imaging. 2001;20(6):490–8. doi: 10.1109/42.929615. [DOI] [PubMed] [Google Scholar]
- Keall PJ, Joshi S, Vedam SS, Siebers JV, Kini VR, Mohan R. Four-dimensional radiotherapy planning for DMLC-based respiratory motion tracking. Med Phys. 2005;32(4):942–51. doi: 10.1118/1.1879152. [DOI] [PubMed] [Google Scholar]
- Marcucci C, Nyhan D, Simon BA. Distribution of pulmonary ventilation using Xe-enhanced computed tomography in prone and supine dogs. J Appl Physiol. 2001;90(2):421–30. doi: 10.1152/jappl.2001.90.2.421. [DOI] [PubMed] [Google Scholar]
- Masutani Y, MacMahon H, Doi K. Automated segmentation and visualization of the pulmonary vascular tree in spiral CT angiography: an anatomy-oriented approach based on three-dimensional image analysis. J Comput Assist Tomogr. 2001;25(4):587–97. doi: 10.1097/00004728-200107000-00014. [DOI] [PubMed] [Google Scholar]
- Matthay MA, Bhattacharya S, Gaver D, Ware LB, Lim LH, Syrkina O, Eyal F, Hubmayr R. Ventilator-induced lung injury: in vivo and in vitro mechanisms. Am J Physiol Lung Cell Mol Physiol. 2002;283(4):L678–82. doi: 10.1152/ajplung.00154.2002. [DOI] [PubMed] [Google Scholar]
- Napadow VJ, Mai V, Bankier A, Gilbert RJ, Edelman R, Chen Q. Determination of regional pulmonary parenchymal strain during normal respiration using spin inversion tagged magnetization MRI. J Magn Reson Imaging. 2001;13(3):467–74. doi: 10.1002/jmri.1068. [DOI] [PubMed] [Google Scholar]
- Olson LE, Rodarte JR. Regional differences in expansion in excised dog lung lobes. J Appl Physiol. 1984;57(6):1710–4. doi: 10.1152/jappl.1984.57.6.1710. [DOI] [PubMed] [Google Scholar]
- Quinn DA, Moufarrej RK, Volokhov A, Hales CA. Interactions of lung stretch, hyperoxia, and MIP-2 production in ventilator-induced lung injury. J Appl Physiol. 2002;93(2):517–25. doi: 10.1152/japplphysiol.00570.2001. [DOI] [PubMed] [Google Scholar]
- Reinhardt JM, Christensen GE, Hoffman EA, Ding K, Cao K. Registration-derived estimates of local lung expansion as surrogates for regional ventilation. Inf Process Med Imaging. 2007;20:763–74. doi: 10.1007/978-3-540-73273-0_63. [DOI] [PubMed] [Google Scholar]
- Reinhardt JM, Ding K, Cao K, Christensen GE, Hoffman EA, Bodas SV. Registration-based estimates of local lung tissue expansion compared to xenon CT measures of specific ventilation. Med Image Anal. 2008;12(6):752–63. doi: 10.1016/j.media.2008.03.007. [DOI] [PMC free article] [PubMed] [Google Scholar]
- Rodarte JR, Hubmayr RD, Stamenovic D, Walters BJ. Regional lung strain in dogs during deflation from total lung capacity. J Appl Physiol. 1985;58(1):164–72. doi: 10.1152/jappl.1985.58.1.164. [DOI] [PubMed] [Google Scholar]
- Simon BA. Regional ventilation and lung mechanics using X-Ray CT. Acad Radiol. 2005;12(11):1414–22. doi: 10.1016/j.acra.2005.07.009. [DOI] [PubMed] [Google Scholar]
- Ukil S, Reinhardt JM. Anatomy-guided lung lobe segmentation in X-ray CT images. IEEE Trans Med Imaging. 2009;28(2):202–14. doi: 10.1109/TMI.2008.929101. [DOI] [PMC free article] [PubMed] [Google Scholar]
- van Beek EJ, Hoffman EA. Functional imaging: CT and MRI. Clin Chest Med. 2008;29(1):195–216. vii. doi: 10.1016/j.ccm.2007.12.003. [DOI] [PMC free article] [PubMed] [Google Scholar]
- West JB, Matthews FL. Stresses, strains, and surface pressures in the lung caused by its weight. J Appl Physiol. 1972;32(3):332–45. doi: 10.1152/jappl.1972.32.3.332. [DOI] [PubMed] [Google Scholar]
- Yin Y, Hoffman EA, Lin CL. Mass preserving nonrigid registration of CT lung images using cubic B-spline. Med Phys. 2009;36(9):4213–22. doi: 10.1118/1.3193526. [DOI] [PMC free article] [PubMed] [Google Scholar]
- Zingg T. Beitrag zur Schotteranalyse. Schweizerische Mineralogische und Petrologische Mitteilungen. 1935;15:39–140. [Google Scholar]


