Abstract
Purpose
To implement diffusion tensor imaging (DTI) protocol for visualization of peripheral nerves in human forearm.
Materials and Methods
This HIPAA-compliant study was approved by our institutional review board and written informed consent was obtained from 10 healthy participants. T1-and T2-weighted turbo spin echo with fat saturation, short tau inversion recovery (STIR), and DTI sequences with 21 diffusion encoding directions were implemented to acquire images of the forearm nerves with an 8 channel knee coil on a 3T MRI scanner. Identification of the nerves was based on T1-weighted, T2-weighted, STIR and DTI-derived fractional anisotropy (FA) images. Maps of the DTI derived indices, FA, mean diffusivity (MD), longitudinal diffusivity (λ//) and radial diffusivity (λ⊥) along the length of the nerves were generated.
Results
DTI-derived maps delineated the forearm nerves more clearly than images acquired with other sequences. Only ulnar and median nerves were clearly visualized on the DTI-derived FA maps. No significant differences were observed between the left and right forearms in any of the DTI-derived measures. Significant variation in the DTI measures was observed along the length of the nerve. Significant differences in the DTI measures were also observed between the median and ulnar nerves.
Conclusion
DTI is superior in visualizing the median and ulnar nerves in the human forearm. The normative data could potentially help distinguish normal from diseased nerves.
Keywords: diffusion tensor imaging, fractional anisotropy, mean diffusivity, peripheral nerves, human forearm
INTRODUCTION
Much effort has gone into the visualization of peripheral nerves by magnetic resonance imaging (MRI) as an adjunct investigative tool in clinic for diverse neuropathic conditions including traumatic nerve injuries (1–4). Civilian and combat trauma often results in serious injuries to the peripheral nerves and the victims are left with significant disability and morbidity. It is estimated that up to 5% of all admissions to level one trauma centers have a peripheral nerve injury (5). In general, injuries to the upper extremity are more common than those to the lower extremity, accounting for two thirds of all peripheral nerve injuries (5). There are no evidence- or consensus-based algorithms for use of MRI in clinical management of peripheral nerve disorders.
Magnetic resonance neurography (MRN) is a modification of the conventional MRI, found to be useful in direct imaging of the nerves (6–10). The basic idea of MRN is to enhance the nerve signal by suppressing the surrounding muscle, fluid, and fat. Fat-saturated (FatSat) heavily T2-weighted sequences and short tau inversion recovery (STIR) T2-weighted sequences are commonly used in MRN. Diffusion tensor imaging (DTI) exploits the greater water diffusion anisotropy in nerve compared to the surrounding tissues for improved visualization of nerves (11–18). DTI is exquisitely sensitive to subtle changes in tissue at the microstructural level. Various diffusion indices derived from DTI data, such as individual eigenvalues (λ1, λ2, λ3), longitudinal diffusivity (λ// = λ1), radial diffusivity (λ⊥= (λ2 + λ3)/2), mean diffusivity (MD), and fractional anisotropy (FA) are commonly used for quantitative characterization of nerve injuries.
Recent preclinical studies have suggested the utility of specific DTI parameters in assessing peripheral nerve injury and repair (19–21). For example, two separate studies showed that FA and parallel diffusivity decreased with nerve degeneration and recovered with nerve regeneration in sciatic nerve crush model (19, 20). If these preclinical findings were to be extended to patients with traumatic nerve injuries then one needs to have normative DTI measures in normal nerves. Since the traumatic nerve injuries are common in the upper extremity and particularly in the forearm segment, the current study focused on visualizing and quantifying normal human forearm nerves using DTI technology. Our study establishes the MRI protocol and normal range of DTI-derived quantitative parameters in median and ulnar nerves in the forearm. This normative data should help characterize diseased nerves.
MATERIALS AND METHODS
Subjects
This HIPAA compliant study was approved by our institutional review board. Ten healthy volunteers (five men and five women; median age, 26 years; range, 22–32 years), who have no evidence of neuropathic disorder by clinical examination, were recruited for this study after written informed consent. All the volunteers were right handed and underwent nerve imaging.
MRI Protocol
MRI scans were performed on a 3 T scanner (Achieva, Philips Medical Systems, Best, Netherlands). This scanner is equipped with 32 channel receiver and a gradient system that is capable of producing gradient amplitudes of 80mT/m with a slew rate of 200 T/m/s. An 8-channel phased array knee coil (INVIVO Corp, Orlando, FL) was used for data acquisition.
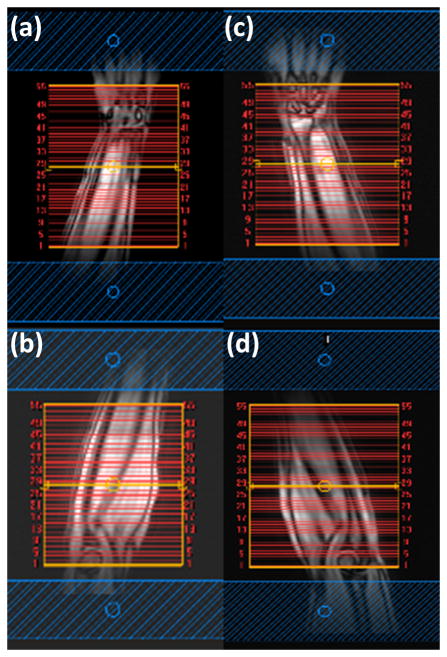
All volunteers were scanned in the prone position, with head first, arms above the head, and palm facing down. The scanned forearm was immobilized with cushions and bandages. The data was acquired without any gating. Following the acquisition of fast coronal localizer to position the image slice location and REgional Saturation Technique (REST) bands indicated in Fig 1 were applied to minimize flow artifacts. Axial images were acquired on both the left and right forearm, separately, but in the same session. The protocols included T1- weighted, fat suppressed T2- weighted STIR, and DTI. DTI was acquired on these volunteers with 21 diffusion gradient encoding directions with b=1000 s/mm2, bandwidth=23.6Hz/pixel, SENSE factor=2.0, partial sampling factor=0.76. The sequence parameters are summarized in Table 1. For each subject, two segments from each forearm (total four segments, called left proximal, left distal, right proximal and right distal as shown in Fig 1) were scanned. First-order shimming with 14-cm field of view (FOV) was applied to improve the main magnetic field homogeneity over the imaging volume of interest.
Figure 1.
Coronal localizer of human forearm with 55 slices selected for axial MRI scanning: (a) right distal station from middle of the forearm to wrist, (b) right proximal station from elbow to middle of the forearm, (c) left distal, (d) left proximal. Two REST slabs, shown in blue, are positioned parallel to the axial slices.
Table 1.
MRI Imaging Protocol for Nerves in the Forearm
| Series | Plane | Sequence | Options | TE (ms) | TR (ms) | TI (ms) | NSA | Field of View (mm × mm) | Voxel size (mm) | Acquisition Matrix | Acquisition Time |
|---|---|---|---|---|---|---|---|---|---|---|---|
| 1 | AX | T1(TSE) | 12 | 700 | 2 | 140*140 | 0.46×0.46×3 | 256×256 | 6:55 | ||
| 2 | AX | T2 FatSat (TSE) | 90 | 6000 | 2 | 140*140 | 0.46×0.46×4 | 256×256 | 6:17 | ||
| 3 | AX | STIR (TSE) | 30 | 9220 | 190 | 2 | 140*140 | 0.46×0.46×4 | 256×256 | 6:38 | |
| 4 | AX | DTI (SSE) | 21 directions b=1000s/mm2 |
65 | 7200 | 2 | 140*140 | 1.8×1.8×3 | 80×80 | 6:36 |
Note. –AX=Axial TE=Echo Time TR=Repetition Time TI=Time of Inversion NSA=Number of Sampling Average TSE=Turbo Spin Echo SSE=Single-Shot Spin Echo
Data Post Processing
All the DTI data were processed by the advanced view DTI package provided by Philips. DTI were first corrected for the eddy currents by registering them to the reference image (b=0; no diffusion weighting) using the affine registration. Following this preprocessing step, various diffusion indices, such as λ//, λ⊥, mean diffusivity (MD), and fractional anisotropy (FA) and the eigenvectors were calculated. The longitudinal diffusivity, λ//, represents diffusion along the principal axis and the radial diffusivity, λ⊥, is the average of the two eigenvalues λ2 and λ3. FA, MD, λ//, and λ⊥, were obtained on pixel-by-pixel basis. FA was calculated from the eigenvalues using the standard formulas(22) and the FA maps were generated by modulating FA with the primary eigenvector and color coded using the RGB scheme. Sagittal, coronal, and oblique views (cross-sections of 3D volumetric data) were generated from a stack of axial slices using multi planar reformatting. The nerve course was displayed using maximum intensity projection (MIP) images.
Statistical Analysis
All data were presented as mean ± standard deviation (SD). The FA, MD, λ//, and λ⊥ between left and right arms, median and ulnar nerves were compared using the student’s t-test with Bonferroni correction. P<0.05 was considered as significant.
RESULTS
Figure 1 shows the coronal localizer with 55 axial slices selected for each segment in the left and right forearms. Two segments were scanned for each arm. No significant motion or other artifacts were observed on the images from any of the volunteers.
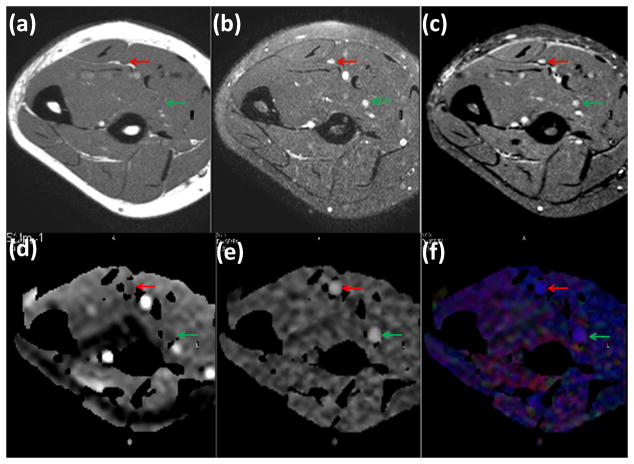
Axial T1-weighted, fat-suppressed T2-weighted fast spin echo, and STIR images and DTI-derived maps are shown in Figure 2. In the axial plane, normal nerves have a smooth round or ovoid shape, which could be the result of acquisition slice non-orthogonal to the nerve. In the T1-weighted MRI shown in Figure 2(a), fat appears bright due to its short T1. The signal from the nerve tissue is isointense with the muscle. In the fat-suppressed T2-weighted images shown in Figure 2(b), nerves appear with slightly higher intensity compared to the muscle. In addition, a number of hyperintense structures are also visible on this image. Similar to the T2-weighted image, the STIR image (Figure 2(c)) shows bright signals from vessels, while the intensity of nerves is intermediate between vessels and muscle. In these images, the hypointense structures on T1-weighted images and of variable signal intensity on T2-weighted images represent vessels. The DTI-derived maps are shown in Figure 2(d) (e) and (f). Fluid signals (within the veins and arteries) in the MD map Figure 2(d) are seen as bright structures due to higher MD than the other tissues, such as, muscles and nerves. Figure 2(e) shows the FA map in gray scale in which the median and ulnar nerves can be easily identified because of their high anisotropy. In the color coded FA shown in Figure 2(f), red, green, and blue represent the directions along right-left, anterior-posterior, and superior-inferior, respectively. It can be seen from this figure that the median and ulnar nerves are the most conspicuous structures in the FA map.
Figure 2.
Comparison of axial T1-weighted (a), fat-suppressed (FS) T2-weighted (b), STIR (c), and MD map (d), gray scale FA map (e), and colour coded FA map (f) obtained from the forearm of a healthy control. The superior contrast and improved conspicuity of the FA map allows easy identification of median (green arrow) and ulnar (red arrow) nerves compared to other images.
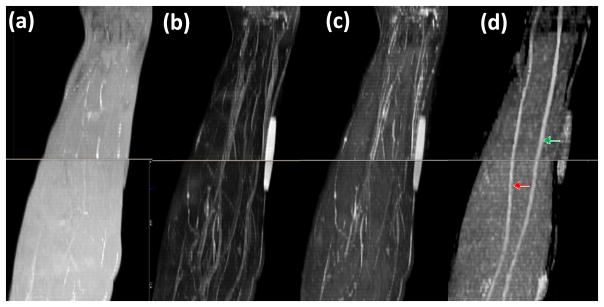
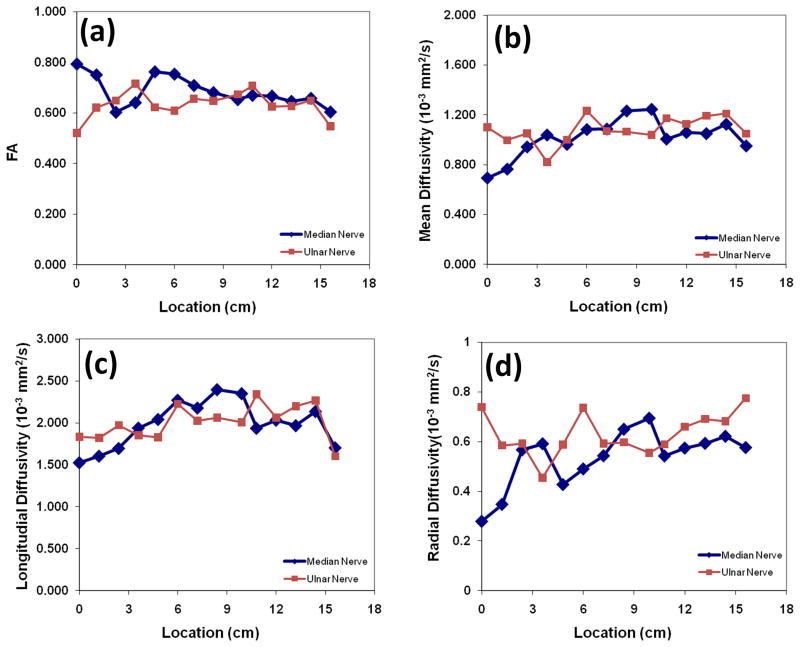
Figure 3 shows typical sagittal MIP images reconstructed from T1- and T2-weighted, STIR images and FA maps. In the STIR and T2-weighted MIP images, unequivocal visualization of nerves is very difficult. The other high signal structures such as vessels impede the delineation of the nerves. In the T1-weighted MIP image, the background fat signal dominates and continuity of the nerve was not observed. Notably, the MIP FA image provides superior contrast for identification of the median and ulnar nerves. Oblique sagittal MIP of FA maps shown in Figure 3(d) demonstrate a clear delineation of the course of median and ulnar nerves longitudinally in the right forearms from elbow to wrist level. In all ten subjects, we could consistently visualize the median and ulnar nerves in both forearms. The typical spatial variations of FA, MD, λ// and λ⊥ values along the length of the nerves are shown in Figure 4. By typical we mean that the images were selected randomly from one of the subjects. The metrics were calculated from the DTI-derived maps and the ROI at the center of the nerves. The FA, MD, λ//, and λ⊥ values vary along the length of the nerves. The percent variations defined by (maximum-minimum)/average for the FA, MD, λ//, and λ⊥ were 27.8%, 54.2%, 43.8% and 77.7% (median nerve), and 30.7%, 38.1%, 36.8%, and 50.7% (ulnar nerve), respectively.
Figure 3.
Comparison of MIP images derived from: (a) T1-weighted (b) FS T2-weighted (c) STIR, and (d) FA maps of the right forearm in a control. It is very difficult to identify the nerves on images a, b, and c. However, the FA map provided much better delineation for easy identification of median (green arrow) and ulnar (red arrow) nerves.
Figure 4.
Spatial variation of (a) FA, (b) MD, (c) λ// and (d) λ⊥ for the ulnar and median nerves from left proximal forearm in a normal volunteer. FA, MD, λ//, and λ⊥ vary along the length of nerves. The origin is about 2 cm from the elbow.
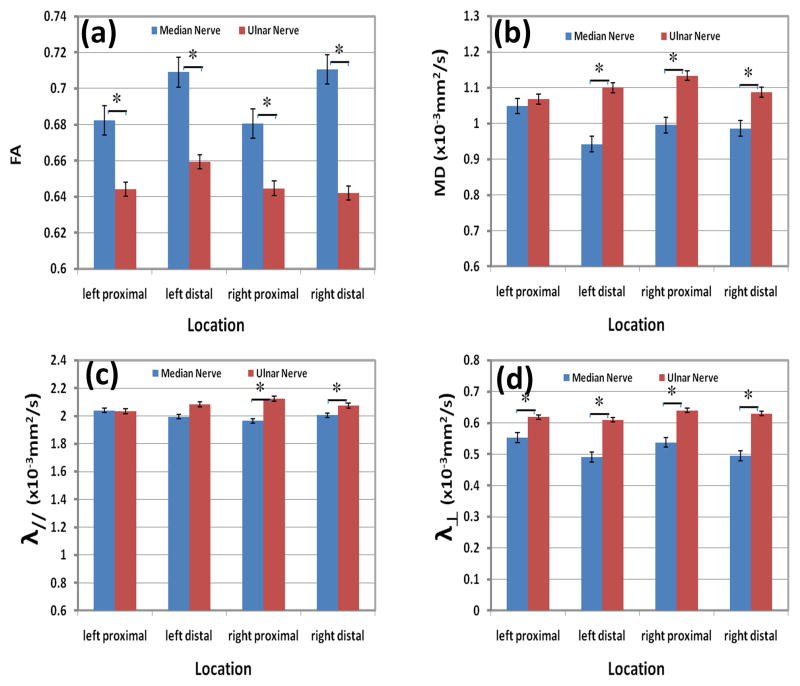
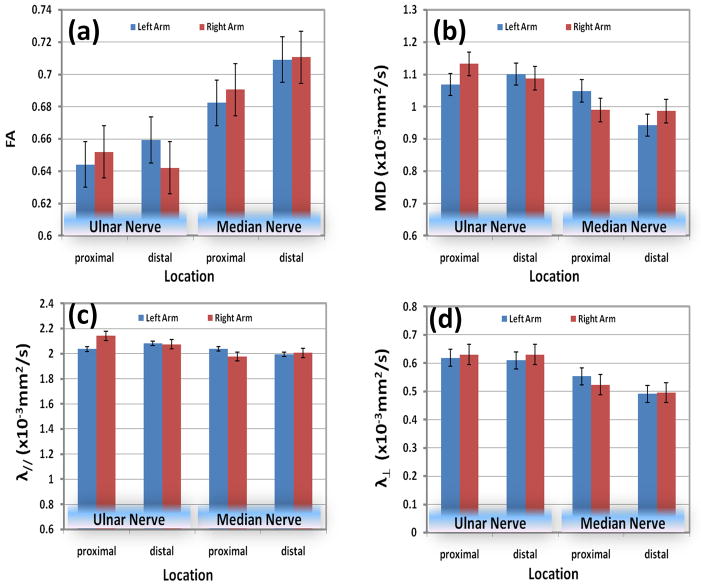
Figures 5 and 6 show results of the DTI measures at two segments of the nerve for right and left forearms. Error bars in these figures represent the standard deviation. The results of the statistical analysis of this data are shown in these figures. Statistically significant differences were not observed between left and right forearm in both proximal and distal segments for both the ulnar and median nerves (P > 0.05). Statistically significant differences in FA MD, λ//, and λ⊥ between median and ulnar nerves were observed in all four segments (P<0.05), except for MD and λ// in the left top segment and λ// in left low segment.
Figure 5.
Quantitative comparisons of the average: (a) FA, (b) MD, (c) longitudinal diffusivity, and (d) radial diffusivity between median and ulnar nerves at different stations (left proximal, left distal, right proximal, and right distal) of healthy controls. * indicates statically significant differences.
Figure 6.
Quantitative comparisons of (a) FA, (b) MD, (c) longitudinal diffusivity, and (d) radial diffusivity of median and ulnar nerves between left and right forearm in 10 healthy controls.
DISCUSION
Our study shows that DTI is a promising technique for identification and quantification of the forearm peripheral nerves and provides a reliable way of obtaining quantitative parameters such as FA, MD, λ// and λ⊥. Among these, FA maps are superior to other images in identifying peripheral nerves relative to muscles, vessels, bone marrows, and other tissues in the forearm. Oblique sagittal MIP images of FA, allowed clear delineation of the course of both median and ulnar nerves longitudinally from elbow to wrist. We also quantified median and ulnar nerves simultaneously. Among quantitative parameters analyzed in this study FA map has the potential to be an important tool in identification, quantification, and serial assessment of nerves in the human forearm.
Combination of high resolution T1-weighted images and fat suppressed heavily T2-weighted images are currently used in MRN (23–25). In our studies, T1-weighted imaging was used to define the bony structures and tissue planes surrounding the nerves. In the T1-weighted images normal peripheral nerves appear isointense or slightly hyperintense compared with muscle tissue since the degree of nerve conspicuity is based on the amount of fat surrounding the nerve. Therefore, smaller peripheral nerves with less fat in the neurovascular bundle are less clearly discernable on standard T1- weighted images. Other sequences may be more useful in characterizing nerve pathology. In the fat saturated T2-weighted and STIR images, the fat signal is suppressed to enhance the nerve signal. The additional REST bands helped suppress the surrounding fatty tissues. While the REST bands significantly lengthen TR, they can be added to a wide range of pulse sequences for clear visualization of nerve pathology. In this study, spectral adiabatic inversion recovery (SPAIR) was used in T2-weighted imaging. The advantage of FatSat T2-weighted sequence is that it provides better signal to noise ratio (SNR) compared to the STIR. Additionally, STIR can maintain the quality of fat suppression even if the magnetic field inhomogeneity is suboptimal. This is particularly important in imaging the forearms, parallel to the body, when some patients feel uncomfortable in raising their arms above the head. When the arm lies parallel to the body, it is away from the axis of the magnet. With good fat saturation, the nerve signals have intermediate signal intensity on T2- weighted and STIR images, but tend to be overwhelmed by much brighter signals from the blood vessels. REST slabs applied parallel to the slices outside the excitation region reduce this problem by suppressing the flowing blood signal. Also, image ghosts (pulsation artifact) from flow, even with flow compensation can have similar signal intensity as the nerves. These artifacts make it very difficult to distinguish nerves in T2-weighted or STIR images.
We found that it easier to identify peripheral nerves on the FA maps compared to images acquired with conventional sequences. In addition, at different levels, the size, shape and signal intensity of the nerves on STIR and T2-weighted images appear to have significant variation, while the FA maps demonstrate more uniformity along the length of nerves. Multiple factors could explain the variation in size and shape along the length of the nerves. These factors include nerve branching, reduction in size of distal nerves, adjacent structures such as bone (particularly ulnar nerve at elbow), at points of change in direction, large venae commitantes joining the nerves, and in plane resolution affecting nerve signal in STIR and T2 images. However, the impact of these variables is less obvious on the DTI. The contrast between nerves and surrounding tissues in FA maps is much higher than in STIR and T2-weighted images, resulting in easy delineation of the size and path of the nerves. Also, FA maps can be used for correlating conventional imaging for accurate sizing of the nerves though FA itself may not reflect the real size of the nerve due to the partial volume effect. There is significant potential for translating two-dimensional data into three-dimensional information, which could allow better pre-operative planning for surgeons and can also be used for communication with patients. Three-dimensional information is easier to demonstrate to the patient and augment their understanding of nerve anatomy and course.
Previous DTI studies on peripheral nerves have generally focused on individual nerves or specific locations (12, 16, 18, 26, 27). For example, Krabakci et al (18) reported only the mean FA and ADC values of the median nerve and the values were comparable to those obtained in our studies. Stein et al (16) reported that the DTI indices changed significantly along the length of the median nerve, but only for about 5 cm long around the carpal tunnel. Jambawalikar et al, (12) reported the FA and MD values only in the ulnar nerve at only three locations. In contrast, our study quantified the spatial variation of FA, MD, λ//, and λ⊥ both in median and ulnar nerves from the elbow to the wrist, in addition these changes were investigated in both forearms. Our studies also demonstrate that the DTI measures do not vary between the left and right forearms. These observations are significant (P<0.05) since they suggest that the spatial location of the nerve needs to be taken into account for assessing the nerve pathology based on the DTI measures. The lack of differences between the right and left arms suggest the unaffected arm in the same patient at a given spatial location can be used as a control for assessing the changes in the nerve pathology in the affected arm. Finally our quantitative findings of FA, MD, λ//, and λ⊥ values provide a valuable reference in the diagnosis of nerve compression, inflammation, and neuropathy and in the assessment of the neuronal degeneration and regeneration in traumatic nerve injuries.
Higher anisotropy, as indicated by higher FA, is generally considered to be a measure of the nerve fiber/tract integrity. However, FA is affected not only by myelin and axonal morphometry, but also by branching fibers, SNR, partial volume effect. Some published studies focusing on CNS disorders suggest that the longitudinal and radial diffusivities improve the pathologic specificity (28–30). It appears that radial diffusivity is more specific to the state of myelin while the longitudinal diffusivity is mainly affected by the axonal integrity (31, 32). However, recent DTI-histologic correlative studies in CNS are not completely consistent with such a simple interpretation (33, 34). In comparison, experimental studies in PNS indicate that FA and longitudinal diffusivity decrease with axonal degeneration and recover with axonal regeneration in sciatic nerve crush model (19, 20). This clear association between axonal integrity with FA and longitudinal diffusivity is partly due to the rapid clearance of myelin in PNS as opposed to CNS, where myelin clearance is substantially delayed.
In these studies, the DTI measures of ulnar and median nerves were observed to be different. Because of the small size of the nerves (2 to 3 mm), it is possible that part of these differences can arise from the partial volume averaging and in variance of the anatomic size differences between the median and ulnar nerves. Currently high resolution DTI studies are in progress that should shed some light on this issue.
Limitations of our study include narrow age range and focus on young adults. This was because majority of patients with traumatic nerve injuries tend to be young and young volunteers tolerate the long MRI sessions better than elderly and majority. In this study only median and ulnar nerves were clearly delineated. It is possible that consistent data on smaller nerves can be obtained with high spatial resolution. Future studies should include larger number of volunteers spread across different age groups and identification of the optimum number of gradient encoding directions, in-plane spatial resolution, and number of averages.
In conclusion, DTI is a promising technique for identification and quantification of the peripheral nerves and quantitative DTI measures such as FA, MD, λ//, and λ⊥ provide normative values for comparison with the diseased/injured nerves to assess nerve integrity and repair.
Acknowledgments
This work is supported in part by the NINDS/NIH grant # NS070888-01 awarded to KAS and NCRR/NIH grant # S10 RR17205 awarded to PAN.
References
- 1.Aagaard BD, Lazar DA, Lankerovich L, Andrus K, Hayes CE, Maravilla K, Kliot M. High-resolution magnetic resonance imaging is a noninvasive method of observing injury and recovery in the peripheral nervous system. Neurosurgery. 2003;53(1):199–203. doi: 10.1227/01.neu.0000069534.43067.28. [DOI] [PubMed] [Google Scholar]
- 2.Andreisek G, Crook DW, Burg D, Marincek B, Weishaupt D. Peripheral neuropathies of the median, radial, and ulnar nerves: MR imaging features. Radiographics. 2006;26(5):1267–1287. doi: 10.1148/rg.265055712. [DOI] [PubMed] [Google Scholar]
- 3.Filler A. Magnetic resonance neurography and diffusion tensor imaging: origins, history, and clinical impact of the first 50,000 cases with an assessment of efficacy and utility in a prospective 5000-patient study group. Neurosurgery. 2009;65(4 Suppl):A29–A43. doi: 10.1227/01.NEU.0000351279.78110.00. [DOI] [PMC free article] [PubMed] [Google Scholar]
- 4.Kermarrec E, Demondion X, Khalil C, Le TV, Boutry N, Cotten A. Ultrasound and magnetic resonance imaging of the peripheral nerves: current techniques, promising directions, and open issues. Semin Musculoskelet Radiol. 2010;14(5):463–472. doi: 10.1055/s-0030-1268067. [DOI] [PubMed] [Google Scholar]
- 5.Noble J, Munro CA, Prasad VS, Midha R. Analysis of upper and lower extremity peripheral nerve injuries in a population of patients with multiple injuries. J Trauma. 1998;45(1):116–122. doi: 10.1097/00005373-199807000-00025. [DOI] [PubMed] [Google Scholar]
- 6.Smith AB, Gupta N, Strober J, Chin C. Magnetic resonance neurography in children with birth-related brachial plexus injury. Pediatr Radiol. 2008;38(2):159–163. doi: 10.1007/s00247-007-0665-0. [DOI] [PubMed] [Google Scholar]
- 7.Howe FA, Filler AG, Bell BA, Griffiths JR. Magnetic resonance neurography. Magn Reson Med. 1992;28(2):328–338. doi: 10.1002/mrm.1910280215. [DOI] [PubMed] [Google Scholar]
- 8.Du R, Auguste KI, Chin CT, Engstrom JW, Weinstein PR. Magnetic resonance neurography for the evaluation of peripheral nerve, brachial plexus, and nerve root disorders. J Neurosurg. 2010;112(2):362–371. doi: 10.3171/2009.7.JNS09414. [DOI] [PubMed] [Google Scholar]
- 9.Chhabra A, Lee PP, Bizzell C, Faridian-Aragh N, Hashemi S, Belzberg AJ, Carrino JA. High-resolution 3-Tesla magnetic resonance neurography of musculocutaneous neuropathy. J Shoulder Elbow Surg. 2011 doi: 10.1016/j.jse.2011.06.008. [DOI] [PubMed] [Google Scholar]
- 10.Chalian M, Faridian-Aragh N, Soldatos T, Batra K, Belzberg AJ, Williams EH, Carrino JA, Chhabra A. High-resolution 3T MR neurography of suprascapular neuropathy. Acad Radiol. 2011;18(8):1049–1059. doi: 10.1016/j.acra.2011.03.003. [DOI] [PubMed] [Google Scholar]
- 11.Hiltunen J, Suortti T, Arvela S, Seppa M, Joensuu R, Hari R. Diffusion tensor imaging and tractography of distal peripheral nerves at 3 T. Clin Neurophysiol. 2005;116(10):2315–2323. doi: 10.1016/j.clinph.2005.05.014. [DOI] [PubMed] [Google Scholar]
- 12.Jambawalikar S, Baum J, Button T, Li H, Geronimo V, Gould ES. Diffusion tensor imaging of peripheral nerves. Skeletal Radiol. 2010;39(11):1073–1079. doi: 10.1007/s00256-010-0974-5. [DOI] [PubMed] [Google Scholar]
- 13.Meek MF, Stenekes MW, Hoogduin HM, Nicolai JP. In vivo three-dimensional reconstruction of human median nerves by diffusion tensor imaging. Exp Neurol. 2006;198(2):479–482. doi: 10.1016/j.expneurol.2005.12.014. [DOI] [PubMed] [Google Scholar]
- 14.Skorpil M, Karlsson M, Nordell A. Peripheral nerve diffusion tensor imaging. Magn Reson Imaging. 2004;22(5):743–745. doi: 10.1016/j.mri.2004.01.073. [DOI] [PubMed] [Google Scholar]
- 15.Takahara T, Hendrikse J, Kwee TC, Yamashita T, Van CM, Polders D, Boer V, Imai Y, Mali WP, Luijten PR. Diffusion-weighted MR neurography of the sacral plexus with unidirectional motion probing gradients. Eur Radiol. 2010;20(5):1221–1226. doi: 10.1007/s00330-009-1665-2. [DOI] [PMC free article] [PubMed] [Google Scholar]
- 16.Stein D, Neufeld A, Pasternak O, Graif M, Patish H, Schwimmer E, Ziv E, Assaf Y. Diffusion tensor imaging of the median nerve in healthy and carpal tunnel syndrome subjects. J Magn Reson Imaging. 2009;29(3):657–662. doi: 10.1002/jmri.21553. [DOI] [PubMed] [Google Scholar]
- 17.Jambawalikar S, Baum J, Button T, Li H, Geronimo V, Gould ES. Diffusion tensor imaging of peripheral nerves. Skeletal Radiol. 2010;39(11):1073–1079. doi: 10.1007/s00256-010-0974-5. [DOI] [PubMed] [Google Scholar]
- 18.Kabakci N, Gurses B, Firat Z, Bayram A, Ulug AM, Kovanlikaya A, Kovanlikaya I. Diffusion tensor imaging and tractography of median nerve: normative diffusion values. AJR Am J Roentgenol. 2007;189(4):923–927. doi: 10.2214/AJR.07.2423. [DOI] [PubMed] [Google Scholar]
- 19.Sheikh KA. Non-invasive imaging of nerve regeneration. Exp Neurol. 2010;223(1):72–76. doi: 10.1016/j.expneurol.2009.07.008. [DOI] [PMC free article] [PubMed] [Google Scholar]
- 20.Lehmann HC, Zhang J, Mori S, Sheikh KA. Diffusion tensor imaging to assess axonal regeneration in peripheral nerves. Exp Neurol. 2010;223(1):238–244. doi: 10.1016/j.expneurol.2009.10.012. [DOI] [PMC free article] [PubMed] [Google Scholar]
- 21.Andreisek G, White LM, Kassner A, Sussman MS. Evaluation of diffusion tensor imaging and fiber tractography of the median nerve: preliminary results on intrasubject variability and precision of measurements. AJR Am J Roentgenol. 2010;194(1):W65–W72. doi: 10.2214/AJR.09.2517. [DOI] [PubMed] [Google Scholar]
- 22.Basser PJ, Pierpaoli C. Microstructural and physiological features of tissues elucidated by quantitative-diffusion-tensor MRI. J Magn Reson B. 1996;111(3):209–219. doi: 10.1006/jmrb.1996.0086. [DOI] [PubMed] [Google Scholar]
- 23.Bashir WA, Connell DA. Imaging of entrapment and compressive neuropathies. Semin Musculoskelet Radiol. 2008;12(2):170–181. doi: 10.1055/s-2008-1078704. [DOI] [PubMed] [Google Scholar]
- 24.Bazot M, Darai E, Hourani R, Thomassin I, Cortez A, Uzan S, Buy JN. Deep pelvic endometriosis: MR imaging for diagnosis and prediction of extension of disease. Radiology. 2004;232(2):379–389. doi: 10.1148/radiol.2322030762. [DOI] [PubMed] [Google Scholar]
- 25.Chhabra A, Williams EH, Subhawong TK, Hashemi S, Soldatos T, Wang KC, Carrino JA. MR neurography findings of soleal sling entrapment. AJR Am J Roentgenol. 2011;196(3):W290–W297. doi: 10.2214/AJR.10.4925. [DOI] [PubMed] [Google Scholar]
- 26.Meek MF, Stenekes MW, Hoogduin HM, Nicolai JP. In vivo three-dimensional reconstruction of human median nerves by diffusion tensor imaging. Exp Neurol. 2006;198(2):479–482. doi: 10.1016/j.expneurol.2005.12.014. [DOI] [PubMed] [Google Scholar]
- 27.Kabakci NT, Kovanlikaya A, Kovanlikaya I. Tractography of the median nerve. Semin Musculoskelet Radiol. 2009;13(1):18–23. doi: 10.1055/s-0029-1202241. [DOI] [PubMed] [Google Scholar]
- 28.Deo AA, Grill RJ, Hasan KM, Narayana PA. In vivo serial diffusion tensor imaging of experimental spinal cord injury. J Neurosci Res. 2006;83(5):801–810. doi: 10.1002/jnr.20783. [DOI] [PubMed] [Google Scholar]
- 29.Narayana PA, Ahobila-Vajjula P, Ramu J, Herrera J, Steinberg JL, Moeller FG. Diffusion tensor imaging of cocaine-treated rodents. Psychiatry Res. 2009;171(3):242–251. doi: 10.1016/j.pscychresns.2008.04.004. [DOI] [PMC free article] [PubMed] [Google Scholar]
- 30.Song SK, Yoshino J, Le TQ, Lin SJ, Sun SW, Cross AH, Armstrong RC. Demyelination increases radial diffusivity in corpus callosum of mouse brain. Neuroimage. 2005;26(1):132–140. doi: 10.1016/j.neuroimage.2005.01.028. [DOI] [PubMed] [Google Scholar]
- 31.Budde MD, Xie M, Cross AH, Song SK. Axial diffusivity is the primary correlate of axonal injury in the experimental autoimmune encephalomyelitis spinal cord: a quantitative pixelwise analysis. J Neurosci. 2009;29(9):2805–2813. doi: 10.1523/JNEUROSCI.4605-08.2009. [DOI] [PMC free article] [PubMed] [Google Scholar]
- 32.Naismith RT, Xu J, Tutlam NT, Snyder A, Benzinger T, Shimony J, Shepherd J, Trinkaus K, Cross AH, Song SK. Disability in optic neuritis correlates with diffusion tensor-derived directional diffusivities. Neurology. 2009;72(7):589–594. doi: 10.1212/01.wnl.0000335766.22758.cd. [DOI] [PMC free article] [PubMed] [Google Scholar]
- 33.Budde MD, Kim JH, Liang HF, Schmidt RE, Russell JH, Cross AH, Song SK. Toward accurate diagnosis of white matter pathology using diffusion tensor imaging. Magn Reson Med. 2007;57(4):688–695. doi: 10.1002/mrm.21200. [DOI] [PubMed] [Google Scholar]
- 34.Herrera JJ, Chacko T, Narayana PA. Histological correlation of diffusion tensor imaging metrics in experimental spinal cord injury. J Neurosci Res. 2008;86(2):443–447. doi: 10.1002/jnr.21481. [DOI] [PubMed] [Google Scholar]


