Abstract
Dextran and polyethylene glycol (PEG) are often covalently bound to the surface of polydimethylsiloxane (PDMS) for the purpose of modifying its hydrophilicity and biocompatibility. In this work, the effects of the dextran and PEG on the morphology, wetting, and surface charge of the resulting surfaces were quantified and correlated with changes in the amount of fibrinogen and albumin adsorbed from aqueous solution. PDMS films were functionalized in a microwave oxygen plasma to create surface hydroxyl groups that were subsequently aminated by incubation in a (3-aminopropyl)trimethoxysilane (APTES) solution. Oxidized dextran and PEG-aldehyde were linked to the surface amines via reductive amination. This process resulted in low surface coverage of immobilized PEG in the end-on conformation and a more uniform and dense distribution of side-on immobilized dextran. The immobilized dextran reduced the contact angle of the PDMS film from 109° to 80° and neutralized the zeta potential over the pH range from 3 to 11. An atomic force microscope was used to measure the interaction force between the modified PDMS and a model hydrophobic surface (polystyrene latex) and a model hydrophilic surface (silica) in both water and electrolyte solutions to show that van der Waals and hydrophobic attractive forces are the dominant forces for protein adsorption in this system. The PEG- and dextran-modified PDMS were exposed to BSA and fibrinogen to test their resistance to protein adsorption. The coatings were ineffective at reducing the adsorption of either molecule, and the dextran-modification of the PDMS caused more BSA to adsorb than in the case of the unmodified PDMS.
Keywords: Protein adsorption, dextran, polyethylene glycol, polydimethylsiloxane, atomic force microscopy, zeta potential
1. Introduction
Polydimethylsiloxane (PDMS) has been employed extensively in microfluidic, surface coating, and biomedical applications [1, 2]. It is relatively inexpensive, biologically inert, nontoxic, chemically and thermally stable, and can be produced through low temperature polymerization of the monomer, allowing for devices to be fabricated through soft lithography [3, 4]. It is desirable to improve the biocompatibility and clinical performance of PDMS by increasing its hydrophilicity [5]. It is expected that hydrophilic groups reduce protein adsorption through preferred interactions with water. Water molecules form hydrogen bonds to the surface, which must be displaced at a cost of some energy for proteins to adsorb [13]. When corona and plasma treatments are used to increase the hydrophilicity of PDMS, the effect is transient and the surface quickly returns to the original hydrophobic state via a process known as hydrophobic recovery [6]. There are two primary theories for how hydrophobic recovery occurs. First, the plasma treatment forms a hydrophilic silica layer on the surface of the PDMS by preferentially removing hydrocarbon fragments from the surface and promoting oxidation of the silicon species. Hydrophobic recovery may occur when mechanically- or thermally-induced stress creates cracks in the silica and unoxidized sub-surface PDMS migrates through the cracks and covers the surface [7]. Alternatively, if large-scale silica regions do not form on the polymer, then polar groups formed during the plasma treatment may rotate from the surface into the bulk [6].
To overcome the problem of hydrophobic recovery and improve the biocompatibility of PDMS, the effects of grafting polyethylene glycol (PEG) and dextran to the surface were studied. PEG and dextran were selected for their extensive use in creating surfaces which resist protein and cellular adsorption [e.g., 8, 9]. Of particular interest is a direct qualitative comparison between immobilized dextran and PEG that revealed similar decreases in protein adsorption even with differing surface charge and packing density as shown by Osterberg et al. [9]. Specific experimental objectives of this study were to prepare PDMS films grafted with dextran and PEG and determine their stability, the extent of non-specific protein binding to their surfaces, and their relevant surface properties such as morphology, wetting, and surface charge. The primary theoretical goal was to deconvolute and quantify the surface forces governing protein adsorption in these systems, including steric forces, electrostatic forces, hydrophobic interactions, and van der Waals (vdW) forces.
Tapping mode AFM allows high resolution topographical images of biofilms to be collected in a nondestructive manner, which in turn enables quantification of their roughness [7]. AFM has also been used to measure forces between particle probes and a number of solid substrates in aqueous environments [e.g., 10, 11], and these measurements have been used to assist in the determination of effective Hamaker constants, A132. These are the material-specific constants in vdW force laws [12]. Contact angle measurements are used to characterize the surface wettability and stability of the modified PDMS surfaces. When adhesion forces are evaluated in aqueous environments via AFM, hydrophobic interactions cannot be isolated from vdW interactions, such that any Hamaker constants extracted must be considered ‘effective’ Hamaker constants that will frequently have some correlation with contact angle measurements.
2. Experimental
2.1. PDMS Films
Silicon (100) wafers were cleaved into rectangular coupons ranging from 1 to 5 cm on each side. The coupons were cleaned in acetone and ethanol and dried under nitrogen. A 10:1 mixture of Sylgard 184 base and curing agent (Dow Chemical) was combined and degassed to form liquid PDMS. This mixture was spin-coated onto the silicon coupons at 5000 RPM for 60 seconds and cured on a hot plate at 150°C for 10 minutes.
2.2. Plasma Modification
A remote microwave plasma reactor was used to functionalize the PDMS surface with hydroxyl groups. The plasma was generated at 200 W of applied power using a 2.45 GHz power source (ASTEX AX2000) with the reflected watts minimized using a three stub tuner. A Pfeiffer (TPH 210 P C) turbomolecular pump backed by an Edwards (E2M18) mechanical pump was used to reduce the base pressure of the chamber to less than 5×10⁻⁷ torr after the sample was placed in the chamber. The stainless steel plasma chamber was 6 inches in diameter with a compression fitting for the 1 inch quartz applicator tube at the top, a KF-50 port at the bottom, a KF-50 port at the rear for feed-through to a temperature controller, and an MDC Quick-Access Door in front with a glass viewport. Oxygen (Matheson purity 99.997%) flowed into the chamber at a rate of 42 sccm. Moderate conditions of 0.6 torr chamber pressure, 1 minute treatment time, and 100°C substrate temperature were implemented during the PDMS exposure to the plasma. After the plasma was extinguished, the sample was exposed to oxygen gas for an additional 3 minutes in order to quench unreacted radicals before bringing the chamber back up to atmospheric pressure using nitrogen gas.
Upon removal from the chamber, the oxidized PDMS was immersed in a solution of 5% 3-aminopropyltrimethoxysilane (APTES, 97% purity, Sigma), 5% water, and 90% ethanol by volume in order to attach amine groups on the surface. The samples were incubated in solution at 30°C for 30 minutes on a rocking platform. At the end of the APTES treatment, the sample was rinsed with ethanol, sonicated for 5 minutes to remove silane multilayer buildup, and rinsed with 18 MΩ water (Millipore). The aminated PDMS was then placed into an aqueous solution containing either oxidized dextran or PEG.
2.3. Dextran Coating and Characterization
Oxidized dextran was prepared via standard periodate methods to produce aldehyde groups for side-on immobilization to primary amines on the PDMS surface [14]. 3.333 g dextran from Leuconostoc ssp. (Mr 15,000–25,000, Sigma) and 1.970 g sodium periodate (99.8+% A.C.S reagent, Sigma) were dissolved in 100 ml 18MΩ water and allowed to react for 4 hours at ambient conditions. The mixture was protected from light by wrapping the reaction flask in aluminum foil. The solution was purified by dialysis using cellulose ester (CE) membrane tubing (1000 Dalton MWCO), while again being protected from light. The oxidized dextran was then divided, lyophilized, and stored at −20°C unless used immediately.
A solution of oxidized dextran for immobilization was prepared by dissolving 0.02 g/mL dextran in 0.2 M Na2HPO4 buffer at pH 9. Aminated PDMS was incubated in this solution on a rocking platform at 30°C overnight with the reaction tube wrapped in foil to protect it from light. After ~18 hours, the oxidized dextran solution was decanted and the modified PDMS was immersed in 0.1M NaBH4 (reagent grade 98%, Sigma). The sample was incubated in the NaBH4 solution for 2 hours at 30°C. Upon completion, the solution was decanted, and the sample was rinsed with DI water and dried with nitrogen.
To test the extent of covalent attachment of dextran to the PDMS, aminated PDMS films were prepared. Then, a solution of fluorescently labeled oxidized dextran, dextran-Texas red (MW 40,000, Molecular Probes), was prepared by dissolving 25 mg in 2 ml of 18 MΩ water with 52 mg NaIO4. The solution was allowed to stand at room temperature for 4 hours protected from light. At the end of the reaction, 1 mL of the fluorescently labeled oxidized dextran solution was pipetted into a 1 mL QuixSep microdialysis device (Membrane Filtration Products, Inc.) with a 1000 Da MWCO membrane and dialyzed for 4 hours protected from light. 1 ml of the oxidized dextran solution was combined with 1 ml 0.5 M sodium phosphate dibasic and incubated for 4 hours with the aminated PDMS at 30°C protected from light. The labeled dextran solution was then decanted and the reaction vial filled with 0.1 M NaBH4. At the end of 2 hours, the NaBH4 solution was decanted. The dextran-PDMS film was rinsed 5× with DI water and dried under nitrogen. The dextran-PDMS film was then examined under a microscope (Nikon E800) with a fluorescent filter cube at 40× magnification. Labeled dextran-PDMS films were also incubated in a 1× PBS solution for 2 hours at 37°C and in a 10% (by weight) SDS solution overnight for comparison.
2.4. PEG Coating
Methoxy-terminated aldehyde-PEG (M-PEG, MW 5000 Da, Nektar) was grafted onto the aminated PDMS by reductive amination, using NaBH4 as the reducing agent for the intermediate Schiff linkage. 1.0 mg/ml M-PEG was dissolved in 30 ml of 0.1 M sodium phosphate buffer at pH 7 containing 0.6M K2SO4. The aminated PDMS was incubated in the M-PEG solution overnight at 60°C under conditions of marginal solvation in order to maximize the grafting density of PEG chains [15]. The M-PEG solution was then decanted and replaced with 0.1M NaBH4. The PEG-PDMS film was then rinsed 5× with DI water and dried under nitrogen.
2.5. Contact Angle Measurements
Static contact angle measurements of DI water on the PDMS surfaces were made under ambient temperature and humidity (approximately 72°F and 40% relative humidity). The contact angle was measured using a Ramé-Hart model 500 goniometer with automated dispenser and DROPimage advanced software package. Once the film had aged over 24 hours, a total of 8 drops were measured to calculate an average contact angle plus standard deviation. The films were dried under nitrogen between measurements.
2.6. Zeta Potential Measurements
The zeta potentials of the modified films were measured using a Laval Lab ZetaCAD, which utilizes the streaming potential technique. Duplicate 3cm×5cm dextran-PDMS, PEG-PDMS, and bare PDMS samples were studied. These were placed in the ZetaCAD cell, separated by Teflon spacers to create a 100µm channel. 10−3 M NaCl electrolyte solutions were prepared with varying pH. It was not possible to measure the zeta potential of the films in a 1×PBS solution as the maximum ionic strength of the electrolyte that the ZetaCAD can accommodate is 10−2 M.
2.7. Atomic Force Microscopy
The topography of 1µm × 1µm regions of the PDMS films was studied using a Veeco Nanoscope IV Scanning Probe Microscope operating in tapping mode. RTESPA phosphorus-(n)-doped silicon cantilevers from Veeco were used. The average roughness, root mean square roughness, and maximum roughness depth were extracted using the Veeco software.
Silica particles with diameter ~ 4 µm were mounted on tipless AFM cantilevers using a technique developed by Ducker et al. [16–18]. Veeco MLCT-F cantilevers with a nominal spring constant of 0.5 N/m were selected for measuring the interaction forces between the silica probes and the PDMS. Veeco NP and MLCT-E cantilevers with nominal spring constants of 0.32 and 0.1 N/m were selected for measuring the interaction forces between the silica probes and the amine- and dextran-modified PDMS surfaces, respectively. To attach the particles to the cantilevers, copper wires were etched to a fine point in nitric acid and placed in manual micromanipulators. One wire was used to apply a thin layer of Norland Optical Adhesive 88 to the end of the cantilever, and the second was used to pick up a silica particle and deposit it on the glue. The glue was cured by placing the cantilever on a hotplate at 80°C for 20 minutes and then exposing it to UV light for 30 minutes. The mass of the mounted silica was determined from FESEM micrographs and the density of silica. Spherical polystyrene latex particles (3.2 µm diameter, Duke Scientific) were mounted in the same manner using a two-part epoxy adhesive (EP21TDCS Master Bond) which cured at room temperature over 36 hours.
Force measurements were made between the mounted particles and the PDMS-based surfaces using the Veeco AFM. The silica and PSL particles were brought into contact with the modified PDMS films in an aqueous environment using a fluid cell with a scan rate of 0.4 Hz. The interaction forces were measured in 1M NaCl solutions.
The effective Hamaker constant, A132, for each surface/probe pairing was calculated from the measured interaction forces as each probe approached the PDMS-based substrates in the 1M NaCl. The high ionic strength of this solution suppressed the electrostatic double layers to an extremely short separation distance, allowing the effective vdW interaction force to be evaluated. The effective Hamaker constant was determined by fitting the experimentally-obtained force-distance curves during the approach of the probe to the surface to a vdW force expression described below. In this approach, the effective Hamaker constant was the lone adjustable parameter. A minimum of 30 of the 200 approach curves collected for each surface/probe pairing were averaged to determine the mean approach curve plus standard deviation. The data points where the attractive force gradient exceeds the spring constant of the cantilever were neglected in the curve fitting, because in this region the cantilever is not in mechanical equilibrium and simple cantilever dynamics do not describe its motion well.
The vdW model was based on work by Cooper et al. and Eichenlaub et al. to account for surface roughness in the vdW force calculation [12, 17, 19]. With this approach, the surface of both the particle and substrate are discretized into a mesh of rectangular elements of equal size (1nm × 1nm). The vdW interaction force between two opposing flat plate elements is
| Eq. 1 |
where: d is the separation distance between the plates and area is the surface area of the interacting elements. In this model, the total vdW force between the two surfaces is determined by summing the vdW force between all opposing elements within the mesh. The separation distance between opposing elements is based on the geometry, roughness, and distance from contact (contact is defined as the point at which 2 elements are separated by 0.4 nm). The roughness of the substrates and silica particles was determined from topographical scans obtained using the AFM in tapping mode. The PSL particles were assumed to be smooth.
2.8. Protein Adsorption Studies
1 mg/ml bovine serum albumin (BSA)-Alexa Fluor 488 conjugate (Molecular Probes) was dissolved in phosphate buffered saline (PBS) at pH 7.4. Once the dextran-PDMS and PEG-PDMS films had aged for over one week, they were incubated in the fluorescently-labeled BSA solution for 2 hours at 37°C. The BSA solution was then decanted, and the films were rinsed 2× in PBS and 8× in DI water. A second set of dextran-PDMS, PEG-PDMS, and bare PDMS films were incubated at 37°C for 2 hours in a 1 mg/ml fibrinogen-Alexa Fluor 488 conjugate (Molecular Probes) PBS solution. The fibrinogen solution was then decanted, and the films were rinsed 2× in PBS and 8× in DI water. The films were then examined under a microscope (Nikon E800) with a fluorescent filter cube (470 ± 20 nm exciter, 525 ± 25 nm emitter) at 40× magnification. 8 sets of images for each protein-fouled film were taken. The MATLAB ‘imread’ command was used to read the images and return the image data as a three-dimensional array, specifying the intensity of red, green, and blue for the desired locations on the image. The mean value of green light in each image was calculated, as well as an average value plus standard deviation for each sample. All intensities were normalized to that emitted from uncoated PDMS.
3. Results and Discussion
3.1. Dextran Oxidation and Grafting
From the titration of formic acid formed during the oxidation reaction, 15.3% of the starting quantity of dextran was converted to the 2,4-oxidized fragment and its equilibrium hemiacetyl structure. It was determined that 0.0039 mol aldehyde groups were present per gram of oxidized dextran product, based on titration of the hydrochloric acid liberated by the reaction of the hydroxylamine hydrochloride with the aldehyde groups. Therefore, approximately 30% of the dextran was oxidized to form a dialdehyde or its equilibrium hemiacetyl structure.
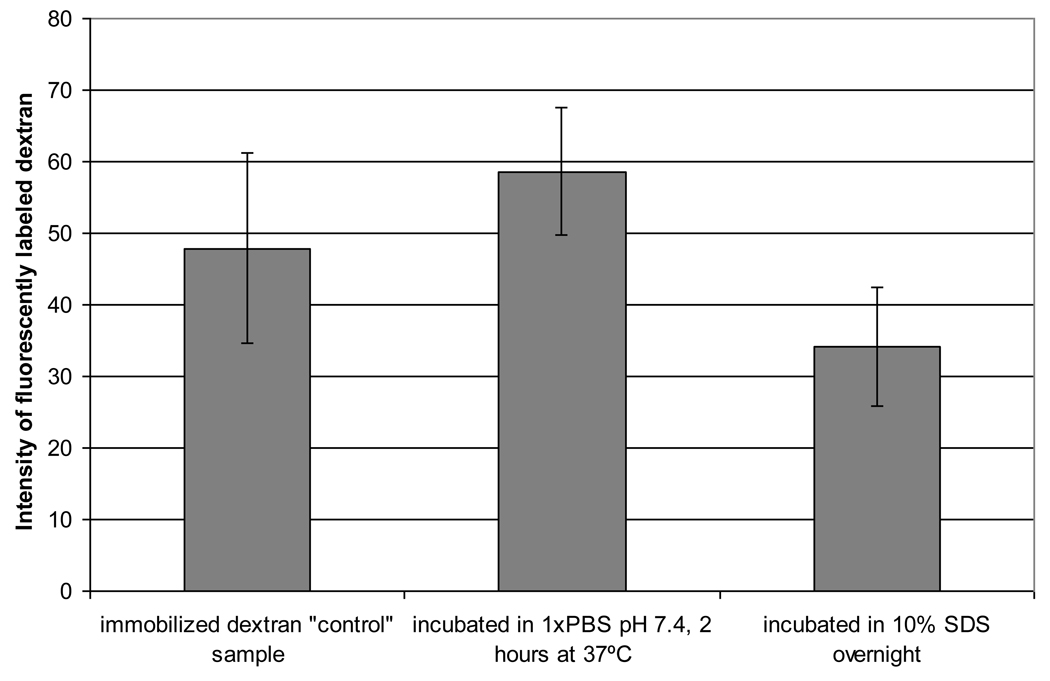
Fluorescent microscope images confirmed that the dextran-Texas red was irreversibly bound to the amine-modified PDMS surface as shown in Figure 1. A relatively uniform fluorescence was observed on the PDMS/dextran-Texas red surface, although some aggregation was evident. The fluorescence was persistent in the dextran-PDMS sample incubated in the 1× PBS solution, although a small amount of dextran was eluted by incubation in the 10% SDS solution overnight. These results show the majority of dextran is irreversibly bound to the surface, which is indicative of covalent attachment.
Figure 1.
Intensity of fluorescently labeled dextran to test for covalent attachment
3.2. Wetting
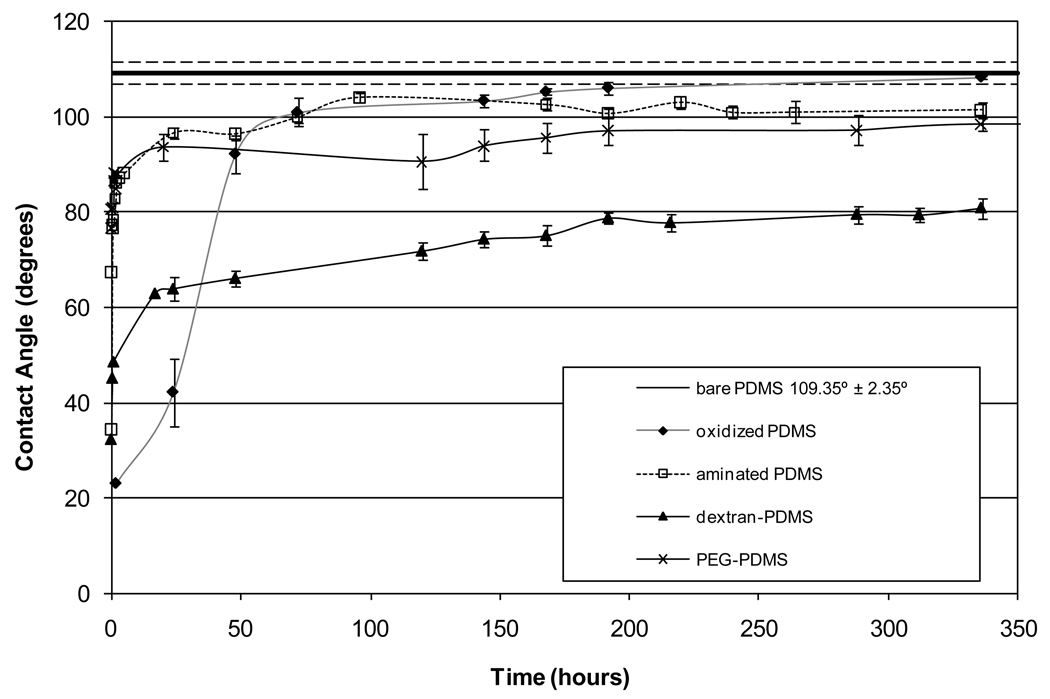
Figure 2 shows the measured static contact angles of water on bare PDMS, oxidized PDMS, amine-modified PDMS, dextran-modified PDMS, and PEG-modified PDMS surfaces over a 14-day period. The oxygen plasma treatment of PDMS causes the surface to become hydrophilic (contact angle ~ 23°). It is believed that the plasma preferentially removes the organic components of the PDMS and drives the formation of a surface layer containing both silica and silanol (Si-OH) groups. As the oxidized PDMS film ages, it reverts back to its original hydrophobic character. It is important to note that oxidized PDMS samples were observed (with the unaided eye) to become cracked during the contact angle study, including those samples which did not appear to be cracked upon removal from the plasma reactor.
Figure 2.
Contact angle of modified PDMS films over a 14-day period
The amine- and PEG-modified PDMS surfaces show a modest reduction in contact angle compared to the bare PDMS surface after aging for 2 weeks. The PDMS film with dextran covalently attached shows the largest reduction in contact angle, and this change is stable at 80°. This suggests that the dextran may remain on the surface, rather than being enveloped by the underlying PDMS. The persistence of dextran at the surface is likely due to the ability of each dextran molecule to bind to multiple amine groups on the PDMS, creating a network that prevents both migration of unoxidized PDMS to the surface and polar group rotation. Because each PEG molecule is bound at only one location, it is limited in its ability to prevent either migration of unmodified PDMS to the surface or rotation of the modified PDMS into the bulk.
3.3. Electrostatic Interactions
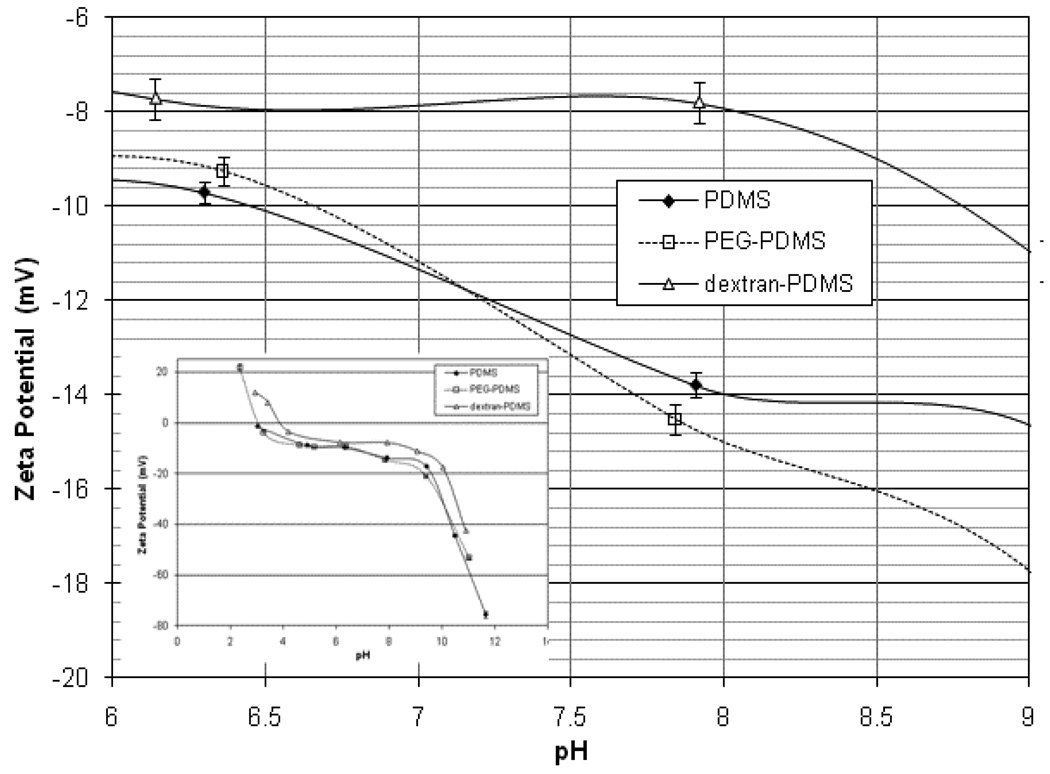
The zeta potentials of the PDMS, PEG-PDMS, and dextran-PDMS films are shown in Figure 3. These were measured using a 1mM NaCl background electrolyte. For all 3 films, the potential is positive at lower pH values, passes through an isoelectric point, and is negative at higher pH values. Immobilizing dextran to the surface masks the negative charge of the PDMS below, so that the zeta potential decreases in magnitude. Immobilizing PEG to the PDMS surface showed negligible change in the zeta potential over the measured pH range compared to the unmodified PDMS, indicating the surface coverage of PEG was likely too low to sufficiently affect the electrostatic character of the film. All 3 films have small zeta potentials (<20 mV) which vary slightly with pH in the range of pH 5 to 9.
Figure 3.
Measured zeta potentials of modified PDMS films in 1mM NaCl electrolyte (inset shows broad pH region)
The zeta potential values for the silica and PSL particles attached to the AFM tips were determined previously elsewhere [20]. At neutral pH in a 10mM electrolyte, PSL has a zeta potential value of about −26 mV, and silica has a value of about −39 mV. Both bovine serum albumin (BSA) and fibrinogen have negative zeta potential values at neutral pH and the physiologically relevant pH 7.4.
3.4. Morphology
5µm × 5µm tapping mode topographical scans of bare PDMS, aminated PDMS, PEG-PDMS, and dextran-PDMS are shown in Figure 4. Aminating the PDMS surface does not significantly increase the roughness, although it is expected that the plasma oxidation process leads to the surface cracks seen in the PEG-PDMS and dextran-PDMS images. From line scans of the AFM images, it appears these cracks range in depth between 5 and 30 nm and are up to 100 nm in width. As the modified PDMS films age, however, these cracks gradually fill in.
Figure 4.
5 µm × 5 µm topographical scans of (a) PDMS, (b) aminated PDMS, (c) PEG-PDMS, and (d) dextran-PDMS taken using an AFM operating in tapping mode in air
The end-on immobilized PEG appears to have formed isolated aggregates on the otherwise smooth aminated PDMS surface. These aggregates are shown by the bright white round spots on the peglyated surface. Roughness data, shown in Table 1, indicate that the pegylated surface is smoother than the aminated PDMS or bare PDMS surfaces in areas where cracks have not formed.
Table 1.
Roughness data from AFM images
| Substrate | Root Mean Square Roughness (nm) |
Average Roughness (nm) | Maximum Roughness Depth (nm) |
|---|---|---|---|
| PDMS | 0.55 | 0.44 | 4.6 |
| aminated PDMS | 0.62 | 0.49 | 5.1 |
| PEG-PDMS | 0.37 | 0.29 | 3.5 |
| dextran-PDMS | 0.98 | 0.58 | 17.3 |
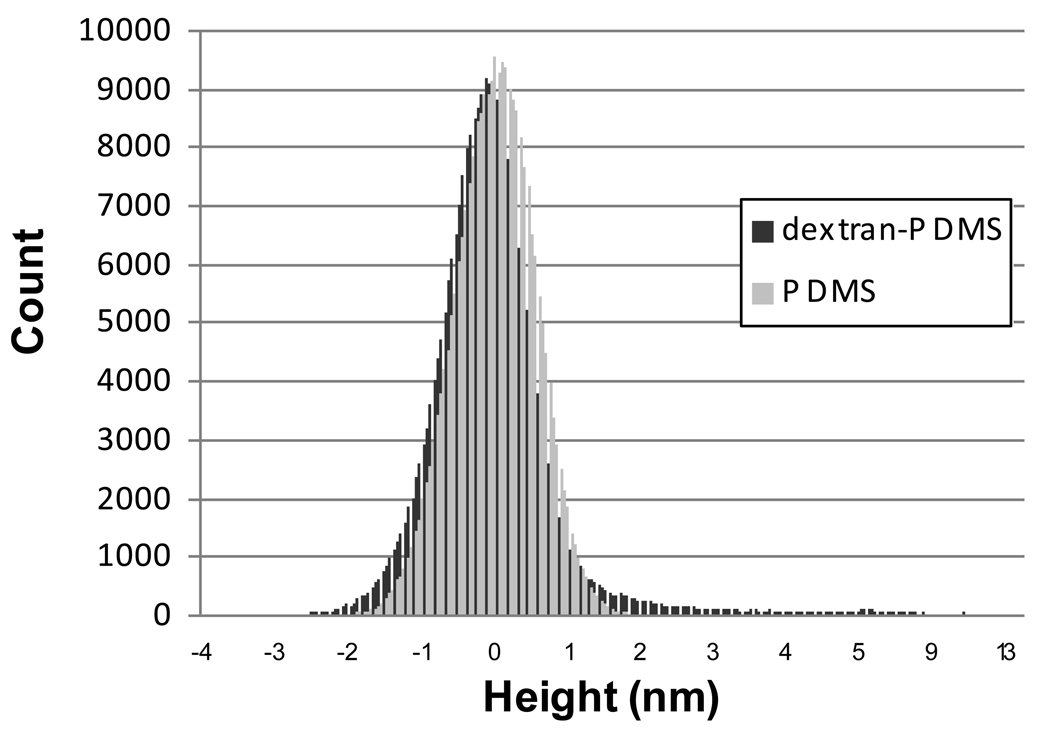
The dextran features are uniformly distributed across the substrate, as seen by the uniform distribution of white dots in Figure 4. The height histogram of the dextran-PDMS surface in Figure 5, calculated from a 1µm2 area, shows a slightly elongated tail to the right of the mean. The majority of the dextran remains tightly bound to the PDMS with loops extending on the order of ~ 4 – 15 nm off of the surface. The larger of these dextran features are approximately 50 nm in diameter and are spaced on the order of tens of nanometers to a few hundred nanometers apart.
Figure 5.
Height histograms of PDMS and dextran-PDMS from a 1 µm × 1 µm tapping mode image with 512×512 resolution
3.5. AFM-Based Interaction Force Measurements
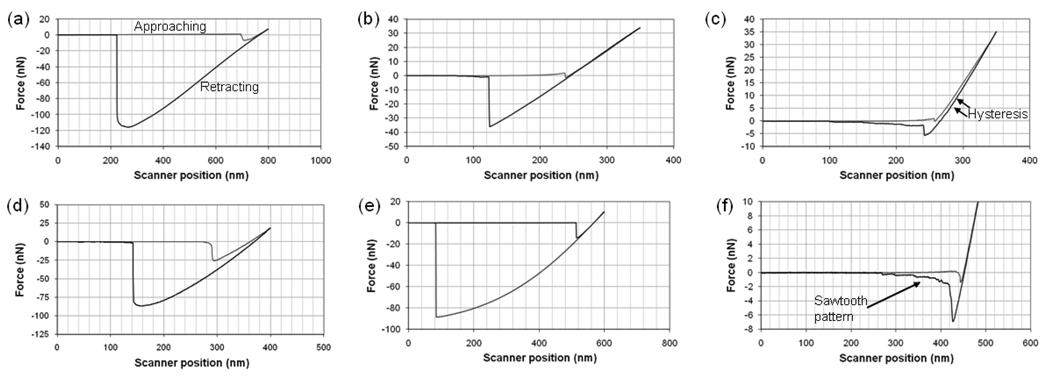
Typical graphs of the adhesion force as a function of the separation distance (force curves) between the silica and PSL particles and the different substrates of interest (PDMS, aminated PDMS, and dextran-PDMS) in water are shown in Figure 6. Silica was selected as the model hydrophilic surface (contact angle ~15°) and PSL as the model hydrophobic surface (contact angle ~91°) [21]. Force curves for the pegylated PDMS are not shown, as the contact angle and zeta potential data suggest that the surface characteristics have returned to those of the unmodified PDMS.
Figure 6.
Sample force curves of a silica particle with: (a) PDMS, (b) aminated PDMS, and (c) dextran-PDMS; and a PSL particle with: (d) PDMS, (e) aminated PDMS, and (f) dextran-PDMS. All measurements made in DI water.
Immobilizing dextran to the PDMS surface significantly reduces the pull-off force for both the silica and PSL particles. The dextran loops create a steric barrier between the particles and the underlying PDMS. Hysteresis is seen between the extending and retracting curves while the particle probe is in contact with the dextran-PDMS surface. This occurs when the colloid probe compresses and becomes entangled with the dextran chains after the jump into contact. A sawtooth pattern in the retracting curve is observed when both the silica and PSL particles are pulled out of contact from the dextran-coated surface. This is the result of separation first from the PDMS surface and then from the immobilized dextran chains.
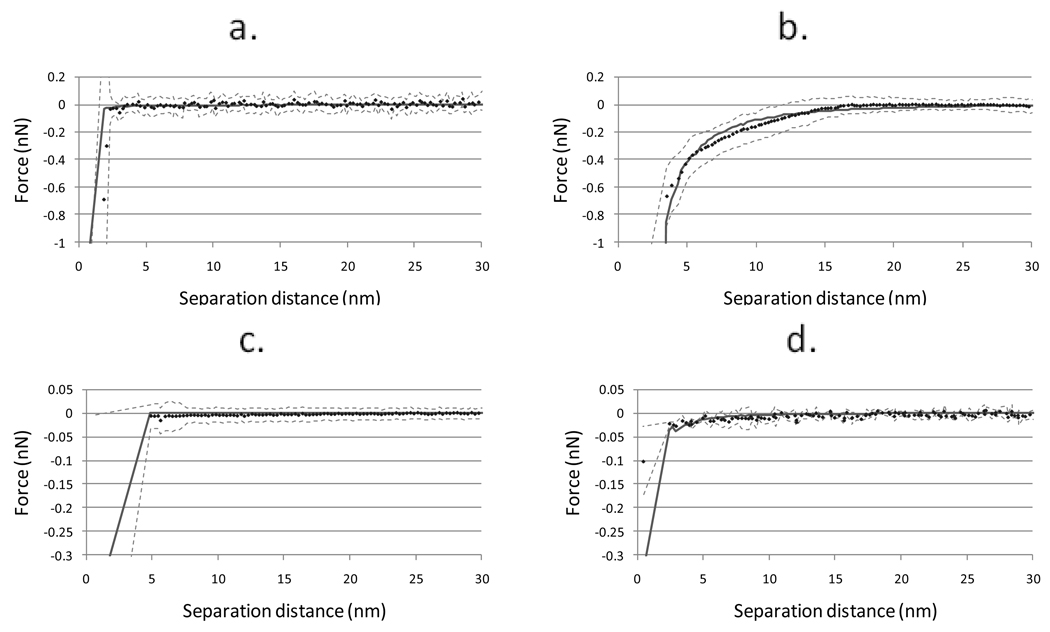
Effective Hamaker constants were calculated for the interactions between the PDMS films and silica or PSL by fitting the experimental data to a modeled approach curve with the Hamaker constant as the lone adjustable parameter. Figure 7 shows the average experimental force curves and their standard deviations and the modeled approach curves. The effective Hamaker constants used to create these curves are shown in Table 2. Steric repulsion due to compression of the dextran layer was not considered when evaluating the approaching curves. When the experimental data was evaluated, contact between the probe and surface was assumed to coincide with the maximum in the force gradient and not the bottom of the rounded force curve. This corresponds to the initial contact between the probes and the surface of the PDMS coating layer. During the modeling of the adhesion interactions, probe-substrate contact was assumed to occur when the probe-substrate separation distance was less than or equal to 0.4 nm at three different node pairs on the meshes describing the probe and substrate surfaces. Using this approach, steric compression of the dextran layer should not influence the effective Hamaker constants extracted.
Figure 7.
Average force curve (·) plus standard deviation (dashed lines) for each surface/probe pairing and modeled approach curve with least squares fit effective Hamaker constant (solid line). a: PDMS/silica; b: PDMS/PSL; c: dextran-PDMS/silica; d: dextran-PDMS/PSL
Table 2.
Effective Hamaker Constants
| Substrate | Effective Hamaker constant (A132) ×10−21 (J) | |
|---|---|---|
| silica | PSL | |
| PDMS | 61 | 52 |
| aminated PDMS | - | - |
| dextran-PDMS | 5.3 | 2.2 |
The effective Hamaker constants describing the vdW interactions between the PDMS film and the hydrophilic silica is roughly 15% larger than that between the PDMS and the hydrophobic PSL. This variation reflects differences in the dielectric properties and surface energies of the PDMS, PSL and silica. The fact that the effective constant is larger for the system containing the hydrophilic silica and the hydrophobic PDMS than for the system containing the hydrophobic PSL and the hydrophobic PDMS suggests that dielectric (vdW) interactions are dominant over any hydrophobic interactions that may be present. When the dextran coatings are introduced, the effective constants drop by roughly an order of magnitude in both cases, and the constant in the silica-PDMS system remains larger than that in the PSL-PDMS system. Because the roughness is taken into account in the calculation of the Hamaker constant, the reductions are independent of the morphology of the surfaces. Rather, these reductions occur because the dextran changes dramatically the amount of mass interacting between the probe and the substrate at the point of contact. In the absence of the dextran coating, the PSL and silica are able to approach the PDMS and contact it directly. When the dextran is attached to the PDMS, initial contact occurs between the probes and the outer surface of the dextran, not between the probes and the PDMS. As mentioned above, the dextran extends ~ 4–15 nm from the PDMS surface. The dextran is diffusely distributed over the PDMS surface, such that there is far less mass interacting in the regions of dextran-probe contact than in the regions of direct dextran-PDMS contact. In the vdW analysis performed here, these density variations manifest themselves as variations in the effective Hamaker constant. Similar to the case of the interactions with the PDMS, the variation in the effective Hamaker constants also reflects differences in the dielectric and surface energy (hydrophobic) properties of the dextran, PSL and silica.
3.6. Protein Adsorption
For the purpose of estimating the magnitude of the vdW and electrostatic forces when bovine serum albumin (BSA) molecules contact the various modified surfaces in aqueous solution, we modeled a single BSA molecule as a sphere with uniform composition and uniform potential. A zeta potential value of −14 mV and a hydrodynamic diameter of 9.5 nm were obtained in the literature for the BSA protein [26]. A computationally intensive numerical approach would be necessary to take into account the heart-shaped geometry of the BSA and its non-uniform charge/potential distribution, and this is not appropriate for the first order study proposed here. We further assumed that the effective Hamaker constants between the BSA and PDMS or dextran-PDMS surfaces are similar in magnitude to those obtained between the PSL and these surfaces in aqueous solution.
To estimate the role of electrostatic interactions in drawing the BSA towards the different PDMS surfaces, the electrostatic double layer forces were approximated using the measured zeta potentials and inverse Debye length according to the constant potential Hogg, Healy, Furstenau (HHF) [22] equation:
| Eq 2 |
where: = electrostatic double-layer interaction force between a flat plate and a sphere in an aqueous solution, in the case where the potentials on the plate and sphere are constant; ψ = surface potential; ε = dielectric constant of solution; εo = permittivity of free space; R = radius of BSA sphere; ζ1 = zeta potential of the BSA; ζ2 = zeta potential of the PDMS or dextran-PDMS; κ = inverse Debye length; and d = BSA-substrate separation distance.
While all of these species have negative potentials at the pH of interest (7.4), the presence of roughness on the surfaces lowers the height of the primary repulsive interaction energy barrier, facilitating deposition of particles as shown by Walz et al. [23]. Additionally, surface roughness causes greater deviations from the modeled electrostatic predictions as the asperity height becomes larger than the solution Debye length [24]. For these reasons, our electrostatic force predictions are only approximate, and are probably overpredictions of the actual electrostatic interaction force.
To estimate the vdW force between the BSA molecules and the PDMS or dextran-PDMS substrates, an idealized model for vdW adhesion between a smooth sphere and a smooth flat plate was used
| Eq 3 |
where: = vdW interaction force between the BSA and the PDMS or dextran-PDMS in aqueous solution; A132 = effective Hamaker constant for vdW interaction between BSA (1) and PDMS or dextran-PDMS (3) in aqueous solution (2); R = BSA radius; and d = separation distance between BSA and PDMS or dextran-PDMS.
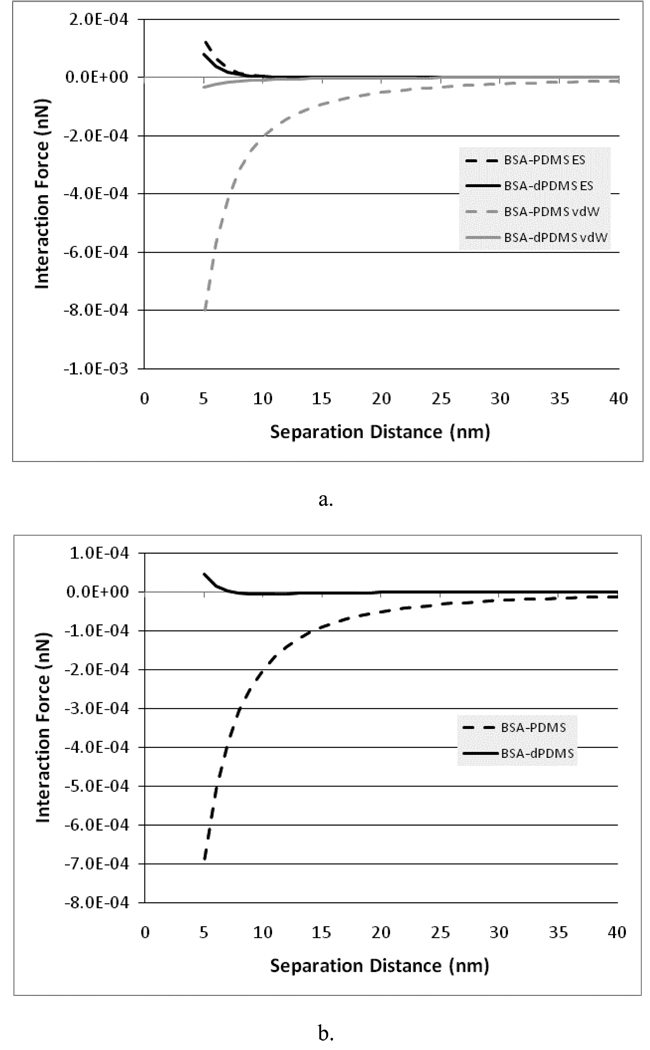
Figure 8a shows the predicted electrostatic double layer and vdW interaction forces between the BSA and the PDMS or dextran-PDMS. Figure 8b shows the net predicted interaction forces for these systems. As can be seen, there is relatively little variation in the electrostatic interactions between the surfaces when the substrate changes from PDMS to dextran-PDMS, but a dramatic difference in the magnitude of the vdW forces. In addition, the attractive vdW forces are far larger than the repulsive electrostatic forces at close contact when the PDMS is present, but in the case of the dextran-PDMS, the vdW forces are small enough that the repulsive electrostatic forces dominate the behavior near contact. As a result, it is expected that the dextran-PDMS surface will much more effectively repel BSA compared to the PDMS.
Figure 8.
a) van der Waals (vdW) and electrostatic double-layer (ES) forces between BSA and PDMS or dextran-PDMS (dPDMS) in PBS. b) Net (vdW + ES) force between BSA and PDMS or dextran-PDMS (dPDMS) in PBS.
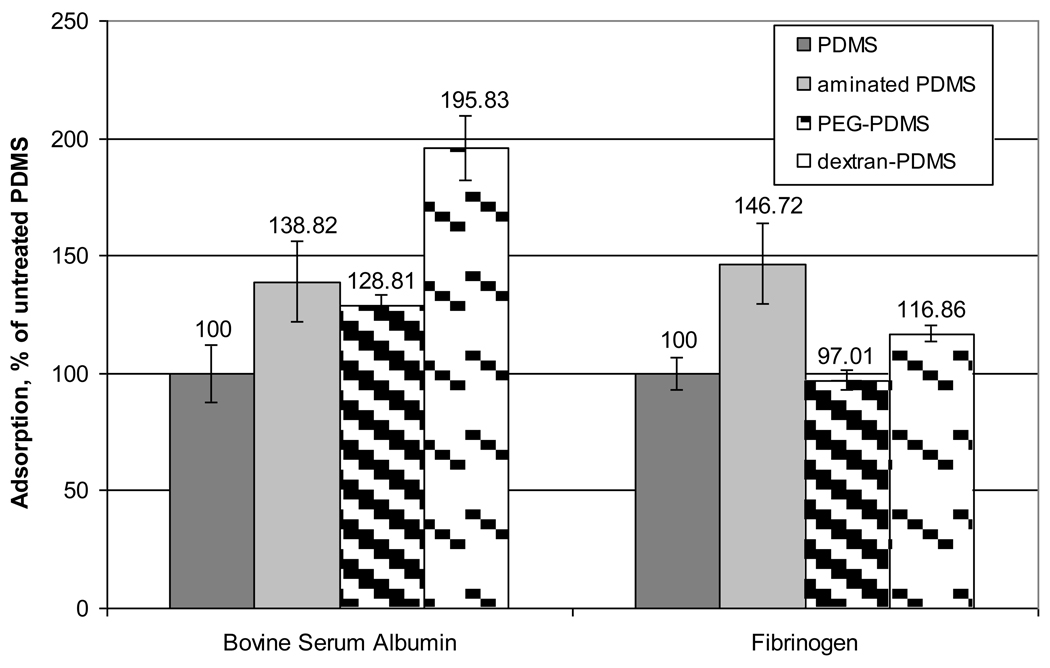
Figure 9 shows the measured relative intensities of protein adsorbed onto the engineered surfaces, as % adsorption. The aminated PDMS film was formed just prior to incubation in the protein solutions to minimize the hydrophobic recovery of the surface so that the effects of the aminosilane groups on protein adsorption could be seen. The aminated PDMS film appears to have a greater attraction to the proteins than the unmodified PDMS. Relative to the unmodified PDMS, the introduction of the amine groups has the same effect on the protein adsorption for these two proteins. As the aminated PDMS film ages, the underlying PDMS should return to the surface in the hydrophobic recovery process, and less protein should adsorb.
Figure 9.
Mean observed protein adsorption onto PDMS films (error bars represent 1 standard deviation about the mean). The mean and standard deviations are calculated from 8 measurements.
The pegylated PDMS surface adsorbed roughly the same amount of BSA as the aminated surface, which is roughly 30% larger than the amount on the unmodified PDMS. Fibrinogen adsorption on the pegylated PDMS was reduced to the same level as in the unmodified PDMS surface. The surface of the modified PDMS is expected to contain 3 types of material: 1) isolated patches of PEG, 2) aminosilane groups that were not successfully coupled to the PEG, and 3) unmodified PDMS that re-emerged on the surface. Immobilizing the PEG to the PDMS reduced the contact angle by about 10% and decreased the roughness significantly (although the cracks remained). As shown by Prime and Whitesides and Li and et al., PEG must have a surface coverage of 50% or greater to effectively reduce protein adsorption [27, 28]. In this work, this threshold coverage was not achieved. As a result, fibrinogen experiences relatively little difference in attraction for the relatively smooth PDMS that has recovered much of its original character. The BSA, which by comparison is much smaller than the fibrinogen, retains a somewhat higher level of attraction to the partially recovered PDMS, presumably because it can access smaller surface nonuniformities and because it interacts more strongly with amine groups that have not been re-absorbed.
Figure 9 shows that the immobilization of dextran on the PDMS substantially increased the BSA adsorption compared to the untreated surface. Dextran immobilization also increased the fibrinogen adsorption, but not to the extent seen in the presence of the amination. These results appear to be at odds with the interaction forces that were measured between the PSL spheres and the dextran-PDMS surface. However, if one considers the distribution of dextran on the surface, these results come into perspective. Specifically, dextran clusters on the order of about 10 nanometers in height are spaced anywhere from 50 to a few hundred nanometers apart. In the case of the micron-scale PSL probes, the interactions with the modified surface are limited to those between the probe materials and sparse amounts of dextran. The proteins, on the other hand, can interact with the dextran or move readily between the dextran molecules and interact with the PDMS surface directly. As can be seen by the contact angle results, the dextran is effective at maintaining the PDMS surface in a hydrophilic state. This suggests that beneath the dextran on the PDMS, the surface is largely comprised of oxidized PDMS and aminated PDMS groups. The protein interactions with these groups are most closely simulated by the protein interactions with the aminated surfaces. The BSA and fibrinogen interacted with both these surfaces strongly compared to the unmodified substrate, and the relative interactions were comparable between the two proteins.
When the fibrinogen interacts with the modified PDMS surface between the dextran immobilization sites (a mix of oxidized PDMS and aminated PDMS), the interaction is favored compared to the unmodified case. However, the net adsorption in the fibrinogen/dextran-PDMS system is reduced compared to the fibrinogen/aminated PDMS system. This suggests that the interactions between dextran and fibrinogen are not strong compared to those between fibrinogen and the underlying modified PDMS, and that the dextran is effective at shielding some of the modified PDMS substrate from the fibrinogen.
When the BSA interacts with the modified PDMS surface between the dextran immobilization sites (a mix of oxidized PDMS and aminated PDMS), the interaction is slightly stronger than in the fibrinogen system (compared to the unmodified case). However, when the BSA interacts with the dextran, the net adsorption rises considerably. This is hypothesized to be due to the fact that the BSA is very small compared to the dextran, and it can readily become entangled or engulfed within the dextran loops. If the dextran does engulf the BSA, the amount of mass in close contact between these species will increase the vdW interactions between them, further increasing the strength of the entanglement. As a result, the sparse dextran coating on the PDMS increases the BSA adhesion by ~50% compared to the aminated surface. Overall, PDMS has already been shown to have a high resistance to protein adsorption, despite its hydrophobicity [29] and this was not further improved by the addition of these surface modifiers.
4. Conclusions
Oxidized dextran was covalently attached to PDMS in a side-on configuration, thereby increasing the roughness and hydrophilicity of the surface. This did not result in an overall decrease in the amount of fibrinogen and BSA adsorbed from a 1×PBS solution. This was attributed largely to the sparseness of the dextran coating on the modified PDMS, which was not effective in shielding the modified substrate from the proteins, and also to entanglement of BSA in the dextran. PEG was immobilized in the end-on conformation, however the surface returned to the original state of the hydrophobic PDMS. AFM force evaluations between model hydrophilic and hydrophobic particles and the modified surfaces in the electrolyte solutions were interpreted using a vdW force model and HHF constant potential electrostatic equation, and it was shown that electrostatic interactions are not as significant as vdW and hydrophobic interactions in attracting proteins to the PDMS or modified-PDMS surfaces.
ACKNOWLEDGEMENTS
The authors gratefully acknowledge financial support from the National Institute of Health (Grant 5R01EB004761), the National Aeronautic and Space Administration (#14533), the National Science Foundation Engineering Research Centered for Structured Organic Particulate Systems (Grant EEC-0540855), and the Purdue Shreve Trust.
Footnotes
Publisher's Disclaimer: This is a PDF file of an unedited manuscript that has been accepted for publication. As a service to our customers we are providing this early version of the manuscript. The manuscript will undergo copyediting, typesetting, and review of the resulting proof before it is published in its final citable form. Please note that during the production process errors may be discovered which could affect the content, and all legal disclaimers that apply to the journal pertain.
References
- 1.Zongming Gao JSN, Mark JamesE, Sakr Adel. Poly(dimethylsiloxane) coatings for controlled drug release. III. Drug release profiles and swelling properties of the free-standing films. Journal of Applied Polymer Science. 2005;96(2):494–501. [Google Scholar]
- 2.Makamba H, et al. Surface modification of poly(dimethylsiloxane) microchannels. Electrophoresis. 2003;24(21):3607–3619. doi: 10.1002/elps.200305627. [DOI] [PubMed] [Google Scholar]
- 3.Qin D, Xia YN, Whitesides GM. Rapid prototyping of complex structures with feature sizes larger than 20 mu m. Advanced Materials. 1996;8(11):917–919. [Google Scholar]
- 4.Duffy DC, et al. Rapid prototyping of microfluidic systems in poly(dimethylsiloxane) Analytical Chemistry. 1998;70(23):4974–4984. doi: 10.1021/ac980656z. [DOI] [PubMed] [Google Scholar]
- 5.Abbasi F, Mirzadeh H, Katbab AA. Modification of polysiloxane polymers for biomedical applications: a review. Polymer International. 2001;50(12):1279–1287. [Google Scholar]
- 6.Rangel EC, Gadioli GZ, Cruz NC. Investigations on the stability of plasma modified silicone surfaces. Plasmas and Polymers. 2004;9(1):35–48. [Google Scholar]
- 7.Bar G, et al. Investigation of the stiffness change in, the indentation force and the hydrophobic recovery of plasma-oxidized polydimethylsiloxane surfaces by tapping mode atomic force microscopy. Polymer. 2001;42(8):3627–3632. [Google Scholar]
- 8.Osterberg E, et al. Comparison of Polysaccharide and Poly(Ethylene Glycol) Coatings for Reduction of Protein Adsorption on Polystyrene Surfaces. Colloids and Surfaces a-Physicochemical and Engineering Aspects. 1993;77(2):159–169. [Google Scholar]
- 9.Osterberg E, et al. Protein-rejecting ability of surface-bound dextran in end-on and side-on configurations: comparison to PEG. Journal of Biomedical Materials Research. 1995;29(6):741–747. doi: 10.1002/jbm.820290610. [DOI] [PubMed] [Google Scholar]
- 10.Cooper K, et al. Analysis of contact interactions between a rough deformable colloid and a smooth substrate. Journal of Colloid and Interface Science. 2000;222(1):63–74. doi: 10.1006/jcis.1999.6561. [DOI] [PubMed] [Google Scholar]
- 11.Yongsunthon R, Lower SK. Force spectroscopy of bonds that form between a Staphylococcus bacterium and silica or polystyrene substrates. Journal of Electron Spectroscopy and Related Phenomena. 2006;150(2–3):228–234. [Google Scholar]
- 12.Eichenlaub S, Chan C, Beaudoin SP. Hamaker constants in integrated circuit metalization. Journal of Colloid and Interface Science. 2002;248(2):389–397. doi: 10.1006/jcis.2002.8241. [DOI] [PubMed] [Google Scholar]
- 13.von Baeyer H, Kochinke R, Schwerdtfeger R. Cascade plasmapheresis with online membrane regeneration: laboratory and clinical studies. Journal of Membrane Science. 1985;22:297. [Google Scholar]
- 14.Wilson MB, Nakane PK. Covalent Coupling of Proteins to Periodate-Oxidized Sephadex - New Approach to Immunoadsorbent Preparation. Journal of Immunological Methods. 1976;12(1–2):171–181. doi: 10.1016/0022-1759(76)90107-1. [DOI] [PubMed] [Google Scholar]
- 15.Kingshott P, Thissen H, Griesser HJ. Effects of cloud-point grafting, chain length, and density of PEG layers on competitive adsorption of ocular proteins. Biomaterials. 2002;23(9):2043–2056. doi: 10.1016/s0142-9612(01)00334-9. [DOI] [PubMed] [Google Scholar]
- 16.Cooper K, Gupta A, Beaudoin S. Substrate morphology and particle adhesion in reacting systems. Journal of Colloid and Interface Science. 2000;228(2):213–219. doi: 10.1006/jcis.2000.6881. [DOI] [PubMed] [Google Scholar]
- 17.Cooper K, Gupta A, Beaudoin S. Simulation of the adhesion of particles to surfaces. Journal of Colloid and Interface Science. 2001;234(2):284–292. doi: 10.1006/jcis.2000.7276. [DOI] [PubMed] [Google Scholar]
- 18.Ducker WA, Senden TJ, Pashley RM. Measurement of Forces in Liquids Using a Force Microscope. Langmuir. 1992;8(7):1831–1836. [Google Scholar]
- 19.Jaiswal R. Chemical Engineering. West Lafayette: Purdue University; 2008. Adhesion Between Particles and Nano-Structured Films. [Google Scholar]
- 20.Eichenlaub S, Kumar G, Beaudoin S. A modeling approach to describe the adhesion of rough, asymmetric particles to surfaces. Journal of Colloid and Interface Science. 2006;299(2):656–664. doi: 10.1016/j.jcis.2006.03.010. [DOI] [PubMed] [Google Scholar]
- 21.Menon V. Particle Adhesion to Surfaces: Theory of Cleaning. In: Donovan RP, editor. Particle Control for Semiconductor Manufacturing. New York: Marcel Dekker; 1990. [Google Scholar]
- 22.Hogg R, Healy TW, Fuerstenau DW. Mutual Coagulation of Colloidal Dispersions. Transactions of the Faraday Society. 1966;62:1638. [Google Scholar]
- 23.Walz JY, Suresh L, Piech M. The effect of nanoscale roughness on long range interaction forces. Journal of Nanoparticle Research. 1999;1(1):99–113. [Google Scholar]
- 24.Bowen RW, Doneva TA, Stoton JAG. The use of atomic force microscopy to quantify membrane surface electrical properties. Colloids and Surfaces A: Physicochemical and Engineering Aspects. 2002;(201):73–83. [Google Scholar]
- 25.Hayes RA. The electrokinetic behaviour of surfaces modified by particle adsorption. Colloids and Surfaces A: Physicochemical and Engineering Aspects. 1999;146(1–3):89–94. [Google Scholar]
- 26.Mattison KW, Kaszuba M. Automated Protein Characterization. American Biotechnology Laboratory. 2004 December [Google Scholar]
- 27.Prime KL, Whitesides GM. Adsorption of Proteins onto Surfaces Containing End- Attached Oligo(Ethylene Oxide) - a Model System Using Self-Assembled Monolayers. Journal of the American Chemical Society. 1993;115(23):10714–10721. [Google Scholar]
- 28.Li LY, et al. Protein adsorption on oligo(ethylene glycol)-terminated alkanethiolate self-assembled monolayers: The molecular basis for nonfouling behavior. Journal of Physical Chemistry B. 2005;109(7):2934–2941. doi: 10.1021/jp0473321. [DOI] [PubMed] [Google Scholar]
- 29.Sapsford KE, Ligler FS. Real-time analysis of protein adsorption to a variety of thin films. Biosensors and Bioelectronics. 2004;19(9):1045–1055. doi: 10.1016/j.bios.2003.10.002. [DOI] [PubMed] [Google Scholar]


