

Abstract
Research on inhibitory motor control has implicated several prefrontal as well as subcortical and parietal regions in response inhibition. Whether prefrontal regions are critical for inhibition, attention or task-set representation is still under debate. We investigated the influence of the lateral PFC in a response inhibition task by using cognitive electrophysiology in prefrontal lesion patients. Patients and age- and education-matched controls performed in a visual Stop-signal task featuring lateralized stimuli, designed to challenge either the intact or lesioned hemisphere. Participants also underwent a purely behavioral Go/Nogo task, which included a manipulation of inhibition difficulty (blocks with 50 vs. 80 % go-trials) and a Change-signal task that required switching to an alternative response. Patients and controls did not differ in their inhibitory speed (stop-signal and change-signal reaction time, SSRT and CSRT), but patients made more errors in the Go/Nogo task and showed more variable performance. The behavioral data stress the role of the PFC in maintaining inhibitory control but not in actual inhibition. These results support a dissociation between action cancellation and PFC- dependent action restraint. Laplacian transformed event-related potentials (ERPs) revealed reduced parietal activity in PFC patients in response to the stop-signals, and increased frontal activity over the intact hemisphere. This electrophysiological finding supports altered PFC- dependent visual processing of the stop-signal in parietal areas and compensatory activity in the intact frontal cortex. No group differences were found in the mu and beta decrease as measures of response preparation and inhibition at electrodes over sensorimotor cortex. Taken together, the data provide evidence for a central role of the lateral PFC in attentional control in the context of response inhibition.
Keywords: lateral PFC, lesion, SSRT, stop-signal task, cognitive control
1. Introduction
Inhibiting a motor response that is no longer required is an important aspect of cognitive control. Extensive research implicates the prefrontal cortex (PFC) in inhibitory motor control and is supported by results from functional imaging (Aron et al., 2007; Rubia et al., 2001; Wager et al., 2005), cognitive electrophysiology (Liotti et al., 2005; Ramautar et al., 2006b; Schmajuk et al., 2006) and lesion studies (Aron et al., 2003; Leimkuhler and Mesulam, 1985; Picton et al., 2006; Swick et al., 2008). There is an ongoing debate, however, about what specific role the PFC plays in response inhibition. It is unclear whether the PFC is involved in directing attention to the stop-signal, in inhibiting the motor output or, more generally, in updating an action plan (Aron, 2010; Chao et al., 2009; Li et al., 2006; Verbruggen et al., 2010). We addressed this question by having patients with unilateral PFC lesions perform three standard paradigms tapping into response inhibition while we recorded behavioral responses and/or their electrical brain activity (electroencephalography, EEG).
Neuroimaging studies of response inhibition have identified a set of regions activated in conditions that require withholding a motor response. Specifically, a network comprising the inferior frontal gyrus (IFG), dorsolateral PFC, inferior parietal lobule, pre-supplementary motor area (pre-SMA) and basal ganglia nuclei is typically found in fMRI-studies of response inhibition (Chikazoe, 2010; Rubia et al., 2001; Wager et al., 2005). Whereas inferior parietal activity is generally believed to be caused by attentional capture by the often infrequent and highly task-relevant stop-signal (Boehler et al., 2010; Wager et al., 2005), the case is less clear for prefrontal areas. An influential model holds the right IFG responsible for inhibiting the motor output via connections with the subthalamic nucleus and pre-SMA (Aron et al., 2007; Aron et al., 2004). Other research questions this model and claims a critical role in response inhibition for the pre-SMA, whereas the IFG is assumed to subserve task-set updating or signal monitoring (Li et al., 2006; Mostofsky and Simmonds, 2008; Simmonds et al., 2008).
The classical paradigms used to study response inhibition are the Stop-signal task and the Go/Nogo task. In the Stop-signal task, participants are required to perform in a choice reaction time task with infrequent stop-trials embedded (Logan et al., 1984). In stop-trials, the go-signal is followed after a short delay by the stop-signal indicating to withhold the response. In the Go/Nogo task, nogo-signals are presented intermixed with go-signals. Thus, the Stop-signal task requires the cancellation of an already prepared response, whereas the Go/Nogo task calls for action restraint (Eagle et al., 2008; Schachar et al., 2007). Finally, the Change-signal task demands switching to an alternative response, i.e. inhibiting one response and executing an alternate one (De Jong et al., 1995; Krämer et al., 2011).
In the current study, we investigated the critical role of the PFC in response inhibition with a combined lesion and electrophysiological approach. We examined PFC patients’ inhibitory speed and ability for response cancellation (stop- and change-signal reaction time, SSRT and CSRT) and action restraint (commission errors in the Go/Nogo task). Additionally, we recorded their EEG while they performed in the Stop-signal task, which featured lateralized go- and stop-stimuli. Previous attention studies in PFC patients have shown performance deficits for contralesional target stimuli, which was associated with reduced activity over occipital and temporo-parietal areas (Barcelo et al., 2000; Knight, 1997; Yago et al., 2004) of the PFC lesioned hemisphere. This is proposed to result from diminished excitatory input from prefrontal areas to visual regions. In the present study, we lateralized the stop-signal, challenging either the affected or unaffected hemisphere. Patients performed the task with their ipsilesional, i.e. unaffected hand. If the PFC is involved primarily in attentional control in the context of response inhibition, this should result in diminished activity over parietal cortex of the lesioned hemisphere. Conversely, a specific inhibitory motor impairment was predicted to lead to altered activity over sensorimotor cortex related to motor preparation and inhibition (Alegre et al., 2004; Krämer et al., 2011; Pfurtscheller and Lopes da Silva, 1999).
2. Methods
2.1 Participants
Fourteen (8 women; 53.9 ± 8 years old) patients with focal unilateral prefrontal lesions (5 right, 9 left hemisphere) participated in the study (Figure 1D). Fifteen (9 women; 56.9 ± 7 y) healthy, age- and education-matched participants served as controls. Patients had on average 15.8 years of education (± 3.6) and controls had 17.4 years of education (± 2.3; p =.12). Lesion etiology was either a stroke (n = 9) or a low grade glioma resection (n = 5). Due to excessive horizontal eye movements in the Stop-signal task, three patients (two right-sided lesion) had to be excluded from the EEG analyses. Three controls had to be excluded from EEG analyses because of excessive artifacts (n = 2) or an inhibition rate < 25 % (n = 1). These participants were included in the behavioral analyses (except the control with the low inhibition rate) resulting in groups of n = 14 for the behavioral and n = 11 (8 left lesion, 3 right lesion) and 12 for the EEG analyses of the stop-signal task. Due to technical problems, data from the Go/Nogo task of two PFC patients (one rPFC, one lPFC) were lost as well as Change-signal task data from one PFC patient (rPFC). None of the patients or controls had any other neurological or psychiatric disease or any history of substance abuse. All participants had normal or corrected-to-normal vision. The study was performed in agreement with the Declaration of Helsinki. All subjects gave informed consent approved by the University of California, Berkeley Committee for Protection of Human Subjects and the Department of Veterans Affairs Northern California Health Care System Human Research Protection Program or the Norwegian Regional Committee for Medical Research Ethics, Region South. Participants received money for participation.
Figure 1. Paradigms and patients.

A Stop-Signal task featuring lateral stimuli as go- (white bar) and stop-signals (red bar). B Go/Nogo task with green square as go-signal and red square as nogo-signal. C Change-signal task with arrows indicating a right or left button press. D Overlay of lesion reconstructions of the PFC patients. The color coding indicates the number of patients with damaged tissue in that area. Note that right-sided lesions are flipped.
2.2 Task and procedure
Participants performed first in a Stop-signal task while their EEG was recorded and afterwards in a Go/Nogo-task and a Change-signal task without EEG-recording.
For the stop-signal task, we used lateralized stimuli to test for possible PFC lesion x hemifield of presentation effects. The go-signal was a white bar (width about .5° visual angle) presented 5° either to the right or left side from a central fixation cross which required a right or left button press, respectively. Participants used the index and middle finger of one hand for the task. Patients used their ipsilesional hand, i.e. left lesion patients used their non-dominant hand. To account for this, we asked as many controls to also use their non-dominant hand. In 25 % of the trials, a stop-signal, i.e. a red bar was presented after a variable delay indicating to stop the response. The delay of the stop-signal was adapted based on a staircase-tracking algorithm to yield an inhibition rate of about 50 % (Band et al., 2003). After every successful inhibition, the delay was prolonged by 10 ms, whereas the delay was shortened by 10 ms after every failed inhibition. The tracking was performed across both hands. The longest possible delay was set to 480 ms and the shortest to 20 ms. Participants were instructed in the beginning to be both as fast and as accurate as possible and not to wait for the stop-signal. The order of go- and stop-trials was randomized with the constraint of not more than two consecutive stop-trials. The stop-signal reaction time (SSRT) was calculated by sorting participant’s correct go reaction times and subtracting the n-th percentile from the average stop-signal delay with n being the inhibition rate (Band et al., 2003). This was done separately for left and right responses. Go- and stop-stimulus duration was 100 ms, trial duration was variable between 1.4 and 1.6 s. Participants had two practice blocks of 50 trials each to get acquainted to the task, the first block without stop-trials and the second with stop-trials. The main experiment comprised 10 blocks with each 160 trials, taking about 50 minutes in total.
In the Go/Nogo-task, all stimuli were presented in the centre of the screen. A green square served as go-signal and a red square as nogo-signal. Responses were given with the index finger and patients used their ipsilesional hand. Stimulus duration was 100 ms with 1.1 to 1.4 s jittered interstimulus-interval. Six alternating blocks with either 80 % or 50 % go-trials were presented, each comprising 100 trials. Including blocks with 80 % compared to 50 % of go-trials served as a manipulation of inhibition difficulty with 80 % go-trials being the condition with a high bias for fast responses and thereby more demanding in terms of inhibitory control (Krämer et al., 2009; Swick et al., 2008). Participants had 20 practice trials to familiarize themselves with the task. Task duration was about 15 minutes.
In the Change-signal task, arrows presented in the centre and pointing to the left or right served as go-stimuli, requiring a left or right button press, respectively. Responses were given with the index or middle finger and patients used their ipsilesional hand. In 25 % of the trials, the arrow changed its direction, indicating the need to inhibit the already prepared response and switch to the alternative response. The delay of the change-signal was adapted based on a staircase-tracking algorithm (see stop-signal task). Go-stimulus duration was 500 ms and the change-signal delay could increase up to 480 ms. Trial duration was variable between 1.2 to 1.4 s. Participants had two practice blocks with first go-trials only and then go- and change-trials to get acquainted with the task. The experiment proper included 480 trials and took about 15 minutes.
2.3 EEG recordings
The EEG was recorded with a 64 + 8 channel BioSemi ActiveTwo amplifier with a sampling rate of 512 Hz. The horizontal EOG was recorded with electrodes placed at both external canthi; vertical eye movements (VEOG) were monitored with an electrode placed below the right eye and a frontopolar electrode. Participants were instructed to fixate a cross presented in the center of the screen throughout the task. Response buttons were the right and left mouse button and participants used the index and middle finger of their ipsilesional hand to respond. Eleven controls responded with their non-dominant hand (left) to match the patients with left hemisphere lesions. The EEG data was referenced offline to the average potential of two earlobe electrodes and low-pass filtered with 30 Hz. Analyses were performed with custom-written scripts in MATLAB (Natick, MA) and the EEGLAB toolbox (Delorme and Makeig, 2004). Vertical eye movements were corrected based on an independent component analysis as implemented in EEGLAB and trials with horizontal eye movement or muscle artifacts were automatically rejected from the analysis (amplitude threshold for rejection at HEOG: 40 μV, at scalp electrodes: 80 μV). Electrodes of patients with right hemisphere lesions and controls responding with their right hand were swapped across the midline in order to average and plot data from the lesioned vs. non-lesioned hemisphere, i.e. ipsi- or contralateral to the response hand.
2.4 Data analyses
Behavioral analyses
For the stop-signal task, reaction times, error rates and percentage of missed go-trials were computed separately for ipsi- and contralesional stimuli and submitted to a repeated measures ANOVA with the within-subject factor Laterality and the between-subject factor Group (prefrontal lesion patients, PFC, vs. controls, CTR). Also, the stop-signal reaction time (SSRT) was assessed separately for ipsi- and contralesional stimuli. Previous studies found an effect of prefrontal lesions on response variability rather than average reaction times. To address this, we calculated an intraindividual coefficient of variability (ICV) by computing each participant’s standard deviance of go reaction times relative to the individual’s average reaction time (Stuss et al., 2003). This was done separately for each of the ten blocks (each comprising 120 go-trials) and averaged across blocks. To estimate the baseline reaction time irrespective of any slowing caused by the introduction of stop-signals, we computed the median reaction time of the 40 last go-trials in the first practice block. We were thus able to test for group differences in the baseline reaction time and in reaction time changes due to the stop-signal, i.e. proactive inhibitory control (Verbruggen and Logan, 2009).
For the Go/Nogo task, reaction times and both commission and omission error rates were computed separately for the 50 and 80% go-blocks. As in the stop-signal task, we also assessed participants’ variability in reaction times by computing the standard deviance relative to the average reaction time. For the change-signal task, reaction times, error rates and change-signal reaction time (CSRT) were computed and compared between groups with independent t-tests.
To assess individual patient’s behavior relative to the control group, we calculated both the z-score as effect size and determined significance of differences using a (one-tailed) t-test as recommended by Crawford and Garthwaite (2011) with the formula
with x* being the individual’s score, x̄ the group’s mean and s the group’s standard deviance.
ERP analyses
As go- and stop-signals in stop-trials are presented with short interstimulus-intervals (average 350 ms), ERPs of the stop-stimuli might be distorted due to the overlap with the go-ERP. To yield an estimate of a “pure” stop-signal ERP, we computed difference waveforms separately for successful stop-trials and contra- and ipsilesional stimuli. This approach is based on the ADJAR method (Woldorff, 1993) and has previously been applied to ERP-analyses of the stop-signal task (Krämer et al., 2011; Ramautar, 2004; Ramautar et al., 2006a). Specifically, we shifted go-ERPs from the respective reaction time distribution (i.e. slow reactions for successful inhibitions) and stimulus laterality across the range of individuals’ stop-signal delays weighted by the actual occurrence of that delay and averaged them. These go-ERPs were then subtracted from successful inhibitions (Krämer et al., 2011; Ramautar et al., 2004; Ramautar et al., 2006b) to yield a stop-signal ERP independent of the preceding go-ERP. Current source density interpolation of the go-stimulus-locked ERPs in go-trials and stop-stimulus-locked ERPs in stop-trials was estimated through Laplacian computation based on a spherical spline interpolation (using a spline order of 4) (Kayser and Tenke, 2006) using a toolbox for Matlab (Kayser, 2009).
To assess statistical differences between the conditions, average amplitudes in the time-windows of interest were subjected to repeated measures ANOVAs. The time windows of interest were based on previous studies (Ramautar et al., 2006b; Schmajuk et al., 2006) and visual inspection of the peak latency of the components of interest. To reduce the number of statistical comparisons and to improve the signal-to-noise ratio, we clustered electrodes over regions of interest, i.e. parieto-occipital or frontal areas. The clusters were left parieto-occipital (P5, P7, PO3, PO7), right parieto-occipital (P6, P8, PO4, PO8), left frontal (F3, F5, FC3, FC5) and right frontal (F4, F6, FC4, FC6). For analyses of the stop-N2, we also included a medio-frontal cluster (C1, Cz, C2, CPz). Note that clustering the electrodes after CSD interpolation degrades spatial resolution again to some extent. We decided to use electrode clustering as it improves signal-to-noise ratio and group differences depend less on individual electrode selection. For visualization only, the data were low-pass filtered with 15Hz.
Time-frequency analyses
To study the inhibition-related power changes in the mu and beta frequency bands over motor cortex, single trial data at C3 and C4 were convolved with a complex Morlet wavelet:
with the relation f0/σf (where σf = 1/(2πσt) set to 6.7 (Tallon-Baudry et al., 1997). Time- frequency analyses (including phase-coupling analyses, see below) were performed on Laplacian transformed data. Specifically, we computed and averaged for each subject changes in time varying energy (square of the convolution between wavelet and signal) in the studied frequencies (from 1 to 25Hz; linear increase) with respect to baseline. As we were interested in correlates of motor preparation and inhibition in stop-trials, we analyzed the relative power change after the go-signal in inhibited and non-inhibited stop-trials. Selection of the analyzed mu (10 – 13Hz) and beta frequencies (15 – 22Hz) was based on previous research and visual inspection of the data (Krämer et al., 2011; Marco-Pallares et al., 2008). For all statistical effects involving more than one degree of freedom in the numerator, the Huynh-Feldt correction was applied to correct for possible violations of the sphericity assumption (Huynh and Feldt, 1976). We report the uncorrected degrees of freedom and the corrected probabilities.
We also analyzed the phase-coupling between electrode clusters as a measure of inter-electrode synchrony. Phase synchrony has gained increasing interest during the last years as a measure of both local computations, possibly subserving perceptual binding (Singer and Gray, 1995), as well as large-scale integration (Fries, 2005). We computed the phase relation between electrodes as phase-locking value (PLV) following Lachaux et al. (1999):
with N being the number of trials and φe1 and φe2 being the instantaneous phase of electrodes 1 and 2. As for the ERP analyses, we first averaged the signal within each electrode cluster and then computed the PLV with every other electrode cluster. To estimate changes in phase-coupling after the stimulus, we computed the percent signal change relative to a baseline of 500 to 50ms before the stimulus. Condition and group effects were evaluated with repeated measures ANOVAs.
3. Results
3.1 Behavioral data
Stop-signal-task
As mentioned in the method section, the behavioral data will be presented for all PFC patients (n = 14), whereas patients with excessive eye movement artifacts were excluded from EEG analyses, yielding a sample of 11 patients. Behavioral results of patients and controls are presented in Table 1 and Figure 2. Patients had longer reaction times for contra- compared to ipsilesional go-stimuli (contralesional: 652 ms vs. ipsilesional: 629 ms; t13 = −2.3, p = .04). However, the ANOVA testing for Group and Hemifield effects did not yield significant main effects or interactions (interaction Group x Hemifield: p = .094). Patients made more errors in the go-task (F1,26 = 7.7, p = .01) and missed more go-trials (F1,26 = 7.1, p = .013), which did not differ between hemifields (both p > .1). PFC patients also showed more variable reaction times compared to controls (Group: F1,26 = 7.6, p = .011; see figure 2A left). We also assessed participants’ baseline reaction time in the practice block, but did not detect any group differences (F < 1). With respect to inhibitory performance, the staircase-tracking algorithm resulted in 55 % successful inhibitions with no group differences (F < 1) or laterality effects (F < 1). Importantly, PFC patients did not differ from controls in their inhibitory speed, i.e. the SSRT (F < 1) or the average stop-signal delay (F < 1; see figure 2A right). There was a trend for a slower SSRT for contra- compared to ipsilesional stimuli in patients, but the interaction of Group x Hemifield was only marginal (F1,26 = 2.98, p = .096).
Table 1.
Behavioral results
| CTR | PFC | |||
|---|---|---|---|---|
| Stop-Signal task | IL | CL | IL | CL |
| N | 14 | 14 (9 L, 5 R) | ||
| RT | 623 (88) | 623 (91) | 629 (86) | 652 (90) |
| RT baseline | 371 (62) | 399 (103) | ||
| ICV | .21 (.03) | .26 (.06) | ||
| Go-errors | 1.8 (1.7) | 2.3 (2.8) | 11 (13.7) | 7.6 (7) |
| Go-omissions | 7.8 (7) | 8.9 (9) | 41 (51) | 51 (56) |
| % inhibitions | 56 (08) | 54 (8) | 53 (8) | 56 (9) |
| Stop-signal delay | 350 (79) | 351 (79) | 350 (75) | 351 (76) |
| SSRT | 232 (26) | 232 (28) | 235 (49) | 250 (51) |
| Go/Nogo task | 50% | 80% | 50% | 80% |
| N | 14 | 12 (8 L, 4 R) | ||
| RT | 378 (45) | 357 (51) | 389 (66) | 349 (68) |
| % go correct | 99.9 (.2) | 99.8 (.4) | 97.1 (6) | 97.0 (5) |
| % commission errors | 2.8 (2.9) | 8.2 (4.8) | 9.3 (7.9) | 20.7 (12.7) |
| ICV | .20 (.03) | .23 (.04) | .27 (.10) | .29 (.12) |
| Change-signal task | ||||
| N | 14 | 13 (9 L, 4 R) | ||
| RT | 509 (112) | 549 (92) | ||
| go errors | 7.7 (5.6) | 31.5 (25) | ||
| % go omissions | 2.4 (1.5) | 22 (22.4) | ||
| CSRT | 251 (24) | 272 (55) | ||
Behavioral results for controls (CTR) and prefrontal lesion patients (PFC). N gives the number of included participants for the different tasks (L left-sided lesion, R right-sided lesion). Significant group differences are highlighted in bold. IL ipsilesional; CL contralesional; RT reaction time (ms); ICV intraindividual coefficient of variability; SSRT Stop-signal reaction time; CSRT Change-signal reaction time. Values in brackets give the standard deviance.
Figure 2. Behavioral results.

A Results of the Stop-signal task showing an enhanced reaction time variability in the go task (intraindividual coefficient of variance, ICV; left side), but no significant differences between patients (PFC) and controls (CTR) in the stop-signal reaction time (SSRT; right side). B SSRT (left: contralesional stop-stimuli; right panel: ipsilesional stop-stimuli) of every patient relative to their lesion extent of the inferior frontal gyrus (BA 44/45; determined based on probabilistic Jülich brain atlas; (Eickhoff et al., 2005)), separately for right (triangles) and left (dots) lesion patients showing no correlation between right or left IFG damage and SSRT. Dashed lines depict the average controls’ SSRT and +/− one standard deviance. C Rate of commission errors in the Go/Nogo task in 50 and 80 % go blocks. Participants made more errors in the more demanding conditions and patients made overall more errors. D No group difference was found in the inhibitory speed (change-signal reaction time, CSRT) in the Change-signal task.
Because of previous reports of a specific role of the right IFG in response inhibition, we performed further analyses. First, we compared right and left lesion patients in their behavioral measures with non-parametric tests (Mann-Whitney-U-test) and did not find any group difference (SSRT of right PFC patients: 233 ms and left patients: 249 ms). Next, we examined individual patient’s SSRT against their extent of damage to the IFG (Figure 2B), but no relationship or trend for a correlation was observed. Importantly, four out of five rPFC lesion patients performed within +/− one standard deviance of the control participants, despite clear rIFG damage in three of them (Figure 2B). One rPFC patient’ SSRT was above one standard deviance from controls, but significantly different from controls only for contralesional stimuli (z-score IL: 1.4, p > .1; z-score CL: 2.9, p < .01). Notably, two lPFC patients performed worse than controls both for ipsilesional stimuli (z-scores: 4.8 and 3.1, both p < .01) and contralesional stimuli (z-scores: 4.4 and 3.6, both p < .01). The rPFC patient’s lesion comprised besides the rIFG also Brodmann areas 6, 8, 9, and 46 (determined using MRIcron). Both lPFC patients also had extensive PFC damage, including Brodmann areas 4, 6, 8, 9, 43, and 47.
Go/Nogo-task
Both patients and controls were faster and made more commission errors in the 80 compared to 50 % go-blocks (Difficulty effect on reaction times: F1,24 = 63.8, p < .001, on error rate: F1,24 = 50.4, p < .001; Table 1), but the difficulty effect was more pronounced in PFC patients (Difficulty x Group on reaction times: F1,24 = 6.5, p = .018; error rate F1,24 = 6.4, p = .019). Patients also had overall a higher rate of commission errors (main effect Group: F1,24 = 11.5, p = .002; Figure 2C). As in the stop-signal task, PFC patients had more variable reaction times compared to controls (F1,24 = 5.2, p = .032). Also, reaction times were found to be more variable in the 80 % compared to 50 % go-blocks (Difficulty: F1,24 = 10.9, p = .003), which did not differ between groups (F < 1). Finally, a regression analysis showed a positive linear relation between the reaction time variability and the commission error rate, in both 50 % go-blocks (R = .83, F1,24 = 54.5, p < .001) and 80 % go-blocks (R = .51, F1,24 = 8.2, p = .008) across patients and controls. The correlation remained for the 50 % go-block when considering the two groups separately (controls: R = .53, p = .053; patients: R = .82, p = .001). Additional comparisons of patients with right and left prefrontal lesions with non-parametric analyses (Mann-Whitney-U-test) only yielded a significant difference in number of correct go trials in the 80 % blocks (right: 92 % ± 7.9; left: 99.1 % ± 1.6), but no differences in commission error rates.
Change-signal-task
Patients and controls did not differ in their reaction times in go-trials (p > .3), but patients made more errors (F1,25 = 11.7, p = .002) and missed more trials (F1,25 = 11.1, p = .003). Patients did not show an altered inhibitory speed, as measured through the CSRT (F1,25 = 1.9, p = .175; Table 1 and Figure 2D). Comparisons of right and left lesion patients with Mann-Whitney-U-tests did not yield significant results for any of the change-signal task measures (right: 264 ms; left: 276 ms). As for the SSRT, we also examined individual participants’ CSRT in the four patients with rPFC damage. Again, only one patient (the same as for the SSRT) had a CSRT that was above controls’ CSRT (z-score 2.6, p < .01). The other three rPFC performed within the normal range of controls (z-score < 1.2, p > .2). Of the nine patients with lPFC damage, two performed below average of controls (z = 2.0, p < .05 and z = 6.8, p < .001).
3.2 EEG data
Go-trials
Go-stimuli elicited the typical P1/N1-complex, maximally over contralateral parieto-occipital sites (Figure 3). The P1 peaked around 90 ms and the N1 around 170 ms. To assess statistical differences in the N1 range, we subjected the mean amplitude from 160 – 190 ms over right and left parieto-occipital clusters to a repeated measures ANOVA with the within-subject factors Hemisphere (lesioned vs. non-lesioned), Laterality (contra- vs. ipsilesional stimulus side) and the between-subject factor Group. Note that for the controls the factor Hemisphere refers to the response hand only (lesioned = ipsilateral to response hand; non-lesioned = contralateral to response hand). PFC patients had a reduced N1 to contralesional stimuli (F1,21 = 7.1, p = .015), but not to ipsilesional stimuli (F < 1). However, the interaction of Group x Hemisphere x Laterality showed only marginal significance (F1,21 = 4.1, p = .056; main effect Group: F1,21 = 3.8, p = .06).
Figure 3. Event-related potentials in go-trials.
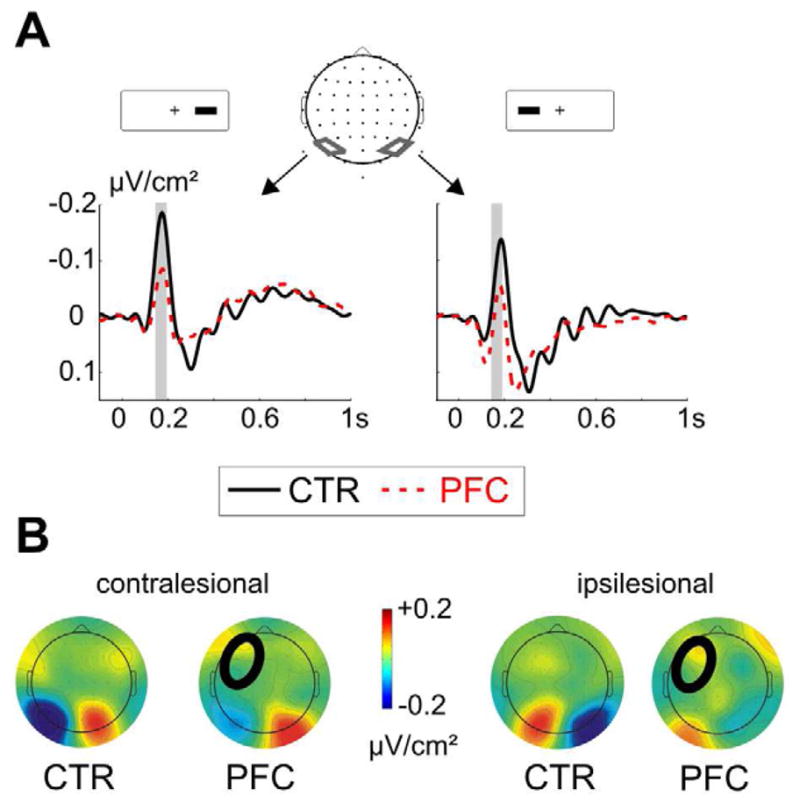
A PFC patients had a reduced N1 to contralesional go-stimuli over the lesioned hemisphere (left side), but no significant differences were detected after ipsilesional go-stimuli (right side). The analyzed time-window between 160 – 190 ms is indicated with a grey bar. B shows the topographic map of the average amplitude between 160 – 190 ms after the contralesional (left side) and ipsilesional stimuli (right side) for controls (CTR) and patients (PFC). In all figures, the circle in the patients’ map indicates the lesion site.
Stop-trials
Stop-signals elicited a clear negativity around 230 ms in both controls and patients, peaking around 220 ms over parieto-occipital electrodes and around 240 ms over frontal sites (Figure 4). Over parieto-occipital sites, the negativity was largest contralateral to the stop-stimulus. Importantly, PFC patients showed a reduction of the parietal negativity, but an increased negativity over intact frontal sites. We ran separate ANOVAs for the earlier (200 – 240 ms) parietal and the later (230 – 270 ms) frontal effect. As controls presented a more medio-frontal negativity, we ran the ANOVA for the frontal effect with the factor Hemisphere (three levels: left, central and right), Laterality and Group. The ANOVA for the parietal effect included the same factors as above for the go-trials. For the parietal effect, we observed a generally reduced negativity in PFC patients compared to controls (Group: F1,21 = 5.6, p = .028). When comparing the groups separately for the conditions and clusters, we observed significant differences only in the ipsilesional cluster after contralateral stimuli (p = .017; all others: p > .1), but the interaction of stimulus side and hemisphere was not significant. The analyses of activity at frontal electrodes revealed an interaction of Group x Hemisphere (F2,42 = 4.28, p = .02). Separate analyses for the lesioned, medio-frontal and intact sites showed an increased negativity in patients compared to controls over the intact hemisphere only (lesion side: p > .2; medio-frontal: p > .1; intact side: F1,21 = 4.5, p = .046). Although we did not detect a significant three-way interaction of Group x Hemisphere x Laterality, we did exploratory analyses to test for group differences in the response to ipsi- vs. contralesional stimuli, because of previous evidence of increased frontal activity in particular when challenging the lesioned hemisphere (Voytek et al., 2010). We observed significant group differences after contralesional stimuli (t21 = 2.6, p = .018), but not after ipsilesional stimuli (t21 = 1.5, p = .16; Figure 4).
Figure 4. Event-related potentials in stop-trials.

A Depicted are the ERPs after the contralesional stop-stimuli in successfully inhibited trials. Patients (PFC) had a reduced negativity in parieto-occipital sites over the lesioned hemisphere and enhanced activity in a frontolateral cluster over the intact hemisphere. B Average amplitude in the frontolateral cluster over the intact hemisphere after contra- (CL) and ipsilesional stop-stimuli in patients and controls. Patients and controls differed significantly in ERPs to the contralesional stimuli. C Correlation between frontolateral activity (z-normalized) after contralesional stop-stimuli and the performance variability (intraindividual coefficient of variance, ICV) in PFC patients.
Increased lateral frontal activity supports possible compensatory activity to account for reduced activity in posterior brain regions to ensure adequate task performance. As a clear peak was neither for the parietal N2 nor for the frontal N2 clearly detectable in every single patient, which precludes peak latency estimation, we refrained from statistical comparisons of the component’s latency for frontal and parietal sites.
As noted in the behavioral results, we observed an increased performance variability in patients, which reflects impaired top-down attentional control. We then asked whether the frontal activity in stop-trials, considered compensatory activity in the intact hemisphere, was related to the level of impaired attentional performance as measured by the ICV. In patients, the z-scored lateral frontal negativity was found to be positively correlated with the ICV, meaning that the larger the negativity the smaller the performance variability, but the correlation only approached significance (r = .56, p = .076; Figure 4). This trend correlation was not detected in the controls (r = .09, p > .5), but the group interaction was not significant (p > .1) as assessed with a moderator analysis (Cohen et al., 2003).
Fronto-parietal phase-coupling
Diminished parietal activity in frontal lesion patients is evidence for fronto-parietal interactions, proposed to underlie attentional control and goal-directed behavior. One possible mechanism of fronto-parietal interaction is phase-coupling, i.e. synchronization of neural activity (Fries, 2005). Phase-coupling should be more robust in the hemisphere contralateral to visual field stimulation and reduced in the PFC lesioned hemisphere. Moreover, compensatory activity in the intact hemisphere might result in increased phase-coupling. To test these hypotheses, we computed the phase-coupling (phase-locking value, PLV) between parietal and frontal clusters in both hemispheres of controls and over the lesioned and the intact hemisphere in the PFC patients. This was done for go-trials only, of which we had more trials providing a more robust test of phase-coupling. We examined several frequency bands and found significant phase-coupling effects only in the theta band (4–8 Hz). As can be seen in Figure 5A, an increase in fronto-parietal phase-coupling was evident shortly after the go-stimulus with a maximum coupling effect around 200 ms. We subjected the average PLV change between 100 – 350 ms (one 4 Hz cycle) to a repeated measures ANOVA. In controls, intra-hemispheric phase-coupling was stronger contralateral than ipsilateral to the stimulus side, as reflected in an interaction of Laterality (ipsi- vs. contralateral stimulus) and Hemisphere (F1,11 = 12.8, p = .004; Figure 5A). In patients, only an effect of Hemisphere was observed (F1,10 = 5.7, p = .043), reflecting phase-coupling over the intact but not over the lesioned hemisphere. Importantly, phase-coupling over the intact hemisphere was independent of the stimulus side in PFC patients (interaction Laterality x Hemisphere: p > .2; Figure 5B), providing further support for a role of the intact hemisphere in compensatory processes. However, the three-fold interaction of Group x Hemisphere x Laterality did not yield significance (F1,21 = 2.04, p = .17).
Figure 5. Fronto-parietal theta phase-coupling.

A For controls, the percentage change of the phase-locking value (PLV) relative to the pre-stimulus baseline in go-trials is shown, separately for ipsi- (solid line) and contralateral (dashed) stimuli. Note that ipsi- and contralateral refers to relative to the response hand (corresponding to the left side here). On the left, intra-hemispheric phase-locking changes in the left hemisphere are plotted, on the right the PLV for the right hemisphere. B Depicted is the percentage PLV change for PFC patients, shown separately for ipsi- (solid) and contralateral (dashed) stimuli and for intra-hemispheric coupling ipsi- and contralateral to the response, i.e. the patients’ lesioned and intact hemisphere.
Sensorimotor cortex activity
To assess possible group differences in response preparation and inhibition in sensorimotor cortex, we computed the average power decrease in the mu and beta band at C3 and C4 (ipsi- and contralateral to the response hand). We compared failed and successful inhibitions to examine possible group differences in sensorimotor activity during motor preparation and inhibition. Motor preparation was associated with a mu and beta power decrease strongest contralaterally to the response hand and maximal around response execution, i.e. around 600 ms (see Figure 6). We subjected the average power between 400 to 700 ms to a repeated-measures ANOVA with the factors Hemisphere (ipsi- vs. contralateral to response hand), Laterality (ipsi- vs. contralesional stimulus) and Inhibition (failed vs. successful), and the between-subject factor Group. For both the mu and beta response, we observed main effects of Inhibition (mu: F1,21 = 12.7, p = .002; beta: F1,21 = 6.5, p = .019) and Hemisphere (mu: F1,21 = 22.2, p < .001; beta: F1,21 = 18.0, p < .001), reflecting a stronger power decrease in error compared to inhibited trials and contra- compared to ipsilateral to the response hand. Patients showed a weaker beta power decrease ipsilateral to the response (i.e. over lesioned sites), but were not different from controls over sensorimotor areas contralateral to the response (Group x Hemisphere: F1, 21 = 8.7, p = .008). Patients also had a stronger mu decrease after ipsi- compared to contralesional stimuli (Laterality x Group: F1,21 = 5.0, p = .037), but this did not interact with inhibitory success.
Figure 6. Power changes in mu and beta band in stop-trials.

Percentage power change relative to the baseline before the go-stimulus (at time 0; average delay of stop-signal: around 350 ms) in patients (red) and controls (black) in inhibited trials (SI; solid line) and stop-errors (SE; dashed line). Shown is the time-course at C4 (contralateral to the response) for trials after ipsilesional stimuli. The grey bar indicates the analyzed time-window between 400 – 700 ms after the go-signal. A Results for the mu band (10 – 13 Hz) with a stronger decrease in errors compared to inhibited trials and contralateral to the response more than over ipsilateral sites. The maps on the right side show the average power change between 400 – 700 ms in error trials for controls and patients. B Results for the beta band (15 – 22 Hz) with a stronger decrease in errors compared to inhibitions and contralateral to the response more than ipsilateral (maps of error trials on the right for patients and controls).
4. Discussion
We aimed to specify the role of the PFC in response inhibition with a combined behavioral and electrophysiological approach in lesion patients. Patients with unilateral PFC lesions and age- and education-matched controls performed in a series of paradigms tapping into different aspects of response inhibition. PFC patients were comparable to controls in the speed of inhibiting a response but showed impaired maintenance of inhibitory control and more variable task performance. Moreover, patients were found to have reduced parietal activity after stop-stimuli, particularly evident over the PFC lesioned hemisphere in response to contralesional stimuli, and increased lateral frontal activity over the intact hemisphere. Phase-coupling analyses indicate that theta phase-coupling is also reduced in the PFC lesioned hemisphere. No group differences were observed in sensorimotor activity related to response preparation and inhibition. Taken together, this pattern of results points to altered visual processing of the stop-signal in parietal areas and compensatory activity over the intact lateral frontal cortex. The behavioral data stress the role of the PFC in maintaining inhibitory control but not in actual inhibition. This pattern of results across three tasks supports a dissociation between action cancellation and PFC-dependent action restraint.
4.1 Behavioral effects of PFC lesions
PFC patients did not show any impairment in their inhibitory speed as measured with the SSRT and the CSRT. There was a tendency for a hemifield effect on the SSRT with patients being slightly slower for contralesional compared to ipsilesional stop-stimuli. This suggests a deficit in the visual detection of the stop-signal rather than in the inhibition per se. Reduced detection rates of contralesional task-relevant stimuli in PFC patients have been reported previously (Barcelo et al., 2000) and are assumed to result from weaker facilitating top-down control from PFC on visual areas. The hemifield effect on go reaction-times in the present study corroborates this interpretation. The observation of unimpaired stop-signal task performance is in contrast to previous reports of an increased SSRT in lateral PFC patients, particularly patients with right IFG lesions (Aron et al., 2003), and an increased SSRT after transcranial magnetic stimulation (TMS) of the right IFG (Chambers et al., 2007; Chambers et al., 2006; Verbruggen et al., 2010). It should be noted that the right PFC sample was small in the present study (n = 5 for behavioral data), which limits conclusions. However, analyses of single participant’s data showed that only one of the rPFC patients and two lPFC patients were significantly impaired in their SSRT and CSRT. All of these patients had additional damage to premotor, motor and dlPFC areas. Importantly, we did not find a correlation or correlation trend between rIFG damage and SSRT as in other studies (Aron et al., 2003). We observed SSRTs and CSRTs comparable to controls in most rPFC patients (4 out of 5) and did not detect any differences between right- or left-lateralized lesion patients, neither on average nor among those with behavioral deficits. Our results are in accord with other findings of a normal SSRT in lateral PFC patients, but altered inhibitory speed related to medial PFC lesions (Dimitrov, 2003; Floden and Stuss, 2006; Picton et al., 2006). These discrepant findings might be caused by task differences. Chambers and colleagues found an increased SSRT after rIFG stimulation only in conditions of higher response competition in the go-task (Chambers et al., 2007). Alternatively, it has been suggested that the rIFG might impose a response bias rather than interrupting the motor preparation (Floden and Stuss, 2006). This notion is supported by rIFG activation during proactive inhibition in fMRI studies (Chikazoe et al., 2009).
Although both SSRT and CSRT were unimpaired in PFC patients, their level of commission errors and reaction time variability was altered compared to controls. Patients made more nogo-errors, especially under conditions of a strong bias for fast responses (80 % go-blocks), and performed more variably in the Go/Nogo- and Stop-signal tasks. Both a high error rate in Go/Nogo-tasks and more variable performance have been reported previously in PFC patients (Stuss et al., 2003; Swick et al., 2008). In healthy controls, previous studies found a clear relationship between nogo-performance and response variability (Bellgrove et al., 2004). This corroborates the notion that performance variability as correlated with inhibitory success in the Go/Nogo-task reflects an important aspect of top-down control. In the same study, Bellgrove and colleagues (2004) investigated which task-related neural activity was correlated with performance variability and identified frontal regions, comprising the dlPFC and premotor cortex . In the present study, inhibitory success in the Go/Nogo-task was also correlated with intra-individual variability of reaction times. Our results confirm a critical role of lateral PFC in maintaining top-down control in the context of reaction time tasks, as previously suggested (Bellgrove et al., 2004; Stuss et al., 2003). The current task settings of short inter-trial interval and long experiment duration might have additionally challenged the ability to maintain attention and contributed to the clear behavioral deficits observed in the PFC patients. In the present study, we tested for the first time both a Stop-signal task and a Go/Nogo-task in the same group of frontal patients. A dissociation between interrupting motor preparation and restraining one’s behavior has been proposed previously based on psychopharmacological research (Eagle et al., 2008). Our data confirm this dissociation and demonstrate a critical role of the PFC in action restraint, but not action cancellation.
4.2 Reduced parietal and increased lateral frontal activity in PFC patients
In stop-trials, we observed a negativity around 200 ms after stimulus onset, which was maximal over posterior electrodes contralateral to the stop-stimulus. This N2 is typically observed in visual Stop-signal tasks and can be measured over both frontocentral and parietal or parieto-occipital electrodes (Krämer et al., 2011; Pliszka et al., 2000; Ramautar et al., 2004; Ramautar et al., 2006b; Schmajuk et al., 2006). The posterior N2 has been linked to perceptual processing of the attended and task-relevant stop-signal and has a proposed source in extrastriate visual areas and/or inferior parietal cortex (Schmajuk et al., 2006). This converges with fMRI-studies showing enhanced inferior parietal activity in response to stop- and nogo-signals, especially if they are task-relevant (Boehler et al., 2010). The fact that the negativity was found to be lateralized over parietal areas with a maximum contralateral to the stimulus strengthens the argument that it reflects visual processing of the stop-signal, which is modulated by spatial attention. Critically, PFC lesion patients showed a reduction of the N2 over parietal electrodes and an enhanced N2 over intact lateral frontal regions. This pattern reveals a reduced visual processing of the task-relevant stop-stimulus and likely compensatory activity over the intact hemisphere. It is noteworthy that controls had a maximum negativity over medio-frontal sites, possibly emanating from ACC or pre-SMA. This suggests that PFC patients show not only increased frontal activity in the non-lesioned hemisphere but altered neural responses with a stronger involvement of intact lateral frontal areas. However, the group difference for medio-frontal areas did not reach significance.
PFC dependent, attentional modulation of visual processing has been shown by extensive electrophysiological and functional imaging research (Bressler et al., 2008; Buchel and Friston, 1997; Corbetta et al., 1993; Fuster et al., 2000; Hopfinger et al., 2000; Kastner et al., 1999). Moreover, altered perceptual processes after prefrontal lesions have been shown for the visual (Barcelo et al., 2000; Knight, 1997; Yago et al., 2004) and auditory (Chao and Knight, 1998) modalities. For instance, PFC patients were found to have diminished early sensory activity independent of attention (after 100 ms, P1) as well as a reduction in later stages of feature- and target-selection in a visual attention paradigm (Yago et al., 2004). This indicates both tonic and phasic enhancement of perceptual processes in extrastriate cortex by lateral prefrontal regions, subserving attentional control and goal-directed behavior. The present data are in line with reduced extrastriate activity in response to behaviorally relevant stimuli, as evidenced by the reduced parietal activity in go-trials and in stop-trials. As in previous studies (Barcelo et al., 2000; Knight, 1997), this effect was detectable especially over the lesioned hemisphere.
Phase-coupling analyses of go-trials indicated that coupling in the theta-range indexes fronto-parietal interactions. Theta phase-coupling has been reported previously in the context of cognitive control, possibly underlying fronto-occipital interactions in attention (Cohen, 2009) or cingulate-dlPFC interactions in post-error adaptation (Cavanagh et al., 2009). Here, theta phase-coupling between frontal and parietal cortex was found to depend on the stimulus side such that intra-hemispheric coupling was stronger for contra- compared to ipsilateral visual field stimulation in controls. Importantly, PFC patients showed reduced theta coupling in the lesioned hemisphere compared to the intact hemisphere. Moreover, theta-coupling in the intact hemisphere did not differ between contra- and ipsilateral stimuli, suggesting that for contralesional stimuli the intact frontal cortex is taking over when the injured hemisphere is challenged. It should be noted that the PLV is a non-directional measure and thus provides no conclusive evidence for frontal top-down control over parieto-occipital areas. The reduced N1 in go-trials and N2-stop-trials might also be caused by reduced tonic input from frontal areas rather than decreased phasic input. It should also be stressed that phase-coupling was assessed in go-trials, of which we had more trials and no rapid succession of two visual events as in stop-trials. Thus, it is not possible to directly link the PLV results with the frontal N2 effects we observed in stop-trials. We propose that the reduced PLV over the lesioned hemisphere and the altered PLV over the intact hemisphere are electrophysiological signatures of impaired fronto-parietal interactions in the patients and possible compensatory mechanisms in intact brain regions.
Critically, PFC patients did not show any changes in sensorimotor activity contralateral to the response hand, as measured by the mu and beta decrease after the go-stimulus. With respect to the question as to whether visual processing of the stop-stimulus or later response preparation or inhibition stages are altered after PFC damage, our results provide evidence for the former.
In addition to the reduced parietal activity in response to go- and stop-trials, PFC patients showed an increased negativity over the intact frontal hemisphere after a stop-signal. This effect correlated with the patients’ behavioral deficit, such that patients with more pronounced frontal compensatory activity had less variable performance, i.e. were less impaired. This suggests that some patients can compensate for reduced or missing input from the lesioned hemisphere and resulting behavioral decrement by increased activity in the intact PFC. Alternatively, variable performance might be related to more jittered frontal activity which would also result in a decreased average N2 amplitude. The frontal group difference was observed in stop-trials only, but not in go-trials, which might be due to the stop-trials being less frequent and more demanding. One might also argue that this effect reflects inhibitory activity (Pliszka et al., 2000; Schmajuk et al., 2006) and that the enhanced frontal activity allows PFC patients to perform as well as controls in the stop-signal task despite attention deficits. The lack of a relationship between compensatory activity and SSRT is not in accord with this explanation. A group difference in the frontal N2 was detected only when challenging the affected hemisphere in patients, i.e. for contralesional stop-stimuli. Compensatory activity in the intact frontal cortex after PFC damage, particularly when challenging the damaged hemisphere, has been reported previously in a working-memory task (Voytek et al., 2010). Specifically, PFC patients showed increased theta activity over intact frontal areas during the delay period in a matching-to-sample task. This was observed in correct trials and after contralesional stimuli only (Voytek et al., 2010). Here, we extend this finding to cognitive control in the context of response selection and inhibition.
4.3 Limitations and conclusions
There are limitations in the current study to discuss. Important for the present study is the fact that although our sample size was large for a PFC lesion study it was not sufficient to reliably compare EEG results of right and left PFC lesions. This is a potential weakness given previous findings of a right-lateralized network in stop-signal tasks (Chikazoe, 2010; Wager et al., 2005) and reports of an increased SSRT after right IFG lesions (Aron et al., 2003) or after transcranial magnetic stimulation of the right IFG (Chambers et al., 2007; Verbruggen et al., 2010). It should be noted that extensive analysis of the group and individual behavioral data in our patient cohort did not provide any suggestion of a lateralization of behavioral impairment despite clear right IFG damage in some patients. Moreover, other lesion studies could not replicate the relationship between rIFG damage and an altered SSRT (Picton et al., 2006). One might also argue that strong conclusions about null effects in unilateral PFC lesions may be tempered by the intact PFC taking over the function of the damaged hemisphere. Indeed our observation of increased activity over the intact frontal cortex might reflect such compensation precluding measurable behavioral deficits. It is important to note, however, that unilateral PFC lesions were found to only disrupt attention and maintenance of inhibitory control in the present study, whereas inhibitory speed was spared.
To conclude, three main points arise from the present study. First, we confirm previous suggestions of a dissociation between action cancellation and action restraint and provide evidence for the critical role of the PFC in action restraint. While psychopharmacological studies demonstrated a double dissociation in terms of neurotransmitters such that serotonin impacts action restraint and noradrenalin is involved in action cancellation (Eagle et al., 2008), we found a specific deficit of lateral PFC lesion patients in maintaining inhibitory control only, but not in inhibitory speed. Other regions such as medial PFC and basal ganglia might be more vital for interrupting motor preparation. Second, PFC patients showed a reduction of parietal activity in stop-trials and increased activity over the intact frontal cortex but had no changes in sensorimotor dynamics. This provides evidence for the impact of PFC on attentional control in the context of response inhibition that is physiologically reflected in reduced visual processing of the stop-signal and behaviorally in an increased error rate. Finally, ERP and coherence metrics provide neural evidence of compensatory activity in the intact hemisphere.
Acknowledgments
Funding
The study was supported by the German Research Foundation (KR 3691/1–1 to UMK), the National Institute of Neurological Disorders and Stroke (NS21135 to RTK), the SouthEastern Norway Regional Health Authority (SUN-001-SS and 2008047 to AKS) and the Research Council of Norway (186504/V50 to AKS).
We thank all volunteers for participating, D. Scabini and J. Black for patient delineation and C. Clayworth for lesion reconstruction.
Footnotes
Publisher's Disclaimer: This is a PDF file of an unedited manuscript that has been accepted for publication. As a service to our customers we are providing this early version of the manuscript. The manuscript will undergo copyediting, typesetting, and review of the resulting proof before it is published in its final citable form. Please note that during the production process errors may be discovered which could affect the content, and all legal disclaimers that apply to the journal pertain.
References
- Alegre M, Gurtubay IG, Labarga A, Iriarte J, Valencia M, Artieda J. Frontal and central oscillatory changes related to different aspects of the motor process: a study in go/no-go paradigms. Experimental Brain Research. 2004;159 (1):14–22. doi: 10.1007/s00221-004-1928-8. [DOI] [PubMed] [Google Scholar]
- Aron AR. From Reactive to Proactive and Selective Control: Developing a Richer Model for Stopping Inappropriate Responses. Biological Psychiatry. 2010;69 (12):e55–68. doi: 10.1016/j.biopsych.2010.07.024. [DOI] [PMC free article] [PubMed] [Google Scholar]
- Aron AR, Behrens TE, Smith S, Frank MJ, Poldrack RA. Triangulating a cognitive control network using diffusion-weighted magnetic resonance imaging (MRI) and functional MRI. Journal of Neuroscience. 2007;27 (14):3743–3752. doi: 10.1523/JNEUROSCI.0519-07.2007. [DOI] [PMC free article] [PubMed] [Google Scholar]
- Aron AR, Fletcher PC, Bullmore ET, Sahakian BJ, Robbins TW. Stop-signal inhibition disrupted by damage to right inferior frontal gyrus in humans. Nature Neuroscience. 2003;6 (2):115–116. doi: 10.1038/nn1003. [DOI] [PubMed] [Google Scholar]
- Aron AR, Robbins TW, Poldrack RA. Inhibition and the right inferior frontal cortex. Trends in cognitive sciences. 2004;8 (4):170–177. doi: 10.1016/j.tics.2004.02.010. [DOI] [PubMed] [Google Scholar]
- Band GP, van der Molen MW, Logan GD. Horse-race model simulations of the stop-signal procedure. Acta Psychologica. 2003;112 (2):105–142. doi: 10.1016/s0001-6918(02)00079-3. [DOI] [PubMed] [Google Scholar]
- Barcelo F, Suwazono S, Knight RT. Prefrontal modulation of visual processing in humans. Nature Neuroscience. 2000;3 (4):399–403. doi: 10.1038/73975. [DOI] [PubMed] [Google Scholar]
- Bellgrove MA, Hester R, Garavan H. The functional neuroanatomical correlates of response variability: evidence from a response inhibition task. Neuropsychologia. 2004;42 (14):1910–1916. doi: 10.1016/j.neuropsychologia.2004.05.007. [DOI] [PubMed] [Google Scholar]
- Boehler CN, Appelbaum LG, Krebs RM, Hopf JM, Woldorff MG. Pinning down response inhibition in the brain — Conjunction analyses of the Stop-signal task. Neuroimage. 2010;52 (4):1621–1632. doi: 10.1016/j.neuroimage.2010.04.276. [DOI] [PMC free article] [PubMed] [Google Scholar]
- Bressler SL, Tang W, Sylvester CM, Shulman GL, Corbetta M. Top-Down Control of Human Visual Cortex by Frontal and Parietal Cortex in Anticipatory Visual Spatial Attention. Journal of Neuroscience. 2008;28 (40):10056–10061. doi: 10.1523/JNEUROSCI.1776-08.2008. [DOI] [PMC free article] [PubMed] [Google Scholar]
- Buchel C, Friston KJ. Modulation of connectivity in visual pathways by attention: cortical interactions evaluated with structural equation modelling and fMRI. Cerebral Cortex. 1997;7 (8):768–778. doi: 10.1093/cercor/7.8.768. [DOI] [PubMed] [Google Scholar]
- Cavanagh JF, Cohen MX, Allen JJ. Prelude to and resolution of an error: EEG phase synchrony reveals cognitive control dynamics during action monitoring. Journal of Neuroscience. 2009;29 (1):98–105. doi: 10.1523/JNEUROSCI.4137-08.2009. [DOI] [PMC free article] [PubMed] [Google Scholar]
- Chambers CD, Bellgrove MA, Gould IC, English T, Garavan H, McNaught E, Kamke M, Mattingley JB. Dissociable mechanisms of cognitive control in prefrontal and premotor cortex. Journal of Neurophysiology. 2007;98 (6):3638–3647. doi: 10.1152/jn.00685.2007. [DOI] [PubMed] [Google Scholar]
- Chambers CD, Bellgrove MA, Stokes MG, Henderson TR, Garavan H, Robertson IH, Morris AP, Mattingley JB. Executive “brake failure” following deactivation of human frontal lobe. Journal of Cognitive Neuroscience. 2006;18 (3):444–455. doi: 10.1162/089892906775990606. [DOI] [PubMed] [Google Scholar]
- Chao HHA, Luo X, Chang JLK, Li C-sR. Activation of the pre-supplementary motor area but not inferior prefrontal cortex in association with short stop signal reaction time – an intra-subject analysis. BMC Neuroscience. 2009;10 (1):75. doi: 10.1186/1471-2202-10-75. [DOI] [PMC free article] [PubMed] [Google Scholar]
- Chao LL, Knight RT. Contribution of human prefrontal cortex to delay performance. Journal of Cognitive Neuroscience. 1998;10 (2):167–177. doi: 10.1162/089892998562636. [DOI] [PubMed] [Google Scholar]
- Chikazoe J. Localizing performance of go/no-go tasks to prefrontal cortical subregions. Current Opinion in Psychiatry. 2010;23 (3):267–272. doi: 10.1097/YCO.0b013e3283387a9f. [DOI] [PubMed] [Google Scholar]
- Chikazoe J, Jimura K, Hirose S, Yamashita K, Miyashita Y, Konishi S. Preparation to inhibit a response complements response inhibition during performance of a stop-signal task. Journal of Neuroscience. 2009;29 (50):15870–15877. doi: 10.1523/JNEUROSCI.3645-09.2009. [DOI] [PMC free article] [PubMed] [Google Scholar]
- Cohen J, Cohen P, West SG, Aiken LS. Applied multiple regression/correlation analysis for the behavioral sciences. 3. Lawrence Erlbaum; Mahwah, NJ: 2003. [Google Scholar]
- Cohen MX. Unconscious errors enhance prefrontal-occipital oscillatory synchrony. Frontiers in human neuroscience. 2009;3:54. doi: 10.3389/neuro.09.054.2009. [DOI] [PMC free article] [PubMed] [Google Scholar]
- Corbetta M, Miezin FM, Shulman GL, Petersen SE. A PET study of visuospatial attention. The Journal of Neuroscience. 1993;13 (3):1202–1226. doi: 10.1523/JNEUROSCI.13-03-01202.1993. [DOI] [PMC free article] [PubMed] [Google Scholar]
- Crawford JR, Garthwaite PH. Single-case research in neuropsychology: A comparison of five forms of t-test for comparing a case to controls. Cortex. 2011 doi: 10.1016/j.cortex.2011.06.021. [DOI] [PubMed] [Google Scholar]
- De Jong R, Coles MG, Logan GD. Strategies and mechanisms in nonselective and selective inhibitory motor control. Journal of Experimental Psychology: Human Perception and Performance. 1995;21 (3):498–511. doi: 10.1037//0096-1523.21.3.498. [DOI] [PubMed] [Google Scholar]
- Delorme A, Makeig S. EEGLAB: an open source toolbox for analysis of single-trial EEG dynamics including independent component analysis. Journal of Neuroscience Methods. 2004;134 (1):9–21. doi: 10.1016/j.jneumeth.2003.10.009. [DOI] [PubMed] [Google Scholar]
- Dimitrov M. Inhibitory attentional control in patients with frontal lobe damage. Brain and Cognition. 2003;52 (2):258–270. doi: 10.1016/s0278-2626(03)00080-0. [DOI] [PMC free article] [PubMed] [Google Scholar]
- Eagle DM, Bari A, Robbins TW. The neuropsychopharmacology of action inhibition: cross-species translation of the stop-signal and go/no-go tasks. Psychopharmacology. 2008;199 (3):439–456. doi: 10.1007/s00213-008-1127-6. [DOI] [PubMed] [Google Scholar]
- Eickhoff SB, Stephan KE, Mohlberg H, Grefkes C, Fink GR, Amunts K, Zilles K. A new SPM toolbox for combining probabilistic cytoarchitectonic maps and functional imaging data. Neuroimage. 2005;25 (4):1325–1335. doi: 10.1016/j.neuroimage.2004.12.034. [DOI] [PubMed] [Google Scholar]
- Floden D, Stuss DT. Inhibitory control is slowed in patients with right superior medial frontal damage. Journal of Cognitive Neuroscience. 2006;18 (11):1843–1849. doi: 10.1162/jocn.2006.18.11.1843. [DOI] [PubMed] [Google Scholar]
- Fries P. A mechanism for cognitive dynamics: neuronal communication through neuronal coherence. Trends in cognitive sciences. 2005;9 (10):474–480. doi: 10.1016/j.tics.2005.08.011. [DOI] [PubMed] [Google Scholar]
- Fuster JM, Bodner M, Kroger JK. Cross-modal and cross-temporal association in neurons of frontal cortex. Nature. 2000;405 (6784):347–351. doi: 10.1038/35012613. [DOI] [PubMed] [Google Scholar]
- Hopfinger JB, Buonocore MH, Mangun GR. The neural mechanisms of top-down attentional control. Nature Neuroscience. 2000;3 (3):284–291. doi: 10.1038/72999. [DOI] [PubMed] [Google Scholar]
- Huynh H, Feldt LS. Estimation of the box correction for degrees of freedom from sample data in randomized block and splitsplot designs. Journal of Educational Statistics. 1976;1:69–82. [Google Scholar]
- Kastner S, Pinsk MA, De Weerd P, Desimone R, Ungerleider LG. Increased activity in human visual cortex during directed attention in the absence of visual stimulation. Neuron. 1999;22 (4):751–761. doi: 10.1016/s0896-6273(00)80734-5. [DOI] [PubMed] [Google Scholar]
- Kayser J. Current source density (CSD) interpolation using spherical splines - CSD Toolbox (Version 1.1) 2009 [Google Scholar]
- Kayser J, Tenke CE. Principal components analysis of Laplacian waveforms as a generic method for identifying ERP generator patterns: II. Adequacy of low-density estimates. Clinical Neurophysiology. 2006;117 (2):369–380. doi: 10.1016/j.clinph.2005.08.033. [DOI] [PubMed] [Google Scholar]
- Knight RT. Distributed Cortical Network for Visual Attention. Journal of Cognitive Neuroscience. 1997;9 (1):75–91. doi: 10.1162/jocn.1997.9.1.75. [DOI] [PubMed] [Google Scholar]
- Krämer UM, Knight RT, Münte TF. Electrophysiological Evidence for Different Inhibitory Mechanisms When Stopping or Changing a Planned Response. Journal of Cognitive Neuroscience. 2011;23 (9):2481–2493. doi: 10.1162/jocn.2010.21573. [DOI] [PubMed] [Google Scholar]
- Krämer UM, Rojo N, Schüle R, Cunillera T, Schöls L, Marco-Pallares J, Cucurell D, Camara E, Rodriguez-Fornells A, Münte TF. ADHD candidate gene (DRD4 exon III) affects inhibitory control in a healthy sample. BMC Neuroscience. 2009;10:150. doi: 10.1186/1471-2202-10-150. [DOI] [PMC free article] [PubMed] [Google Scholar]
- Lachaux JP, Rodriguez E, Martinerie J, Varela FJ. Measuring phase synchrony in brain signals. Human Brain Mapping. 1999;8 (4):194–208. doi: 10.1002/(SICI)1097-0193(1999)8:4<194::AID-HBM4>3.0.CO;2-C. [DOI] [PMC free article] [PubMed] [Google Scholar]
- Leimkuhler ME, Mesulam MM. Reversible go-no go deficits in a case of frontal lobe tumor. Annals of Neurology. 1985;18 (5):617–619. doi: 10.1002/ana.410180518. [DOI] [PubMed] [Google Scholar]
- Li CS, Huang C, Constable RT, Sinha R. Imaging response inhibition in a stop-signal task: neural correlates independent of signal monitoring and post-response processing. Journal of Neuroscience. 2006;26 (1):186–192. doi: 10.1523/JNEUROSCI.3741-05.2006. [DOI] [PMC free article] [PubMed] [Google Scholar]
- Liotti M, Pliszka SR, Perez R, Kothmann D, Woldorff MG. Abnormal brain activity related to performance monitoring and error detection in children with ADHD. Cortex. 2005;41 (3):377–388. doi: 10.1016/s0010-9452(08)70274-0. [DOI] [PubMed] [Google Scholar]
- Logan GD, Cowan WB, Davis KA. On the ability to inhibit simple and choice reaction time responses: a model and a method. Journal of Experimental Psychology: Human Perception and Performance. 1984;10 (2):276–291. doi: 10.1037//0096-1523.10.2.276. [DOI] [PubMed] [Google Scholar]
- Marco-Pallares J, Camara E, Münte TF, Rodriguez-Fornells A. Neural Mechanisms Underlying Adaptive Actions after Slips. Journal of Cognitive Neuroscience. 2008;20 (9):1595–1610. doi: 10.1162/jocn.2008.20117. [DOI] [PubMed] [Google Scholar]
- Mostofsky SH, Simmonds DJ. Response inhibition and response selection: two sides of the same coin. Journal of Cognitive Neuroscience. 2008;20 (5):751–761. doi: 10.1162/jocn.2008.20500. [DOI] [PubMed] [Google Scholar]
- Pfurtscheller G, Lopes da Silva FH. Event-related EEG/MEG synchronization and desynchronization: basic principles. Clinical Neurophysiology. 1999;110 (11):1842–1857. doi: 10.1016/s1388-2457(99)00141-8. [DOI] [PubMed] [Google Scholar]
- Picton TW, Stuss DT, Alexander MP, Shallice T, Binns MA, Gillingham S. Effects of Focal Frontal Lesions on Response Inhibition. Cerebral Cortex. 2006;17 (4):826–838. doi: 10.1093/cercor/bhk031. [DOI] [PubMed] [Google Scholar]
- Pliszka SR, Liotti M, Woldorff MG. Inhibitory control in children with attention-deficit/hyperactivity disorder: event-related potentials identify the processing component and timing of an impaired right-frontal response-inhibition mechanism. Biological Psychiatry. 2000;48 (3):238–246. doi: 10.1016/s0006-3223(00)00890-8. [DOI] [PubMed] [Google Scholar]
- Ramautar J. Effects of stop-signal probability in the stop-signal paradigm: The N2/P3 complex further validated. Brain and Cognition. 2004 doi: 10.1016/j.bandc.2004.07.002. [DOI] [PubMed] [Google Scholar]
- Ramautar J, Slagter H, Kok A, Ridderinkhof K. Probability effects in the stop-signal paradigm: The insula and the significance of failed inhibition. Brain Research. 2006a;1105 (1):143–154. doi: 10.1016/j.brainres.2006.02.091. [DOI] [PubMed] [Google Scholar]
- Ramautar JR, Kok A, Ridderinkhof KR. Effects of stop-signal probability in the stop-signal paradigm: The N2/P3 complex further validated. Brain and Cognition. 2004;56:234–252. doi: 10.1016/j.bandc.2004.07.002. [DOI] [PubMed] [Google Scholar]
- Ramautar JR, Kok A, Ridderinkhof KR. Effects of stop-signal modality on the N2/P3 complex elicited in the stop-signal paradigm. Biological Psychology. 2006b;72 (1):96–109. doi: 10.1016/j.biopsycho.2005.08.001. [DOI] [PubMed] [Google Scholar]
- Rubia K, Russell T, Overmeyer S, Brammer MJ, Bullmore ET, Sharma T, Simmons A, Williams SCR, Giampietro V, Andrew CM, Taylor E. Mapping Motor Inhibition: Conjunctive Brain Activations across Different Versions of Go/No-Go and Stop Tasks. Neuroimage. 2001;13 (2):250–261. doi: 10.1006/nimg.2000.0685. [DOI] [PubMed] [Google Scholar]
- Schachar R, Logan GD, Robaey P, Chen S, Ickowicz A, Barr C. Restraint and Cancellation: Multiple Inhibition Deficits in Attention Deficit Hyperactivity Disorder. Journal of Abnormal Child Psychology. 2007;35 (2):229–238. doi: 10.1007/s10802-006-9075-2. [DOI] [PubMed] [Google Scholar]
- Schmajuk M, Liotti M, Busse L, Woldorff MG. Electrophysiological activity underlying inhibitory control processes in normal adults. Neuropsychologia. 2006;44 (3):384–395. doi: 10.1016/j.neuropsychologia.2005.06.005. [DOI] [PubMed] [Google Scholar]
- Simmonds DJ, Pekar JJ, Mostofsky SH. Meta-analysis of Go/No-go tasks demonstrating that fMRI activation associated with response inhibition is task-dependent. Neuropsychologia. 2008;46 (1):224–232. doi: 10.1016/j.neuropsychologia.2007.07.015. [DOI] [PMC free article] [PubMed] [Google Scholar]
- Singer W, Gray CM. Visual feature integration and the temporal correlation hypothesis. Annual Review of Neuroscience. 1995;18:555–586. doi: 10.1146/annurev.ne.18.030195.003011. [DOI] [PubMed] [Google Scholar]
- Stuss DT, Murphy KJ, Binns MA, Alexander MP. Staying on the job: the frontal lobes control individual performance variability. Brain. 2003;126 (Pt 11):2363–2380. doi: 10.1093/brain/awg237. [DOI] [PubMed] [Google Scholar]
- Swick D, Ashley V, Turken AU. Left inferior frontal gyrus is critical for response inhibition. BMC Neuroscience. 2008;9 (1):102. doi: 10.1186/1471-2202-9-102. [DOI] [PMC free article] [PubMed] [Google Scholar]
- Tallon-Baudry C, Bertrand O, Delpuech C, Permier J. Oscillatory gamma-band (30–70 Hz) activity induced by a visual search task in humans. Journal of Neuroscience. 1997;17 (2):722–734. doi: 10.1523/JNEUROSCI.17-02-00722.1997. [DOI] [PMC free article] [PubMed] [Google Scholar]
- Verbruggen F, Aron AR, Stevens MA, Chambers CD. Theta burst stimulation dissociates attention and action updating in human inferior frontal cortex. Proceedings of the National Academy of Sciences of the United States of America. 2010;107 (31):13966–13971. doi: 10.1073/pnas.1001957107. [DOI] [PMC free article] [PubMed] [Google Scholar]
- Verbruggen F, Logan GD. Proactive adjustments of response strategies in the stop-signal paradigm. Journal of Experimental Psychology: Human Perception and Performance. 2009;35 (3):835–854. doi: 10.1037/a0012726. [DOI] [PMC free article] [PubMed] [Google Scholar]
- Voytek B, Davis M, Yago E, Barceló F, Vogel EK, Knight RT. Dynamic Neuroplasticity after Human Prefrontal Cortex Damage. Neuron. 2010;68 (3):401–408. doi: 10.1016/j.neuron.2010.09.018. [DOI] [PMC free article] [PubMed] [Google Scholar]
- Wager TD, Sylvester C-YC, Lacey SC, Nee DE, Franklin M, Jonides J. Common and unique components of response inhibition revealed by fMRI. Neuroimage. 2005;27 (2):323–340. doi: 10.1016/j.neuroimage.2005.01.054. [DOI] [PubMed] [Google Scholar]
- Woldorff MG. Distortion of ERP averages due to overlap from temporally adjacent ERPs: analysis and correction. Psychophysiology. 1993;30 (1):98–119. doi: 10.1111/j.1469-8986.1993.tb03209.x. [DOI] [PubMed] [Google Scholar]
- Yago E, Duarte A, Wong T, Barcelo F, Knight RT. Temporal kinetics of prefrontal modulation of the extrastriate cortex during visual attention. Cognitive, affective & behavioral neuroscience. 2004;4 (4):609–617. doi: 10.3758/cabn.4.4.609. [DOI] [PubMed] [Google Scholar]