

Abstract
Study Objectives:
GABAergic and cholinergic transmission within the basal forebrain and cerebral cortex contribute to the regulation of sleep and wakefulness. In contrast to levels of acetylcholine (ACh), levels of endogenous GABA in basal forebrain and cortex during sleep and wakefulness have not previously been quantified. This study (1) tested the hypothesis that there are differential, state-specific changes in GABA levels within the substantia innominata (SI) region of the basal forebrain and somatosensory cortex; and (2) quantified the ratio of GABAergic to cholinergic transmission in the SI, cortex, and pontine reticular formation during rapid eye movement sleep (REM), non-REM sleep (NREM), and wakefulness.
Design:
Within/between subjects.
Setting:
University of Michigan.
Patients or Participants:
Adult, male, purpose bred cats (n = 5).
Interventions:
In vivo microdialysis, high performance liquid chromatography, electrophysiological recordings.
Measurements and Results:
In the SI, GABA levels were significantly greater during NREM (17%) than during REM. In the cortex, GABA levels were significantly greater during NREM than during wakefulness (39%) and REM (63%). During prolonged wakefulness, there was a linear increase in cortical GABA levels, and the amount of time spent awake accounted for 87% of the variance in GABA. The GABA-to-ACh ratio was largest during NREM for all brain regions. REM was characterized by a 68% decrease in the GABA-to-ACh ratio across brain regions, always due to a decrease in GABA levels.
Conclusion:
Three of the brain regions that comprise the anatomically distributed, sleep-generating network have in common a GABA-mediated, sleep-dependent decrease in the GABA-to-ACh ratio.
Citation:
Vanini G; Lydic R; Baghdoyan HA. GABA-to-ACh ratio in basal forebrain and cerebral cortex varies significantly during sleep. SLEEP 2012;35(10):1325-1334.
Keywords: Substantia innominata, sedatives, hypnotics, microdialysis
INTRODUCTION
Gamma-amino butyric acid (GABA) and acetylcholine (ACh) significantly modulate states of behavioral arousal.1 The present study focused on the relationship between these two neurotransmitters in basal forebrain and cortex during wakefulness, rapid eye movement (REM) sleep and non-REM (NREM) sleep. Positive allosteric modulators of GABAA receptors provide standard-of-care treatment for inability to initiate or maintain sleep. GABAA receptor agonists are also used extensively in operating rooms and medical procedures units to eliminate wakefulness.2 Early studies identified neurons in the basal forebrain that discharge maximally during NREM sleep,3 and some of these NREM sleep-active neurons are now known to be GABAergic.4 GABAergic neurons in the basal forebrain project to the cortex to innervate cortical pyramidal neurons5 and GABAergic interneurons.6 In the cerebral cortex, Fos expression in a subset of sleep-active GABAergic interneurons increases in direct proportion to increases in the intensity of electroencephalogram (EEG) slow wave activity.7
ACh in the basal forebrain also contributes to the regulation of sleep and wakefulness. Cholinergic neurons in the basal forebrain project to the cerebral cortex8 and provide the major source of cortical ACh. Pioneering studies showed that ACh excites cortical neurons9 and that ACh levels in the cortex are greater during wakefulness than during NREM sleep.10 Basal forebrain cholinergic neurons fire fastest during wakefulness and REM sleep.4 Within the basal forebrain, the release of ACh is lowest during NREM sleep and greatest during REM sleep.11,12
The relationship between GABAergic and cholinergic neurotransmission within the basal forebrain13 and cortex remains poorly understood. Only recently has it been shown that in the pontine reticular formation increased cholinergic transmission combined with decreased GABAergic transmission promotes REM sleep.14 If the ratio of GABAergic-to-cholinergic transmission offers a useful metric for understanding the neurochemical control of sleep, then this ratio would be predicted to vary in additional sleep-related brain regions. No previous data have quantified endogenous GABA levels in basal forebrain and cortex during sleep and wakefulness. Therefore, the first goal of this study was to test the hypothesis that there are differential, state-specific changes in levels of endogenous GABA within the substantia innominata (SI) region of the basal forebrain and the cortex. These measures of GABA, and previous data quantifying GABA14 and ACh11,15,16 during sleep and wakefulness, made it possible to determine whether there are differential, state-specific changes in the ratio of GABA-to-ACh within the SI and cortex. The data reveal a progressive, brain-region-specific decrease in the GABA-to-ACh ratio with the transition from NREM sleep to REM sleep.
MATERIALS AND METHODS
The procedures reported below were used to quantify GABA levels in the basal forebrain and cortex of cat during objectively identified states of wakefulness, NREM sleep, and REM sleep. The results of these studies are presented in Figures 1–5. Figure 6 and Table 1 compare data from the present study with data from previously published work. GABA levels in the pontine reticular formation during sleep and wakefulness were quantified by Vanini et al.,14 using the same methods that were used to obtain the present Figure 1–5 data. Experiments to measure ACh release in the pontine reticular formation16 and basal forebrain11 during sleep and wakefulness were performed in our laboratories using the same procedures as those described below, without a period of prolonged wakefulness. Measures of cortical ACh release were taken from Figure 1 of Marrosu et al.,15 and those methods were similar to the methods used in our laboratories for measuring ACh release during sleep and wakefulness.
Figure 1.
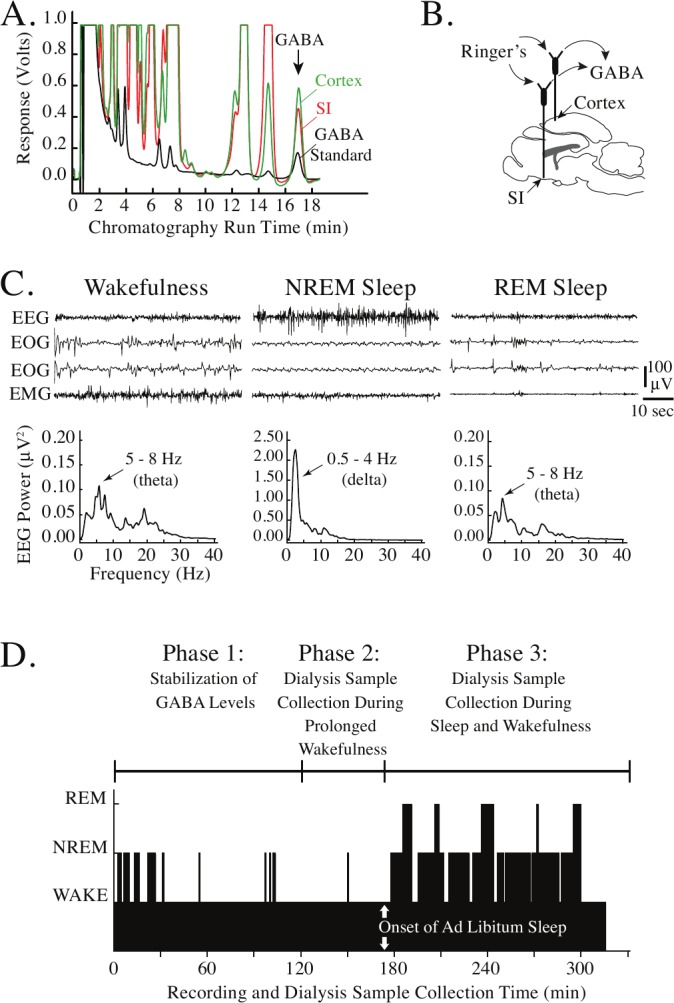
GABA chromatography, electrographic recordings, and experiment design. A. Representative chromatograms demonstrate the excellent signal-to-noise ratio for detection of GABA. The peak corresponding to GABA is marked by the arrow. Chromatograms were generated by a known concentration of GABA (0.457 pmol/10 μL; black trace), a brain sample obtained from the substantia innominata (SI) region of the basal forebrain (red trace), and a brain sample acquired from the cerebral cortex (green trace). Dialysis samples from the SI and cortex were collected from the same cat during wakefulness. Traces have been superimposed to demonstrate that peaks corresponding to GABA in the samples obtained from brain (red and green traces) are identified by their similar elution time to the GABA standard (black trace). B. A schematic sagittal view of cat brain indicates that microdialysis probes placed into the SI and cerebral cortex were used to collect dialysis samples containing GABA. C. Representative recordings of the cortical electroencephalogram (EEG), electrooculogram (EOG) and electromyogram (EMG) were used to objectively assess states of wakefulness, rapid eye movement (REM) sleep, and non-REM (NREM) sleep during the collection of dialysis samples. Power spectra were calculated from the corresponding EEG traces. Arrows mark the peaks corresponding to prominent theta power during wakefulness and REM sleep, and delta power during NREM sleep. D. Design of experiments and timeline for data collection. The height of the black bars in the time course plot at bottom indicates the occurrence and duration of wakefulness (lowest bars), NREM sleep (intermediate bars), and REM sleep (highest bars). Dialysis probes were inserted into the brain at time zero. Cats were kept awake for most of Phases 1 and 2. During Phase 3 cats were allowed to sleep ad libitum. Dialysis samples were collected continuously during Phase 2 and Phase 3.
Figure 2.
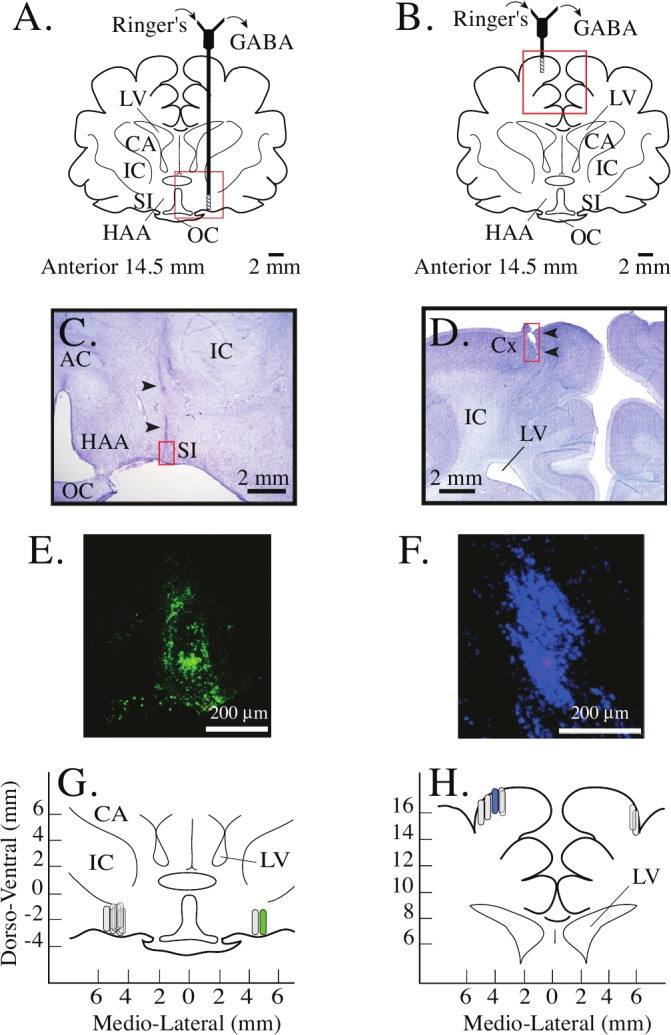
Histological localization of dialysis sites. A and B. Coronal schematics of the cat forebrain are used to indicate a dialysis probe in the left substantia innominata (SI) (A) and right cortex (B). The hatched portion at the tip of each probe is drawn to scale and represents the dialysis membrane. The red boxes indicate the areas enlarged in the photomicrographs below. C andD. Photomicrographs show one dialysis site in the SI (C) and one in the parietal cortex (D). C. Arrowheads mark the track made by the dialysis probe as it was lowered into the SI. D. Arrowheads mark the location of the dialysis membrane in the cortex. E and F. Photomicrographs of green (E) and blue (F) fluorescent microspheres used to label the dialysis sites shown in C andD, respectively. The photographs were obtained from adjacent, non-stained sections. G and H. Drawings of cat basal forebrain (G) and cerebral cortex (H) are used to illustrate the locations of all dialysis sites in all 5 cats. Stereotaxic coordinates are according to Berman and Jones (1982), and 0 mm on the abscissa marks the midline. Capsule-shaped symbols represent dialysis membranes and are drawn to scale. The symbols filled with green (G) or blue (H) mark the location of the dialysis sites shown in C and D, respectively. Anatomical abbreviations: AC, anterior commissure; CA, caudate nucleus; Cx, cortex; HAA, anterior hypothalamic area; IC, internal capsule; LV, lateral ventricle; OC, optic chiasm; SI, substantia innominata.
Figure 3.
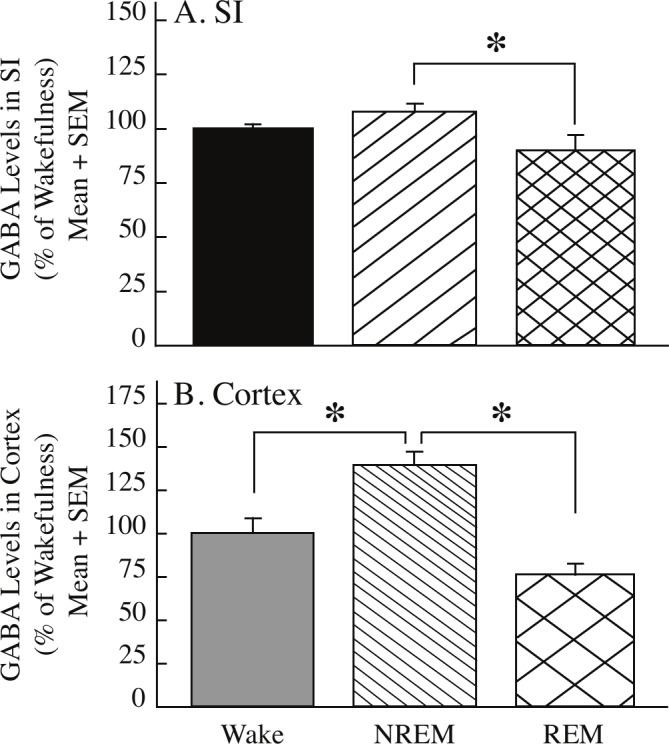
GABA levels in the substantia innominata (SI) and cerebral cortex varied in a state-specific manner. Measures of GABA were obtained during Phase 3 (see Figure 1D). Asterisks mark significant differences in GABA levels between behavioral states, as indicated by brackets. A. Relative to non-rapid eye movement (NREM) sleep, GABA levels in the SI were significantly lower during rapid eye movement (REM) sleep. Dialysis samples (n) collected from the SI during wakefulness (n = 31), NREM sleep (n = 78), and REM sleep (n = 26) are from 9 experiments in 4 cats. B. GABA levels in the cerebral cortex were significantly greater during NREM sleep than during wakefulness and during REM sleep. Cortical dialysis samples (n) during wakefulness (n = 18), NREM sleep (n = 60), and REM sleep (n = 20) were obtained from 6 experiments in 3 cats.
Figure 4.
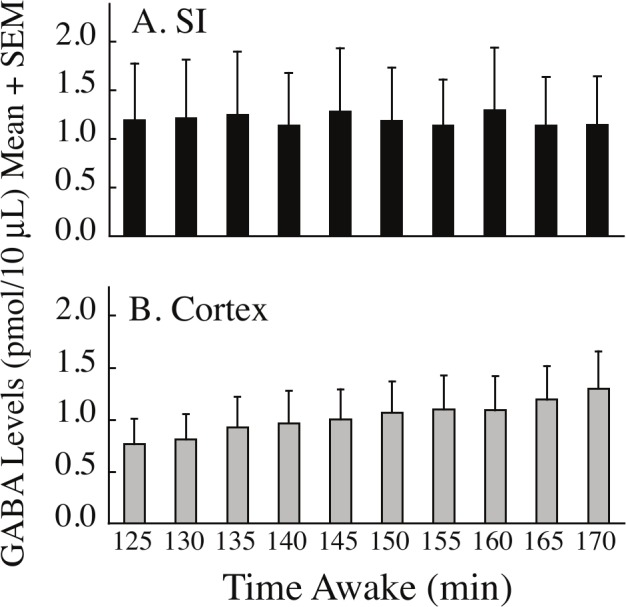
GABA levels in sequential dialysis samples collected during extended wakefulness. A. GABA levels in the substantia innominata (SI) were stable across time. Data represent measures from 4 cats during 8 experiments. B. GABA levels in the cerebral cortex increased progressively with increasing time spent awake. Data were obtained from 6 experiments in 3 cats.
Figure 5.

Temporal organization of sleep and wakefulness in 2 representative cats, and the corresponding time-course of sequential, sample-by-sample measures of cortical GABA levels in those 2 cats. A and C. Dialysis probes were inserted into the brain at time zero. Cats were kept awake during min 0 to 170, and were allowed to sleep and wake spontaneously during min 170 to > 300. B and D. In each experiment, cortical GABA levels increased during prolonged wakefulness (min 120 to 170), and decreased progressively over time after approximately 1 h of recovery sleep (min 170 to > 300).
Figure 6.
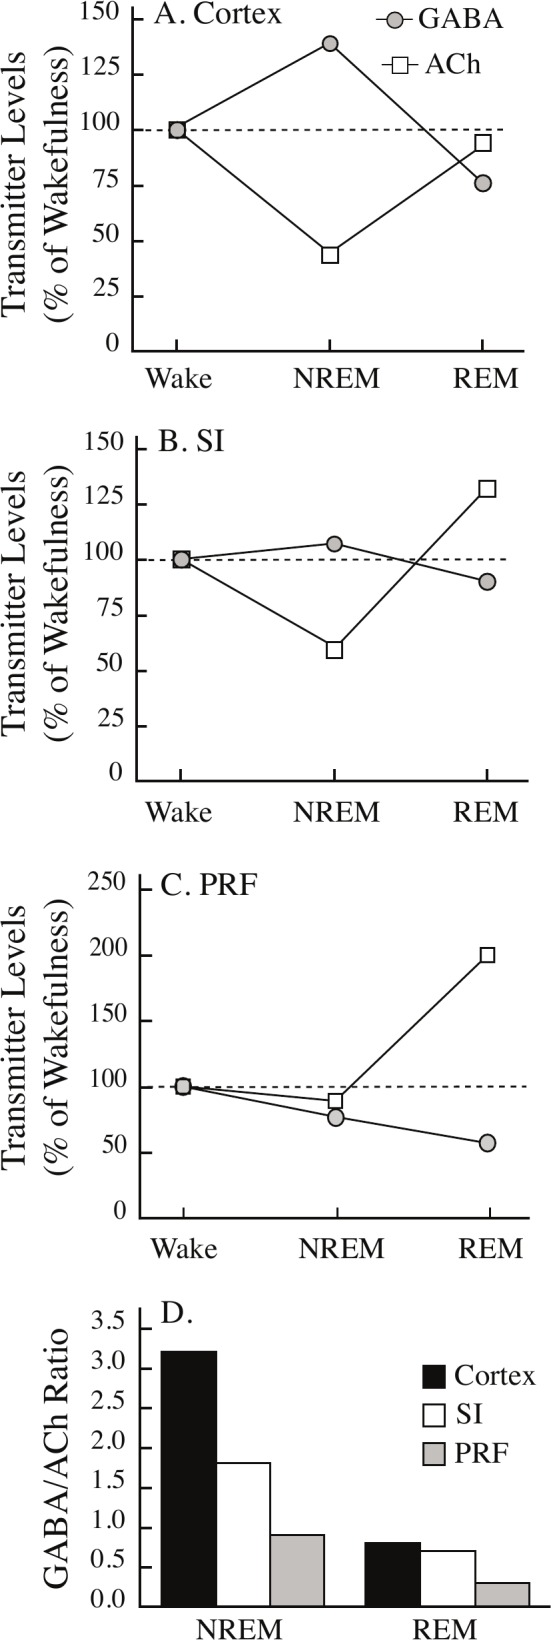
The ratio of GABA-to-ACh differs across brain regions and sleep states. Extracellular levels of GABA and acetylcholine (ACh) in theA, cerebral cortex, B, substantia innominata (SI) region of the basal forebrain, and C, pontine reticular formation (PRF) show differential changes during rapid eye movement sleep (REM) and non-REM sleep (NREM) relative to wakefulness (Wake). D. The ratio of GABA-to-ACh is plotted by sleep state and brain region. The GABA-to-ACh ratio was set to 1.0 during wakefulness. The Table 1 legend provides citations for all measures of GABA and ACh.
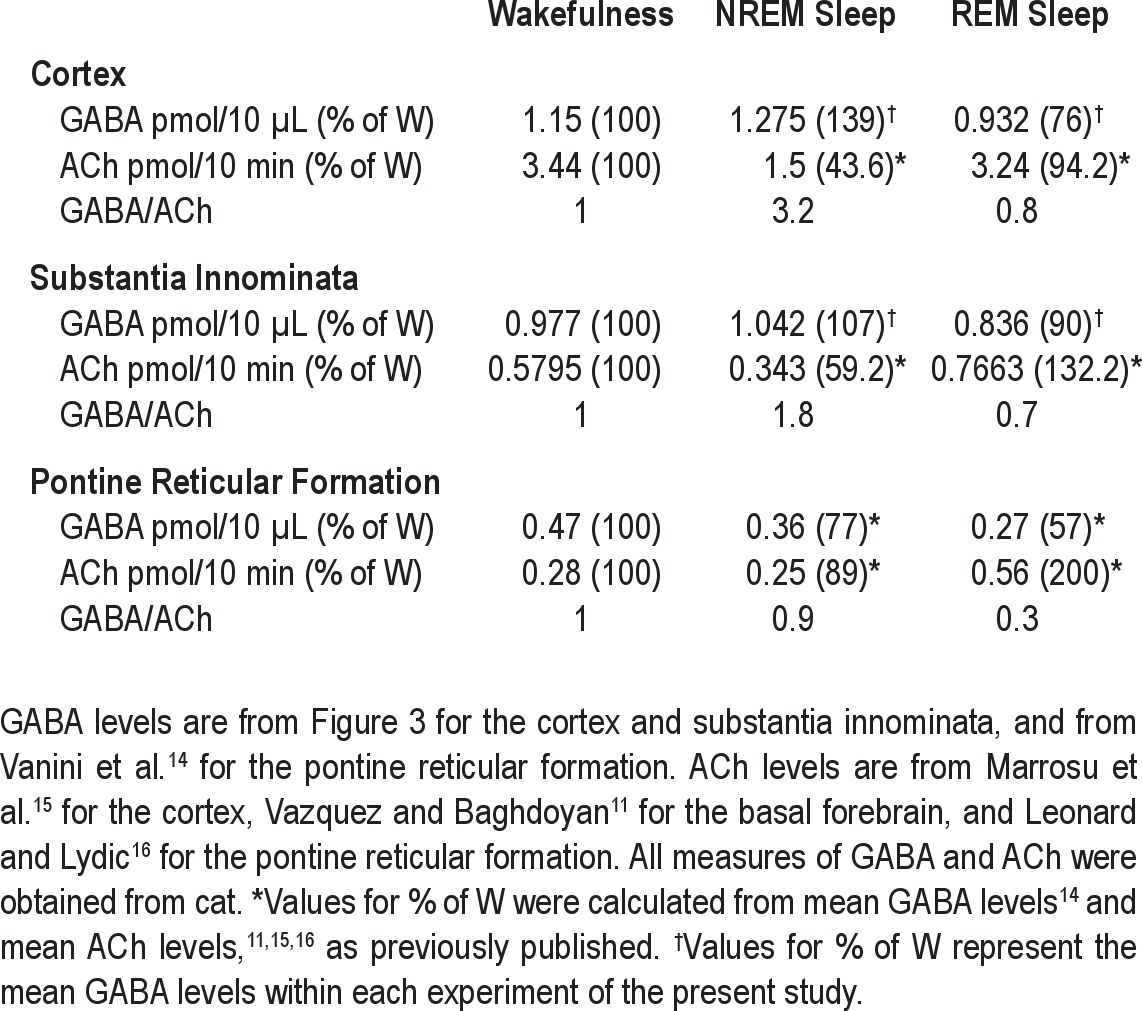
Table 1.
Values for GABA and ACh levels during sleep and wakefulness in three sleep-related brain regions
Chemicals, Animals, and Surgery
The source of o-phosphoric acid, sodium phosphate dibasic, sucrose, formalin, Permount, and chemicals for Ringer's solution was Thermo Fisher Scientific (Waltham, MA). The vendor for GABA, high performance liquid chromatography (HPLC)-grade methanol, acetonitrile, sodium tetraborate decahydrate, β-mercaptoethanol, and Gel Mount was Sigma-Aldrich (St. Louis, MO). The supplier foro-phthaldialdehyde was Mallinckrodt (St. Louis, MO).
Adult male purpose-bred cats (n = 5) were purchased from Harlan Laboratories (Indianapolis, IN) and Charles River Laboratories (Wilmington, MA). The University of Michigan Committee on Use and Care of Animals approved all in vivo procedures, and experiments were conducted in accordance with the Guide for the Care and Use of Laboratory Animals (National Academies Press, Washington DC, 2011). Previous reports have explained the rationale for using cats to quantify changes in transmitter levels during sleep and wakefulness.13,14,17 The key point is that the ability to obtain neurochemical measures that can be linked to identified behavioral states requires long-lasting episodes of sleep and wakefulness not exhibited by rodents. The long-duration episodes of sleep and wakefulness in cat18 are compatible with the temporal limitations of microdialysis and HPLC.19
Cats were prepared for microdialysis studies in a sterile operating suite as has been described.13,14,17 Animals were anesthetized with isoflurane (Abbott Laboratories, North Chicago, IL), placed in a stereotaxic frame (David Kopf Instruments, Tujunga, CA), and implanted with standard recording electrodes for identification of sleep-wake states.18 A craniotomy was created to provide access to the basal forebrain so that microdialysis probes could be inserted during subsequent experiments. The recording electrodes and 2 parallel stainless steel sleeves fitted to a Kopf 880 device were cemented to the skull with dental acrylic. These sleeves conferred the ability to place the head of a conscious animal in stereotaxic position. Thus, the animals could be left undisturbed during microdialysis experiments. After recovery from surgery, cats were conditioned to sleep in the laboratory.
HPLC with Electrochemical Detection
The HPLC system (ESA, Chelmsford, MA) and the method used to quantify GABA have been described in detail.14,17,20,21 GABA is not electroactive and must be derivatized in order to be quantified. Derivatization was accomplished in an autosampler, where each sample was mixed with o-phthaldialdehyde, β-mercaptoethanol, borate buffer, and methanol. Chromatograms (Figure 1A) were analyzed using EZChrom Elite chromatography data system (Scientific Software, Inc., Pleasanton, CA). The detection limit for GABA was 0.011 pmol/10 μL. Standard curves generated before and after each experiment were used to calculate the amount of GABA in each dialysis sample, and to ensure that the sensitivity of the detection system did not decrease during the analysis.
In Vivo Microdialysis during Electrographically Identified States of Wakefulness, NREM Sleep, and REM Sleep
Dialysis probes (CMA/10 or 12; CMA/Microdialysis, Holliston, MA) were custom-made with a shaft length of 70 mm and a membrane of either polycarbonate or polyarylethersulphone. Characteristics of the dialysis membrane included a cutoff of 20 kDa, a length of 2 mm, and a diameter of 0.5 mm. Ringer's solution (147.0 mM NaCl, 2.4 mM CaCl2, 4.0 mM KCl, 1.0 mM MgSO4, pH 6.0) was perfused continuously (3.0 μL/min) through the probes using a CMA/400 syringe pump. Before beginning an experiment, each dialysis probe was placed in a beaker containing a known concentration of GABA, and 5 samples (15 μL each) were collected to quantify the percent of GABA recovered by the dialysis membrane. At the end of each experiment, the dialysis probes were removed from the brain and in vitro recovery of GABA was measured in 5 additional dialysis samples. Pre- and post-experiment probe recoveries were compared by t-test for each experiment. If probe recoveries were significantly changed, then in vivo GABA measures from that experiment were excluded from the group data. This stringent exclusion criterion ensured that state-specific differences observed in brain GABA levels were not an artifact of intra-experimental changes in the dynamics of the dialysis membrane. Mean ± SEM recovery of GABA by all dialysis membranes used for this study was 7.8% ± 0.8%.
Experiments began by placing a cat in the Kopf 880 device and aiming a stainless steel guide tube for the SI. For a subset of experiments, a second guide tube was aimed for the ipsilateral cortex for simultaneous collection of dialysis samples from the SI and cortex (Figure 1B). Microdialysis probes were then inserted into the brain through the guide tubes, and sample collection began between 10:30 and 12:00. Obtaining an adequate number of samples required 4 to 6 h of dialysis time per experiment. Aim sites for dialysis probes in the SI ranged from 14.5 to 16.0 mm anterior to zero, 3.0 to 5.5 mm lateral to the midline, and 2.0 mm below zero.22 Coordinates for dialysis aim sites in the cerebral cortex ranged from 12.5 to 18.0 mm anterior to zero and 3.5 to 7.0 mm lateral to the midline. The same dialysis site in the same cat was never revisited, and aim sites for the dialysis probes were separated from each other by a minimum of 1 mm in the anterior-posterior and medial-lateral planes. The number of dialysis sites per cat ranged from one to six.
Dialysis samples were collected during objectively identified states of wakefulness, NREM sleep, and REM sleep by recording the cortical EEG, bilateral electrooculogram (EOG), and dorsal neck electromyogram (EMG) (Figure 1C) throughout the entire dialysis sampling period. Fast Fourier transform analysis of the EEG data, behavioral observations, and evaluation of raw EEG, EOG, and EMG signals permitted real-time identification of sleep states. These steps were essential for matching subsequently measured GABA levels with the behavioral state of the animal. Electrophysiological parameters were recorded, digitized, and analyzed as previously described.14,17
The design of the experiments is summarized by Figure 1D. The graph illustrates the temporal organization of sleep and wakefulness. During Phases 1 and 2 (Figure 1D, min 0-180) cats were kept awake most of the time by auditory stimulation, presentation of novel objects, and gentle tactile stimulation. The first 120-min period (Figure 1D, Phase 1) was used as a time for stabilization of GABA levels after dialysis probe insertion (time zero) into the SI and cortex. GABA levels in the pontine reticular formation of cat have been shown to stabilize within this 120-min period.14,17 Samples collected in Phase 2 were used to determine the effect of extended wakefulness on GABA levels in the SI and cortex. In Phase 3 (Figure 1D) cats were allowed to sleep ad libitum and additional dialysis samples were collected during states of wakefulness, NREM sleep, and REM sleep. The Phase 3 dialysis samples were used to quantitatively compare GABA levels across the sleep-wakefulness cycle. This protocol has been used successfully to quantify GABA levels in cat pontine reticular formation during wakefulness, NREM sleep, and REM sleep.14
After the last dialysis sample was collected and the dialysis probes were removed from the brain, each dialysis site was marked by making a 0.1 μL microinjection of non-transportable, colored (green, red, or blue) fluorescent microspheres (FluoSpheres, Molecular Probes, Inc., Eugene, OR). These microspheres have previously been used at the end of every experiment to uniquely mark individual dialysis sites for the purpose of determining whether GABA levels vary significantly across the sampling region.14 The microinjector and guide cannula were then removed from the brain, the craniotomy was sealed with sterile bone wax, and the animal was returned to the housing facility.
Histology and Statistics
The location of all dialysis sites was identified histologically. Procedures for anesthesia, brain perfusion and fixation, preparing slide-mounted tissue sections, identifying dialysis sites, and localizing fluorescent beads have been reported.14 Tissue sections containing microdialysis sites were digitized and the stereotaxic coordinates of dialysis sites were calculated by comparison with an atlas of the cat forebrain.22
The University of Michigan Center for Statistical Consultation and Research provided guidance for all statistical analyses. Tests were performed using software packages from Statistical Analysis System v9.2, (SAS Institute, Cary, NC) and Prism v5.0a for Mac OS X (GraphPad Software Inc., La Jolla, CA). Data are reported as mean ± SEM, and a P value < 0.05 was considered statistically significant. The data distribution of GABA levels in SI and cortex did not meet the assumptions of the general linear model. Therefore, differences in GABA levels during states of wakefulness, NREM sleep, and REM sleep were examined by fitting a linear mixed model controlling for random effects due to cat and experiment. The denominator degrees of freedom (df) reflects (1) the number of observations (n = samples) in each brain region, (2) the number of cats, (3) the number of states of arousal, and (4) a correction factor for random effect by cat or experiment. Post hoc tests comparing means were adjusted for multiple comparisons using the Tukey-Kramer procedure. A linear mixed model was used to analyze changes in GABA levels collected during prolonged wakefulness (Figure 1D, Phase 2) as a function of time, allowing random intercepts and slopes per animal within each experiment. This model was also used to determine whether there were changes in EEG power as a function of time during the period of prolonged wakefulness, and to test whether there was a significant relation between EEG power and GABA levels across the period of extended wakefulness.
RESULTS
Dialysis Sites were Localized to the SI and Cortex
Figure 2 summarizes the results of the histological analyses, which confirmed that all measures of GABA were obtained from either the SI region of the basal forebrain or from the cerebral cortex. Drawings schematize dialysis probes placed in the SI (Figure 2A) and cortex (Figure 2B). The areas marked by a red box are shown below and provide representative histological sections from basal forebrain (Figure 2C) and cortex (Figure 2D). Similar tissue sections from every cat were used to identify the location of each dialysis membrane. The use of fluorescent microspheres made it possible to link measures of GABA to a specific dialysis site in the SI (Figure 2E) or cortex (Figure 2F). Analyzing measures of GABA for each dialysis site revealed that in the SI, dialysis sites located between 2.5 to 3.5 mm lateral to the midline yielded GABA levels that were below the detection limit of the HPLC system. Thus, GABA levels in the SI were quantified from dialysis sites (Figure 2G) that ranged from 4.5 to 5.5 mm lateral to the midline and from 13.7 to 15.6 mm anterior to zero.22 The stereotaxic coordinates for all dialysis sites in the cortex (Figure 2H) ranged from 3.5 to 6.0 mm lateral to the midline and from 14.5 to 19.3 mm anterior to zero.22 Cortical measures of GABA were obtained from the somatosensory area (S1) and the association areas (5 and 7) of the posterior parietal cortex.23–26 GABA levels were above the detection limit for all cortical sites tested.
GABA Levels in the SI and Cortex Revealed State-Specific and Region-Specific Changes
GABA levels within the SI (Figure 3A) showed significant, state-specific changes (F = 7.09; df = 2, 124; P = 0.0012). During NREM sleep, GABA levels in the SI were significantly greater than during REM sleep (P < 0.0009). Cortical GABA levels (Figure 3B) also varied significantly in a state-specific manner (F = 19.50; df = 2, 90; P < 0.0001). Post hoc analyses revealed that cortical GABA levels were significantly greater during NREM sleep than during wakefulness (P = 0.0016) and REM sleep (P < 0.0001). The pattern of change in GABA levels (i.e., greatest GABA levels during NREM sleep) was consistent across frontal and parietal cortex.
Figure 4 plots GABA levels within the SI and cortex during the period of extended wakefulness (Figure 1D, Phase 2). GABA levels measured from the SI were stable during extended wakefulness (Figure 4A), and only 33% of the variance in GABA levels was accounted for by time spent awake. In contrast, there was a significant (F = 7.75; df = 1, 5; P = 0.0387), linear increase in cortical GABA levels during prolonged wakefulness (Figure 4B). Time spent awake accounted for 87% of the variance in cortical GABA levels. Analysis using a linear mixed model demonstrated no significant relationship between changes in EEG power and duration of prolonged wakefulness, and no significant relationship between EEG power and GABA levels during prolonged wakefulness.
Figure 5 illustrates the temporal organization of sleep and wakefulness and the time course of cortical GABA levels during two representative experiments. Figures 5A and 5C show that cats remained awake during most of the first 120 min after microdialysis probe insertion into the brain. Figures 5B and 5D show that after a progressive increase in GABA levels as a function of time awake (min 120 to 170), there was a gradual decrease in cortical GABA levels during the period of ad libitum sleep (min 170 to > 300). The decrease in GABA levels became evident after the first few sleep-wake cycles.
The Ratio of GABA-to-ACh Varied by Brain Region and Sleep State
Figures 6A and 6B plot the percent change in levels of GABA and ACh in cortex and SI during NREM sleep and REM sleep relative to levels during wakefulness. Mean transmitter levels during wakefulness were set at 100%. Figure 6A shows data from the cortex, where during NREM sleep GABA levels increase (see Figure 3B) and ACh levels decrease.15 During REM sleep, levels of GABA (see Figure 3B) and ACh15 were not different from levels during wakefulness. Figure 6B shows data from the SI, where during NREM sleep GABA levels do not change (see Figure 3A) and ACh levels decrease.11,12 During REM sleep, GABA levels in the SI show a nonsignificant decrease relative to wakefulness (see Figure 3A) and ACh levels in the SI increase.11,12 The brain-region-specific differences in state-specific neurotransmitter levels are further emphasized by comparing levels of GABA and ACh in cortex (Figure 6A) and SI (Figure 6B) with measures obtained from the medial part of the pontine reticular formation (Figure 6C).14 Expressing the brain-region-specific neurotransmitter profiles (Figure 6A–C) as the GABA-to-ACh ratio (Figure 6D) provides novel insights into the dynamic changes in chemical neurotransmission that occur with the transition from the NREM to REM phase of sleep. Figure 6D shows that across these 3 brain regions there is an overall decrease (−68%) in the GABA-to-ACh ratio during REM sleep compared with NREM sleep. Brain region-specific comparisons ranked from high to low show that the GABA-to-ACh ratio decreased in the cortex (−75%), pontine reticular formation (−67%), and SI (−61%) in REM sleep compared with NREM sleep. Table 1 summarizes the data used to calculate the GABA-to-ACh ratios plotted in Figure 6D.
DISCUSSION
The data show for the first time that extracellular GABA levels in the SI region of the basal forebrain and cerebral cortex varied in a state-specific manner. In both brain regions, GABA levels decreased significantly with the transition from NREM sleep to REM sleep. GABA levels in the cortex, but not the SI, increased progressively during prolonged wakefulness. Measures of GABA obtained in this study made it possible to determine the state-specific ratio of GABAergic to cholinergic transmission.
GABA Levels in the SI Decrease during REM Sleep
The present results show that levels of endogenous GABA within the SI are greater during NREM sleep than during REM sleep (Figure 3A). These findings agree with data showing that microinjection of the GABAA receptor agonist muscimol or the GABAB receptor agonist baclofen into rat basal forebrain causes an increase in NREM sleep.27 The present data are also consistent with the demonstration that GABAA receptors in the basal forebrain inhibit the release of ACh within the SI.13 Single unit recordings in the basal forebrain identified a subpopulation of GABAergic neurons that discharges maximally during NREM sleep.4 Neuronal sources of extracellular GABA in the SI include local interneurons28,29 and basal forebrain neurons that project or send collaterals to the SI.30,31 Considered together, these data support the interpretation that GABAergic transmission within the basal forebrain contributes to the generation of NREM sleep.
GABAergic neurons within the basal forebrain have multiple functional roles with respect to regulation of sleep and wakefulness. In addition to the NREM sleep-active neurons described above, some GABAergic neurons in the basal forebrain discharge maximally during wakefulness and REM sleep, whereas others reach peak firing rates only during REM sleep.4 Whether the GABAergic neurons in the basal forebrain recorded by Hassani et al.4 release GABA within the SI is not known. Nonetheless, the relatively small state-specific changes in GABA levels reported in Figure 3A may reflect the finding that GABAergic neurons in the basal forebrain show heterogeneous state-related discharge patterns. GABAergic input to the basal forebrain also originates in the amygdala.32,33 The fact that no prior studies have determined whether GABA arising from neurons in the amygdala contributes to sleep cycle control highlights an important research opportunity.
Cortical GABA Levels are Greatest during NREM Sleep
Most sedative-hypnotics and general anesthetics enhance GABAergic transmission at GABAA receptors. The effects of these drugs and the GABAA receptor agonist muscimol on the EEG range from causing synchronization with slow-wave activity to burst-suppression.34–37 Direct application of benzodiazepines38 or general anesthetics39 onto cortical neurons causes a significant depression of discharge rates that is mediated by GABAA receptors. The foregoing data are consistent with the present finding that GABA levels in the cortex are significantly greater during NREM sleep than during wakefulness and REM sleep (Figure 3B).
Is the Progressive Increase in Cortical GABA Levels during Extended Wakefulness a Marker of Homeostatic Sleep Drive?
To the best of our knowledge these are the first data showing that levels of GABA in the cerebral cortex increase progressively during prolonged wakefulness (Figure 4B). These results are specific to the cortex, as GABA levels in the SI (Figure 4A) and pontine reticular formation14 are stable during the same amount of time spent awake. A testable hypothesis is that this progressive increase in GABAergic tone in the cortex may signal increased sleep pressure and underlie manifestations of sleepiness during periods of extended wakefulness. Regression analysis revealed neither a significant change in cortical GABA levels as a function of time awake, nor a relationship between EEG power and GABA levels during prolonged wakefulness. A larger sample size or longer periods of prolonged wakefulness may be required to reveal such a relationship. Cats have been shown to respond to 14 hours of total sleep deprivation with compensatory increases in REM sleep, NREM sleep, and EEG delta power during NREM sleep.40
The present neurochemical data showing a progressive increase in GABA levels during prolonged wakefulness (Figure 4B) are in agreement with the finding that Fos expression in a subset of cortical GABAergic neurons is positively correlated with EEG delta power during NREM sleep. These findings suggest a role for GABA in regulating sleep homeostasis.7 Moreover, local groups of cortical neurons display brief and frequent “off periods” that are associated with behavioral deficits during extended wakefulness.41 Progressive increases in cortical GABA levels during wakefulness (Figure 4B) may mediate these neuronal “off periods” and behavioral deficits. The Figure 4B data showing that the amount of time spent in wakefulness accounted for most of the variance in cortical GABA is consistent with the concept of use-dependent modulation of cortical activity.42
The neuronal sources of extracellular GABA in the cortex remain to be identified. Sleep-active cortical GABAergic neurons send projections that synapse with other neurons within the cortex.43,44 These cortical cells and GABAergic neurons within the basal forebrain that project to the cortex5,6,30 are among possible sources of the progressive increase in cortical GABA levels that occurs as a function of time awake.
Figure 5B and 5D show that extracellular levels of GABA in the cortex increase during prolonged wakefulness (min 120 to 170), remain elevated during the first few sleep-wake cycles after prolonged wakefulness, and gradually decrease within the next 2 h of recovery sleep. The progressive decrease in GABA levels over time is not restricted to any specific sleep stage. In addition, GABA did not increase during episodes of spontaneous wakefulness that occurred after recovery sleep. The time course of changes in cortical GABA levels contrasts with reported changes in the levels of the sleep-promoting neuromodulator adenosine in the cortex and basal forebrain. Extracellular levels of adenosine increase during spontaneous wakefulness and during prolonged wakefulness, and decrease during sleep.45,46 Future studies are needed to determine whether extracellular GABA in the cortex plays a role in sleep homeostasis or is a neurochemical trait of NREM sleep.
The GABA-to-ACh Ratio Varies by Sleep State and Brain Region
With the transition from wakefulness to NREM sleep, the cortex shows an increase in GABA combined with a decrease in ACh (Figure 6A). These changes are described by a GABA-to-ACh ratio of 3.2 during NREM sleep (Figure 6D; Table 1). With the transition from NREM sleep to REM sleep, there were only small changes in the levels of cortical GABA and ACh relative to wakefulness (Figure 6A), resulting in a GABA-to-ACh ratio of 0.8 (Figure 6D; Table 1). The discovery that during NREM sleep cortical GABA levels increase whereas cortical ACh levels decrease (Figure 6A) suggests that GABAergic and cholinergic transmission have opposite effects on descending, cortical modulation of sleep,47 and supports the interpretation that GABAergic inhibition of cholinergic neurons contributes to generating the cortical electrographic activity (Figure 1C) that is a characteristic phenotype of NREM sleep.
During NREM sleep GABA levels in the SI changed little relative to wakefulness whereas there was a decrease in ACh (Figure 6B). This is reflected by a GABA-to-ACh ratio of 1.8 (Figure 6D; Table 1). During REM sleep, the GABA-to-ACh ratio in the SI (0.7; Figure 6D; Table 1) was similar to that observed in the cortex (0.8; Figure 6D; Table 1). These findings suggest that in the SI, relatively low cholinergic tone is important for NREM sleep, whereas relatively high cholinergic tone combined with relatively low GABAergic tone is important for REM sleep. The findings that in the SI, endogenous GABA inhibits the release of ACh13 and the GABAA receptor agonist muscimol inhibits REM sleep27 support this interpretation and suggest that GABA within the SI is inhibitory to REM sleep.
The pontine reticular formation shows a third pattern of state-specific changes in levels of GABA and ACh (Figure 6C). Relative to a GABA-to-ACh ratio of 1.0 during wakefulness, the ratio is similar during NREM sleep (GABA/ACh = 0.9; Figure 6D; Table 1). During REM sleep there is a large increase in ACh accompanied by a decrease in GABA levels (Figure 6C). Thus, compared to cortex and SI, the pontine reticular formation showed the lowest GABA-to-ACh ratio during REM sleep (0.3; Figure 6D; Table 1). ACh in the pontine reticular formation arises from cholinergic neurons in the laterodorsal and pedunculopontine tegmental nuclei.48 These cholinergic neurons also send projections to the thalamus that promote EEG activation.49 Relative to the cortex and SI, the pontine reticular formation showed the lowest GABA-to-ACh ratio during both NREM sleep and REM sleep (Figure 6D; Table 1). The low level of GABAergic inhibition in the pontine reticular formation is one mechanism contributing to the EEG activation caused by administering cholinergic agonists and acetylcholinesterase inhibitors into the pontine reticular formation.1,14
The aforementioned evidence highlights the novel insights provided by neurotransmitter ratios. Considering the GABA-to-ACh ratio in the pontine reticular formation as an example, it becomes clear that sleep/wake states are altered by changing GABAergic transmission (numerator only), cholinergic transmission (denominator only), or both (numerator and denominator). Indeed, in the pontine reticular formation either increasing cholinergic transmission14,50 or decreasing GABAergic transmission21,51,52 causes an increase in REM sleep. Epilepsy,53,54 chronic pain,55 and autism56 provide examples of neurological disorders in which changes in the levels of excitatory and inhibitory neurotransmitters modulate the output of specific neural networks. The signs and symptoms of these disorders can result from decreased inhibition, increased excitation, or both.
Two conclusions emerge from this study. First, the finding that sleep-state-specific changes in GABA levels differ between brain regions indicates that endogenous GABA modulates sleep differentially depending on brain region. These data and several lines of evidence support the interpretation that the effects of GABA on arousal state vary on a brain region-by-region basis. For example, in cat pontine reticular formation endogenous GABA levels are greatest during wakefulness and lowest during REM sleep.14 Enhancing GABAergic transmission in the pontine reticular formation increases wakefulness and decreases sleep.21,34,51 However, in the locus coeruleus57 and dorsal rapháe nucleus,58 endogenous GABA levels are greatest during REM sleep and microinjection of the GABAA receptor agonist muscimol into the dorsal rapháe nucleus increases REM sleep.58 In the posterior hypothalamus59 and ventroposterolateral nuclei of the thalamus,60 GABA levels are maximal during NREM sleep. The neurochemical data reported by Nitz et al.59 are consistent with the increase in NREM sleep obtained after microinjection of muscimol into the posterior hypothalamus.61 Considered together, these data indicate that GABA in the pontine reticular formation promotes wakefulness and suppresses REM sleep, GABA in the locus coeruleus and in the dorsal rapháe nucleus contributes to REM sleep generation, and GABA in the posterior hypothalamus and thalamus promotes NREM sleep and slow wave activity, respectively.
Second, structural and functional data from diverse neurobiological perspectives confirm that the balance of inhibition and excitation is critically important for normal brain function.62–64 The GABA-to-ACh ratio conveys state-specific increases and/or decreases in both GABA and ACh. The discovery that the GABA-to-ACh ratio varies significantly as a function of brain region and sleep state is relevant for conceptual65–67 and mathematical68,69 models of sleep cycle control. The GABA-to-ACh ratio provides a unique neurochemical signature of brain function. These ratios in natural sleep provide a novel analytic metric that can be compared to similar measures obtained during behavioral states induced by a variety of drug classes.
DISCLOSURE STATEMENT
This was not an industry supported study. The authors have indicated no financial conflicts of interest.
ACKNOWLEDGMENTS
This work was supported by grants MH45361 (HAB), HL40881 (RL), and HL65272 (RL) from the National Institutes of Health, and by the Department of Anesthesiology. The authors thank Dr. CJ Watson for consultation on the measurement of GABA. We are grateful for expert assistance provided by CR Baracy, S Jiang, MA Norat, and BL Wathen of the Department of Anesthesiology, and K Welch of the University of Michigan Center for Statistical Consultation and Research.
ABBREVIATIONS
- ACh
acetylcholine
- EEG
electroencephalogram
- GABA
gamma-amino butyric acid
- HPLC
high performance liquid chromatography
- NREM
non-rapid eye movement
- REM
rapid eye movement
- SEM
standard error of the mean
- SI
substantia innominata
REFERENCES
- 1.Baghdoyan HA, Lydic R. The neurochemistry of sleep and wakefulness . In: Brady ST, Albers RW, Price DL, Siegel GJ, editors. Basic Neurochemistry. New York: Elsevier; 2012. pp. 982–99. [Google Scholar]
- 2.Brown EN, Lydic R, Schiff ND. General anesthesia, sleep, and coma. New Engl J Med. 2010;363:2638–50. doi: 10.1056/NEJMra0808281. [DOI] [PMC free article] [PubMed] [Google Scholar]
- 3.Szymusiak R, McGinty D. Sleep-related neuronal discharge in the basal forebrain of cats. Brain Res. 1986;370:82–92. doi: 10.1016/0006-8993(86)91107-8. [DOI] [PubMed] [Google Scholar]
- 4.Hassani OK, Lee MG, Henny P, Jones BE. Discharge profiles of identified GABAergic in comparison to cholinergic and putative glutamatergic basal forebrain neurons across the sleep-wake cycle. J Neurosci. 2009;29:11828–40. doi: 10.1523/JNEUROSCI.1259-09.2009. [DOI] [PMC free article] [PubMed] [Google Scholar]
- 5.Henny P, Jones BE. Projections from basal forebrain to prefrontal cortex comprise cholinergic, GABAergic and glutamatergic inputs to pyramidal cells or interneurons. Eur J Neurosci. 2008;27:654–70. doi: 10.1111/j.1460-9568.2008.06029.x. [DOI] [PMC free article] [PubMed] [Google Scholar]
- 6.Freund TF, Meskenaite V. Gamma-aminobutyric acid-containing basal forebrain neurons innervate inhibitory interneurons in the neocortex. Proc Natl Acad Sci U S A. 1992;89:738–42. doi: 10.1073/pnas.89.2.738. [DOI] [PMC free article] [PubMed] [Google Scholar]
- 7.Gerashchenko D, Wisor JP, Burns D, et al. Identification of a population of sleep-active cerebral cortex neurons. Proc Natl Acad Sci U S A. 2008;105:10227–32. doi: 10.1073/pnas.0803125105. [DOI] [PMC free article] [PubMed] [Google Scholar]
- 8.Mesulam M-M, Mufson EJ, Wainer BH, Levey AI. Central cholinergic pathways in the rat: an overview based on an alternative nomenclature (Ch1-Ch6) Neuroscience. 1983;10:1185–201. doi: 10.1016/0306-4522(83)90108-2. [DOI] [PubMed] [Google Scholar]
- 9.Krnjevic K, Pumain R, Renaud L. The mechanism of excitation by acetylcholine in the cerebral cortex. J Physiol. 1971;215:247–68. doi: 10.1113/jphysiol.1971.sp009467. [DOI] [PMC free article] [PubMed] [Google Scholar]
- 10.Jasper HH, Tessier J. Acetylcholine liberation from cerebral cortex during paradoxical (REM) sleep. Science. 1971;172:601–2. doi: 10.1126/science.172.3983.601. [DOI] [PubMed] [Google Scholar]
- 11.Vazquez J, Baghdoyan HA. Basal forebrain acetylcholine release during REM sleep is significantly greater than during waking. Am J Physiol Regul Integr Comp Physiol. 2001;280:R598–R601. doi: 10.1152/ajpregu.2001.280.2.R598. [DOI] [PubMed] [Google Scholar]
- 12.Vazquez J, Lydic R, Baghdoyan HA. The nitric oxide synthase inhibitor NG-Nitro-L-arginine increases basal forebrain acetylcholine release during sleep and wakefulness. J Neurosci. 2002;22:5597–605. doi: 10.1523/JNEUROSCI.22-13-05597.2002. [DOI] [PMC free article] [PubMed] [Google Scholar]
- 13.Vazquez J, Baghdoyan HA. Muscarinic and GABAA receptors modulate acetylcholine release in feline basal forebrain. Eur J Neurosci. 2003;17:249–59. doi: 10.1046/j.1460-9568.2003.02451.x. [DOI] [PubMed] [Google Scholar]
- 14.Vanini G, Wathen BL, Lydic R, Baghdoyan HA. Endogenous GABA levels in the pontine reticular formation are greater during wakefulness than during rapid eye movement sleep. J Neurosci. 2011;31:2649–56. doi: 10.1523/JNEUROSCI.5674-10.2011. [DOI] [PMC free article] [PubMed] [Google Scholar]
- 15.Marrosu F, Portas C, Mascia MS, et al. Microdialysis measurement of cortical and hippocampal acetylcholine release during sleep-wake cycle in freely moving cats. Brain Res. 1995;671:329–32. doi: 10.1016/0006-8993(94)01399-3. [DOI] [PubMed] [Google Scholar]
- 16.Leonard TO, Lydic R. Pontine nitric oxide modulates acetylcholine release, rapid eye movement sleep generation, and respiratory rate. J Neurosci. 1997;17:774–85. doi: 10.1523/JNEUROSCI.17-02-00774.1997. [DOI] [PMC free article] [PubMed] [Google Scholar]
- 17.Vanini G, Watson CJ, Lydic R, Baghdoyan HA. Gamma-aminobutyric acid-mediated neurotransmission in the pontine reticular formation modulates hypnosis, immobility, and breathing during isoflurane anesthesia. Anesthesiology. 2008;109:978–88. doi: 10.1097/ALN.0b013e31818e3b1b. [DOI] [PMC free article] [PubMed] [Google Scholar]
- 18.Ursin R, Sterman M. Manual for Standardized Scoring of Sleep and Waking States in Adult Cats. Los Angeles: BIS/BRI, University of California; 1981. [Google Scholar]
- 19.Watson CJ, Venton BJ, Kennedy RT. In vivo measurements of neurotransmitters using microdialysis sampling. Anal Chem. 2006;78:1391–9. doi: 10.1021/ac0693722. [DOI] [PubMed] [Google Scholar]
- 20.Watson CJ, Lydic R, Baghdoyan HA. Sleep and GABA levels in the oral part of rat pontine reticular formation are decreased by local and systemic administration of morphine. Neuroscience. 2007;144:375–86. doi: 10.1016/j.neuroscience.2006.09.007. [DOI] [PMC free article] [PubMed] [Google Scholar]
- 21.Watson CJ, Soto-Calderon H, Lydic R, Baghdoyan HA. Pontine reticular formation (PnO) administration of hypocretin-1 increases PnO GABA levels and wakefulness. Sleep. 2008;31:453–64. doi: 10.1093/sleep/31.4.453. [DOI] [PMC free article] [PubMed] [Google Scholar]
- 22.Berman AL, Jones EG. The Thalamus and Basal Telencephalon of the Cat. A Cytoarchitectonic Atlas with Stereotaxic Coordinates. Madison: University of Wisconsin; 1982. [Google Scholar]
- 23.Lee CC, Winer JA. Principles governing auditory cortex connections. Cereb Cortex. 2005;15:1804–14. doi: 10.1093/cercor/bhi057. [DOI] [PubMed] [Google Scholar]
- 24.Markowitsch HJ, Pritzel M. Prefrontal cortex of the cat: evidence for an additional area. Experientia. 1979;35:396–8. doi: 10.1007/BF01964374. [DOI] [PubMed] [Google Scholar]
- 25.Scannell JW, Blakemore C, Young MP. Analysis of connectivity in the cat cerebral cortex. J Neurosci. 1995;15:1463–83. doi: 10.1523/JNEUROSCI.15-02-01463.1995. [DOI] [PMC free article] [PubMed] [Google Scholar]
- 26.Thompson RF, Johnson RH, Hoopes JJ. Organization of auditory, somatic sensory, and visual projection to association fields of cerebral cortex in the cat. J Neurophysiol. 1963;26:343–64. doi: 10.1152/jn.1963.26.3.343. [DOI] [PubMed] [Google Scholar]
- 27.Manfridi A, Brambilla D, Mancia M. Sleep is differently modulated by basal forebrain GABAA and GABAB receptors. Am J Physiol Regul Integr Comp Physiol. 2001;281:R170–R5. doi: 10.1152/ajpregu.2001.281.1.R170. [DOI] [PubMed] [Google Scholar]
- 28.Gritti I, Mainville L, Jones BE. Codistribution of GABA- with acetylcholine-synthesizing neurons in the basal forebrain of the rat. J Comp Neurol. 1993;329:438–57. doi: 10.1002/cne.903290403. [DOI] [PubMed] [Google Scholar]
- 29.Walker LC, Price DL, Young WS., III GABAergic neurons in the primate basal forebrain magnocellular complex. Brain Res. 1989;499:188–92. doi: 10.1016/0006-8993(89)91152-9. [DOI] [PubMed] [Google Scholar]
- 30.Gritti I, Mainville L, Mancia M, Jones BE. GABAergic and other noncholinergic basal forebrain neurons, together with cholinergic neurons, project to the mesocortex and isocortex in the rat. J Comp Neurol. 1997;383:163–77. [PubMed] [Google Scholar]
- 31.Gritti I, Mariotti M, Mancia M. GABAergic and cholinergic basal forebrain and preoptic-anterior hypothalamic projections to the mediodorsal nucleus of the thalamus in the cat. Neuroscience. 1998;85:149–78. doi: 10.1016/s0306-4522(97)00573-3. [DOI] [PubMed] [Google Scholar]
- 32.Paráe D, Smith Y. GABAergic projection from the intercalated cell masses of the amygdala to the basal forebrain in cats. J Comp Neurol. 1994;344:33–49. doi: 10.1002/cne.903440104. [DOI] [PubMed] [Google Scholar]
- 33.Zaborszky L, Heimer L, Eckenstein F, Leranth C. GABAergic input to cholinergic forebrain neurons: an ultrastructural study using retrograde tracing of HRP and double immunolabeling. J Comp Neurol. 1986;250:282–95. doi: 10.1002/cne.902500303. [DOI] [PubMed] [Google Scholar]
- 34.Flint RR, Chang T, Lydic R, Baghdoyan HA. GABAA receptors in the pontine reticular formation of C57BL/6J mouse modulate neurochemical, electrographic, and behavioral phenotypes of wakefulness. J Neurosci. 2010;30:12301–9. doi: 10.1523/JNEUROSCI.1119-10.2010. [DOI] [PMC free article] [PubMed] [Google Scholar]
- 35.Hambrecht-Wiedbusch VS, Gauthier EA, Baghdoyan HA, Lydic R. Benzodiazepine receptor agonists cause drug-specific and state-specific alterations in EEG power and acetylcholine release in rat pontine reticular formation. Sleep. 2010;33:909–18. doi: 10.1093/sleep/33.7.909. [DOI] [PMC free article] [PubMed] [Google Scholar]
- 36.Vyazovskiy VV, Tobler I, Winsky-Sommerer R. Alteration of behavior in mice by muscimol is associated with regional electroencephalogram synchronization. Neuroscience. 2007;147:833–41. doi: 10.1016/j.neuroscience.2007.05.003. [DOI] [PubMed] [Google Scholar]
- 37.Winters WD. Effects of drugs on the electrical activity of the brain: anesthetics. Annu Rev Pharmacol Toxicol. 1976;16:413–26. doi: 10.1146/annurev.pa.16.040176.002213. [DOI] [PubMed] [Google Scholar]
- 38.Drexler B, Zinser S, Hentschke H, Antkowiak B. Diazepam decreases action potential firing of neocortical neurons via two distinct mechanisms. Anesth Analg. 2010;111:1394–9. doi: 10.1213/ANE.0b013e3181f9c035. [DOI] [PubMed] [Google Scholar]
- 39.Antkowiak B. Different actions of general anesthetics on the firing patterns of neocortical neurons mediated by the GABAA receptor. Anesthesiology. 1999;91:500–11. doi: 10.1097/00000542-199908000-00025. [DOI] [PubMed] [Google Scholar]
- 40.Tobler I, Scherschlicht R. Sleep and EEG slow-wave activity in the domestic cat: effect of sleep deprivation. Behav Brain Res. 1990;37:109–18. doi: 10.1016/0166-4328(90)90086-t. [DOI] [PubMed] [Google Scholar]
- 41.Vyazovskiy VV, Olcese U, Hanlon EC, Nir Y, Cirelli C, Tononi G. Local sleep in awake rats. Nature. 2011;472:443–7. doi: 10.1038/nature10009. [DOI] [PMC free article] [PubMed] [Google Scholar]
- 42.Szymusiak R. Hypothalamic versus neocortical control of sleep. Curr Opin Pulm Med. 2010;16:530–5. doi: 10.1097/MCP.0b013e32833eec92. [DOI] [PubMed] [Google Scholar]
- 43.Tomioka R, Okamoto K, Furuta T, et al. Demonstration of long-range GABAergic connections distributed throughout the mouse neocortex. Eur J Neurosci. 2005;21:1587–600. doi: 10.1111/j.1460-9568.2005.03989.x. [DOI] [PubMed] [Google Scholar]
- 44.Higo S, Udaka N, Tamamaki N. Long-range GABAergic projection neurons in the cat neocortex. J Comp Neurol. 2007;503:421–31. doi: 10.1002/cne.21395. [DOI] [PubMed] [Google Scholar]
- 45.Porkka-Heiskanen T, Strecker RE, Thakkar M, Bjorkum AA, Greene RW, McCarley RW. Adenosine: a mediator of the sleep-inducing effects of prolonged wakefulness. Science. 1997;276:1265–8. doi: 10.1126/science.276.5316.1265. [DOI] [PMC free article] [PubMed] [Google Scholar]
- 46.Porkka-Heiskanen T, Strecker RE, McCarley RW. Brain site-specificity of extracellular adenosine concentration changes during sleep deprivation and spontaneous sleep: an in vivo microdialysis study. Neuroscience. 2000;99:507–17. doi: 10.1016/s0306-4522(00)00220-7. [DOI] [PubMed] [Google Scholar]
- 47.Van Dort CJ, Baghdoyan HA, Lydic R. Adenosine A1 and A2A receptors in mouse prefrontal cortex modulate acetylcholine release and behavioral arousal. J Neurosci. 2009;29:871–81. doi: 10.1523/JNEUROSCI.4111-08.2009. [DOI] [PMC free article] [PubMed] [Google Scholar]
- 48.Lydic R, Baghdoyan HA. Pedunculopontine stimulation alters respiration and increases ACh release in the pontine reticular formation. Am J Physiol Regul Integr Comp Physiol. 1993;264:R544–R54. doi: 10.1152/ajpregu.1993.264.3.R544. [DOI] [PubMed] [Google Scholar]
- 49.Datta S. Cellular and chemical neuroscience of mammalian sleep. Sleep Med. 2010;11:431–40. doi: 10.1016/j.sleep.2010.02.002. [DOI] [PMC free article] [PubMed] [Google Scholar]
- 50.Baghdoyan HA, Monaco AP, Rodrigo-Angulo ML, Assens F, McCarley RW, Hobson JA. Microinjection of neostigmine into the pontine reticular formation of cats enhances desynchronized sleep signs. J Pharmacol Exp Ther. 1984;231:173–80. [PubMed] [Google Scholar]
- 51.Xi MC, Morales FR, Chase MH. Evidence that wakefulness and REM sleep are controlled by a GABAergic pontine mechanism. J Neurophysiol. 1999;82:2015–9. doi: 10.1152/jn.1999.82.4.2015. [DOI] [PubMed] [Google Scholar]
- 52.Vazquez J, Baghdoyan HA. GABAA receptors inhibit acetylcholine release in cat pontine reticular formation: implications for REM sleep regulation. J Neurophysiol. 2004;92:2198–206. doi: 10.1152/jn.00099.2004. [DOI] [PubMed] [Google Scholar]
- 53.Knopp A, Frahm C, Fidzinski P, Witte OW, Behr J. Loss of GABAergic neurons in the subiculum and its functional implications in temporal lobe epilepsy. Brain. 2008;131:1516–27. doi: 10.1093/brain/awn095. [DOI] [PubMed] [Google Scholar]
- 54.Cavus I, Pan JW, Hetherington HP, et al. Decreased hippocampal volume on MRI is associated with increased extracellular glutamate in epilepsy patients. Epilepsia. 2008;49:1358–66. doi: 10.1111/j.1528-1167.2008.01603.x. [DOI] [PubMed] [Google Scholar]
- 55.Schmidtko A, Luo C, Gao W, Geisslinger G, Kuner R, Tegeder I. Genetic deletion of synapsin II reduces neuropathic pain due to reduced glutamate but increased GABA in the spinal cord dorsal horn. Pain. 2008;139:632–43. doi: 10.1016/j.pain.2008.06.018. [DOI] [PubMed] [Google Scholar]
- 56.Fatemi SH, Folsom TD, Kneeland RE, Liesch SB. Metabotropic glutamate receptor 5 upregulation in children with autism is associated with underexpression of both Fragile X mental retardation protein and GABAA receptor beta 3 in adults with autism. Anat Rec (Hoboken) 2011;294:1635–45. doi: 10.1002/ar.21299. [DOI] [PMC free article] [PubMed] [Google Scholar]
- 57.Nitz D, Siegel JM. GABA release in the locus coeruleus as a function of sleep/wake state. Neuroscience. 1997;78:795–801. doi: 10.1016/s0306-4522(96)00549-0. [DOI] [PMC free article] [PubMed] [Google Scholar]
- 58.Nitz D, Siegel J. GABA release in the dorsal raphe nucleus: role in the control of REM sleep. Am J Physiol. 1997;273:R451–5. doi: 10.1152/ajpregu.1997.273.1.R451. [DOI] [PMC free article] [PubMed] [Google Scholar]
- 59.Nitz D, Siegel JM. GABA release in posterior hypothalamus across sleep-wake cycle. Am J Physiol. 1996;271:R1707–12. doi: 10.1152/ajpregu.1996.271.6.R1707. [DOI] [PMC free article] [PubMed] [Google Scholar]
- 60.Kekesi KA, Dobolyi A, Salfay O, Nyitrai G, Juhasz G. Slow wave sleep is accompanied by release of certain amino acids in the thalamus of cats. Neuroreport. 1997;8:1183–6. doi: 10.1097/00001756-199703240-00025. [DOI] [PubMed] [Google Scholar]
- 61.Lin JS, Sakai K, Vanni-Mercier G, Jouvet M. A critical role of the posterior hypothalamus in the mechanisms of wakefulness determined by microinjection of muscimol in freely moving cats. Brain Res. 1989;479:225–40. doi: 10.1016/0006-8993(89)91623-5. [DOI] [PubMed] [Google Scholar]
- 62.Cline H. Synaptogenesis: a balancing act between excitation and inhibition. Curr Biol. 2005;15:R203–R5. doi: 10.1016/j.cub.2005.03.010. [DOI] [PubMed] [Google Scholar]
- 63.Gulledge AT, Kampa BM, Stuart GJ. Synaptic integration in dendritic trees. J Neurobiol. 2005;64:75–90. doi: 10.1002/neu.20144. [DOI] [PubMed] [Google Scholar]
- 64.Levinson JN, El-Husseini A. Building excitatory and inhibitory synapses: balancing neuroligin partnerships. Neuron. 2005;48:171–4. doi: 10.1016/j.neuron.2005.09.017. [DOI] [PubMed] [Google Scholar]
- 65.Brown RE, McKenna JT, Winston S, et al. Characterization of GABAergic neurons in rapid-eye-movement sleep controlling regions of the brainstem reticular formation in GAD67-green fluorescent protein knock-in mice. Eur J Neurosci. 2008;27:352–63. doi: 10.1111/j.1460-9568.2008.06024.x. [DOI] [PMC free article] [PubMed] [Google Scholar]
- 66.Lu J, Sherman D, Devor M, Saper CB. A putative flip-flop switch for control of REM sleep. Nature. 2006;441:589–94. doi: 10.1038/nature04767. [DOI] [PubMed] [Google Scholar]
- 67.Luppi PH, Gervasoni D, Verret L, et al. Paradoxical (REM) sleep genesis: the switch from an aminergic-cholinergic to a GABAergic-glutamatergic hypothesis. J Physiol Paris. 2007;100:271–83. doi: 10.1016/j.jphysparis.2007.05.006. [DOI] [PubMed] [Google Scholar]
- 68.McCarley RW. Neurobiology of REM and NREM sleep. Sleep Med. 2007;8:302–30. doi: 10.1016/j.sleep.2007.03.005. [DOI] [PubMed] [Google Scholar]
- 69.Diniz Behn CG, Booth V. Simulating microinjection experiments in a novel model of the rat sleep-wake regulatory network. J Neurophysiol. 2010;103:1937–53. doi: 10.1152/jn.00795.2009. [DOI] [PubMed] [Google Scholar]