

Abstract
Study Objective:
We have previously established that CAST/EiJ (CAST) mice differ from normal mice, such as C57BL/6J (B6), in the timing of wheel-running onset relative to light/dark cycles. These mice provide an animal model for studies of the genetic and neurobiological basis for circadian phase misalignment in humans. Neither differences in endogenous circadian period nor the shape of the photic phase response curve explain the difference in the timing of activity onset between CAST and B6 mice, suggesting a mechanism downstream of the circadian clock. Here, we further test the hypothesis that the two strains differ with respect to circadian oscillations at the molecular level.
Design:
Sleep/wake cycles were examined and rhythms of Period1 (Per1) and Period2 (Per2) expression were measured in the cerebral cortex, suprachiasmatic nucleus (SCN), and other hypothalamic regions.
Setting:
Basic sleep and molecular research laboratory.
Patients or Participants:
Male mice of the B6 and CAST inbred strains.
Interventions:
None.
Measurements and Results:
Sleep/wake cycles were advanced by approximately 4 h in CAST mice relative to B6 mice. This was paralleled by phase-advanced rhythms of Per1 and Per2 expression, as measured byin situ hybridization, in the cerebral cortex of CAST relative to B6. By contrast, the timing of circadian oscillations and the photic induction ofPer1 and Per2 expression in the SCN were unaffected by strain.
Conclusion:
The advanced phase of wheel running and sleep/wake cycles in CAST mice relative to B6 mice is apparently not associated with differences in molecular oscillations in the SCN clock itself, but most likely in mechanisms downstream of the SCN clock. CAST mice may therefore provide a model system to investigate circadian downstream mechanisms underlying unusual patterns of entrainment to the ambient photoperiod.
Citation:
Jiang P; Franklin KM; Duncan MJ; O'Hara BF; Wisor JP. Distinct phase relationships between suprachiasmatic molecular rhythms, cerebral cortex molecular rhythms, and behavioral rhythms in early runner (CAST/EiJ) and nocturnal (C57BL/6J) mice. SLEEP 2012;35(10):1385-1394.
Keywords: Per expression, paraventricular nucleus, subparaventricular zone, circadian, advanced sleep phase syndrome
INTRODUCTION
The molecular machinery of the circadian clock consists of a series of interlocking feedback loops involving the transcription, translation, and post-translational modifications of a small number of genes and proteins.1 The roles of discrete genetic loci in regulating circadian rhythms at the whole-organism level are demonstrated by the robust circadian phenotypes caused by point mutations2 and gene knockout3,4 in animal models. Mutations with similarly robust effects are present but exceedingly rare in human populations.5–7 However, within human populations, there is enormous variability in circadian phenotypes (also described as chronotypes),8 which are likely to be genetically complex. Studies of circadian phenotypes in genetically complex animal models therefore serve as a useful complement to studies of single gene effects on circadian rhythms.
We described a genetically complex phenotype, the early runner phenotype, in hybrid offspring of the CAST/EiJ (CAST) and C57BL/6J (B6) strains of mice.9 A (B6 × CAST) × CAST backcross population exhibited considerable variability in the onset of daily wheel running bouts in a light/dark 12:12 (LD12:12) cycle. Quantitative trait loci (QTL) analysis determined that a portion of mouse chromosome 18 confers variability in phase angle of entrainment.9 Transfer of the QTL segment on chromosome 18 from the CAST background to the B6 background demonstrated conclusively that this chromosomal region determines circadian phenotypic variability.10
Circadian clock properties measured at the behavioral and molecular levels may provide information about the neurobiological basis of the phenotype. Variability in circadian period may contribute to variability in the phase angle of entrainment,11 but it did not do so in the (B6 × CAST) × CAST backcross population9 or within the CAST inbred line.10 Variability in the shape of the photic phase response curve may also cause variability in the phase angle of entrainment.12 The photic phase response curves of CAST and B6 mice were nearly identical in shape, but the strains differed in the timing of advancing and delaying responses to light relative to the behaviorally defined (i.e., wheel running onset) circadian phase.10 This observation raised the possibility that mechanisms downstream of the SCN, rather than the timing of the SCN clock itself, underlies the advanced behavioral rhythms in CAST mice compared to B6. To address this possibility, we now take measures of molecular rhythmicity (Per1 andPer2 expression) in the SCN clock and in extra-SCN brain regions, including the cerebral cortex as well as 2 direct targets of SCN projections, subparaventricular zone (sPVZ) and paraventricular nucleus (PVN) of the hypothalamus in CAST and B6 mice. In addition, our previous studies utilized running-wheels to access behavioral rhythmicity. Because wheel-running is not an accurate measurement of sleep/wake and because activity patterns in rodents can be influenced by the accessibility of a running-wheel, here we directly measure sleep and wake in B6 and CAST mice using a piezoelectric system validated for sleep/wake determinations.13 We report that while sleep/wake cycles are advanced even more robustly than wheel running rhythms in CAST mice relative to B6 mice, the SCN molecular clocks of the two strains are in phase. Daily rhythms ofPer1 andPer2 expression in cerebral cortex are in synchrony with those of behavior but not the SCN clock. The early runner phenotype is therefore most likely to be associated with differences downstream of, rather than within, the SCN clock. Our data demonstrate that CAST mice may be a useful animal model for the study of human circadian misalignment, such as seen in advanced/delayed sleep phase syndrome, shift-workers, and jet lag.
METHODS
Experimental Subjects
Male mice of the CAST (strain # 000928) and B6 (strain # 000664) strains were purchased at 6 weeks of age from the Jackson Laboratory (Bar Harbor, ME). Distinct cohorts were used for piezoelectric measurement of sleep and wake (Experiment 1) and in situ hybridization studies (Experiments 2-3). Unless otherwise noted, animals were housed in individual cages under LD12:12 cycles of 80 lux white light and total darkness in light-tight chambers at a temperature set point of 24.5°C, with food and water provided ad libitum. All animal procedures were performed at Washington State University, and were approved by the Washington State University Institutional Animal Care and Use Committee and consistent with the Institute of Laboratory Animal Resources Guide for Care and Use of Laboratory Animals.
Experiment 1: Piezoelectrically Based Sleep/Wake Assessment
Piezoelectrically defined sleep was measured in CAST (N = 4) and B6 (N = 11) mice using techniques described in detail elsewhere.10,–15 Mice were transferred from their wheel-running cages to the piezoelectric data collection environment for a 2-day data collection session. Piezoelectric potential generated by pressure on or distention of the cage floor was monitored continuously at 100 Hz throughout the duration of the multi-day recording sessions. Muscle activity was inferred based on piezoelectric waveforms. Custom software described elsewhere13,14 was used to discriminate between states of sleep (detection of respiratory muscle activity only) and wakefulness (detection of skeletal muscle activity). The piezoelectric device exhibits more than 90% sensitivity relative to electroencephalographically defined sleep14 but does not discriminate between non-rapid eye movement sleep and rapid eye movement sleep. Data were collected and processed algorithmically in 2-sec intervals. For state classification, data were collapsed into 10-sec epochs. Each epoch was classified as sleep if all 5 of the 2-sec sub-epochs were algorithmically scored as sleep, or as wake if ≥ 1 of the 5 2-sec sub-epochs was algorithmically scored as wake.
Experiment 2: Measurement of Daily Cycles of Per1 and Per2 Expression in the Cerebral Cortex, PVN, sPVZ, and SCN
Mice of the B6 and CAST strains were housed in a 12-h light/12-h dark (LD12:12; lights-on at 4:00 and lights-off at 16:00, local time) cycle for ≥ 10 days, then kept in darkness beginning at 16:00 for 15, 18, 21, 24, 27, or 33 h (i.e., until local time 7:00, 10:00, 13:00, 16:00, 19:00 the next day, and 1:00 the day after, respectively). As our previous data demonstrated that both CAST and B6 mice retain their original circadian phase of activity onset after transfer into constant darkness,10 these time-points correspond to ZT3, ZT6, ZT9, ZT12, ZT15, and ZT21 in an LD12:12 cycle. Mice were euthanized by cervical dislocation and were kept in dim red light (< 20 lux) until the optic nerves were severed. Immediately after dissection, brains were frozen on crushed dry ice and stored at −80°C. Coronal sections throughout the hypothalamus (14 microns thick) were prepared using a cryostat. The brain sections were mounted on negatively charged slides and stored at −80°C until in situ hybridization was conducted for Per1 and Per2, as described below.
Experiment 3: Measurement of Circadian Phase-Dependence of Light-Induced Per1 and Per2 Expression in the SCN by Quantitative In Situ Hybridization Histochemistry
Both CAST and B6 mice were housed in an LD12:12 cycle (lights-on at 4:00 and lights-off at 16:00, local time) ≥ 10 days, then kept in darkness beginning at 16:00 for 18, 21, 24, or 27 h (i.e., until local time 10:00, 13:00, 16:00, and 19:00 the next day, respectively). These times correspond to ZT6, ZT9, ZT12, and ZT15 in an LD12:12 cycle. Mice were then exposed to 80 lux white light for 30 minutes. In preparation for this white light exposure, mice were moved in their cages to a different light-tight chamber in the same room but were not directly handled. Mice were euthanized by cervical dislocation at the end of the light exposure and were kept in dim red light (< 20 lux) until the optic nerves were severed. Mice euthanized in constant darkness at the analogous time of day in Experiment 2 served as control subjects. The brains were dissected and prepared for in situ hybridization, as described in Experiment 2.
In situ Hybridization Histochemistry
Two antisense DNA oligos for Per1 mRNA (5'-TGG GTG GGG ATG GGC TCT GTG AGT TTG TAC TCT TGC TGC-3' and 5'-TCG GGG TTT GGG GAC TGG CAG GGA AGG ACT TTG GCT TTG AA-3', corresponding to GenBank ID NM_001159367.1 at 475-437 nt and 1958-1918 nt respectively, also to GenBank ID NM_011065.4 at 490-452 nt and 1973-1933 nt, respectively) and for Per2 mRNA (5'-GGT CCT TAT CAG TTC TTT GTG TGC GTC AGC TTT GGC-3' and 5'-GCC TTT CTC CTC ACT CTC GCA GTA AAC ACA GCC TG-3', corresponding to 510-475 nt and 3831-3797 nt of GenBank ID NM_011066.3) were purchased from IDT (Coralville, IA). Oligonucleotides were labeled by the addition of a 3' poly-33P-dATP tail using terminal transferase (NEB, Beverly, MA). Labeled oligo probes were separated from unincorporated nucleotide through mini Quick-Spin oligo purification columns (Roche, Indianapolis, IN).
Four brain sections encompassing the SCN from each animal were used in the in situ hybridization experiment. Slide-mounted brain sections received a sequence of pre-hybridization treatments, including fixation in 4% paraformaldehyde/0.1 M phosphate buffer (pH 7.4), several washes in 1X PBS and 1X PBS/27 mM glycine, acetylation using 0.25% acetic anhydride in 0.1 M triethanolamine solution (pH 8.0), and dehydration/delipidation using ethanol solutions and chloroform. Slides were then air dried and sections were hybridized to 33P-labeled oligo probes diluted in a hybridization cocktail [final concentration of 37.5% formamide (deionized), 7.5% dextran sulfate, 0.75X Denhardt, 15 mM Tris-HCL (pH 7.4), 225 mM NaCl, 0.75 mM EDTA, 75 mM DTT, 250 μg/mL salmon sperm DNA, and 25 μg/mL yeast RNA] and covered with coverslips. After overnight incubation at 37°C, slides were rinsed in 2X SSC/10 mM DTT/0.25% Na2S2O3 at room temperature to remove coverslips. Sections were then subjected to a series of post-hybridization washes, which consisted of one wash in 2X SSC/10 mM DTT/0.25% Na2S2O3 solution at room temperature, 4 washes in 1X SSC/10 mM Na2S2O3 at 55°C, and 2 additional washes in the same solution at room temperature. Slides were then quickly dipped in sterile water and then 95% ethanol, air dried, and placed against autoradiography films (Biomax MR, Kodak, Rochester, NY) together with a set of 14C radioactive standards (Amersham Life Sciences, Piscataway, NJ) in x-ray cassettes. After exposure times ranging from 11 days to 23 days, the experimental films were developed.
Image Analysis
The hybridization signal in each region of interest was determined using an MCID image analysis system (Imaging Research Inc., St. Catherines, Ontario, Canada). A standard curve was established using the optical densities of the 14C standards and curve fitting (3rd-degree-polynomial). The hybridization signal of each sample was determined from the standard curve. In the SCN, the hybridization signal for each mRNA species was measured bilaterally within closed outlines around the entire SCN. In the cerebral cortex, Per1 and Per2 expression were measured bilaterally within a closed outline drawn around the dorsal cortex from the cingulate cortex to the dorsal boundary of the piriform cortex (thus containing cingulate/retrosplenial, motor, somatosensory, and insular cortices). We also measured Per1 and Per2 expression in the sPVZ and PVN, as these 2 regions receive direct SCN projections and Per expression in these regions may reflect circadian timing downstream of the SCN. Expression of Per1 and Per2 in the sPVZ was measured using a narrow rectangle box (of the same shape and size for all samples) placed dorsal to the SCN and ventral to the PVN. Also, Per1 and Per2 expression was measured bilaterally in PVN using an outline drawn around each nucleus. Finally, the level of background signal was also measured from four areas with the lowest signals in each brain section, and its average value was subtracted from the hybridization signals of the corresponding regions of interest. Background-subtracted hybridization signals for each region of interest were averaged across all 4 sections used for each animal, and then subject to statistical analysis.
Statistical Analysis
Statistical analyses were performed with Statistica 9.0. To measure strain-dependence of daily oscillations in sleep/wake timing, data were subjected to factorial analysis of variance (ANOVA) with strain and time of day in 4-h bins (starting at 4:00 vs. 8:00 vs. 12:00 vs. 16:00 vs. 20:00 vs. 0:00, local time) as independent variables. In those cases when ANOVA indicated significant time of day × strain interaction, the data were subjected topost hoc contrasts between genotype groups within each time of day. To measure strain-dependence of daily oscillations in mRNA levels, data were subjected to factorial ANOVA with strain (CAST vs. B6) and time of day (7:00 vs. 10:00 vs. 13:00 vs. 16:00 vs. 19:00 vs. 1:00, local time) as independent variables. In those cases when ANOVA indicated significant time of day × strain interaction, the data were subjected topost hoc contrasts between genotype groups within each time of day. To measure effects of light exposure on SCN gene expression, dependent variables were subjected to factorial ANOVA with strain (CAST vs. B6), ambient condition in the 30-min interval before euthanasia (light vs. dark) and time of day (10:00 vs. 13:00 vs. 16:00 vs. 19:00, local time) as independent variables. In those cases when ANOVA indicated significant time of day × light exposure interaction, the data were subjected topost hoc contrasts of the light-exposed and dark control groups within each genotype/time of day condition. Post hoc contrasts were performed with Bonferroni corrected Student's t. In all cases, results are presented as mean ± SEM.
RESULTS
Piezoelectrically defined sleep/wake assessment reveals strain differences in the phase angle of entrainment and total daily sleep time.
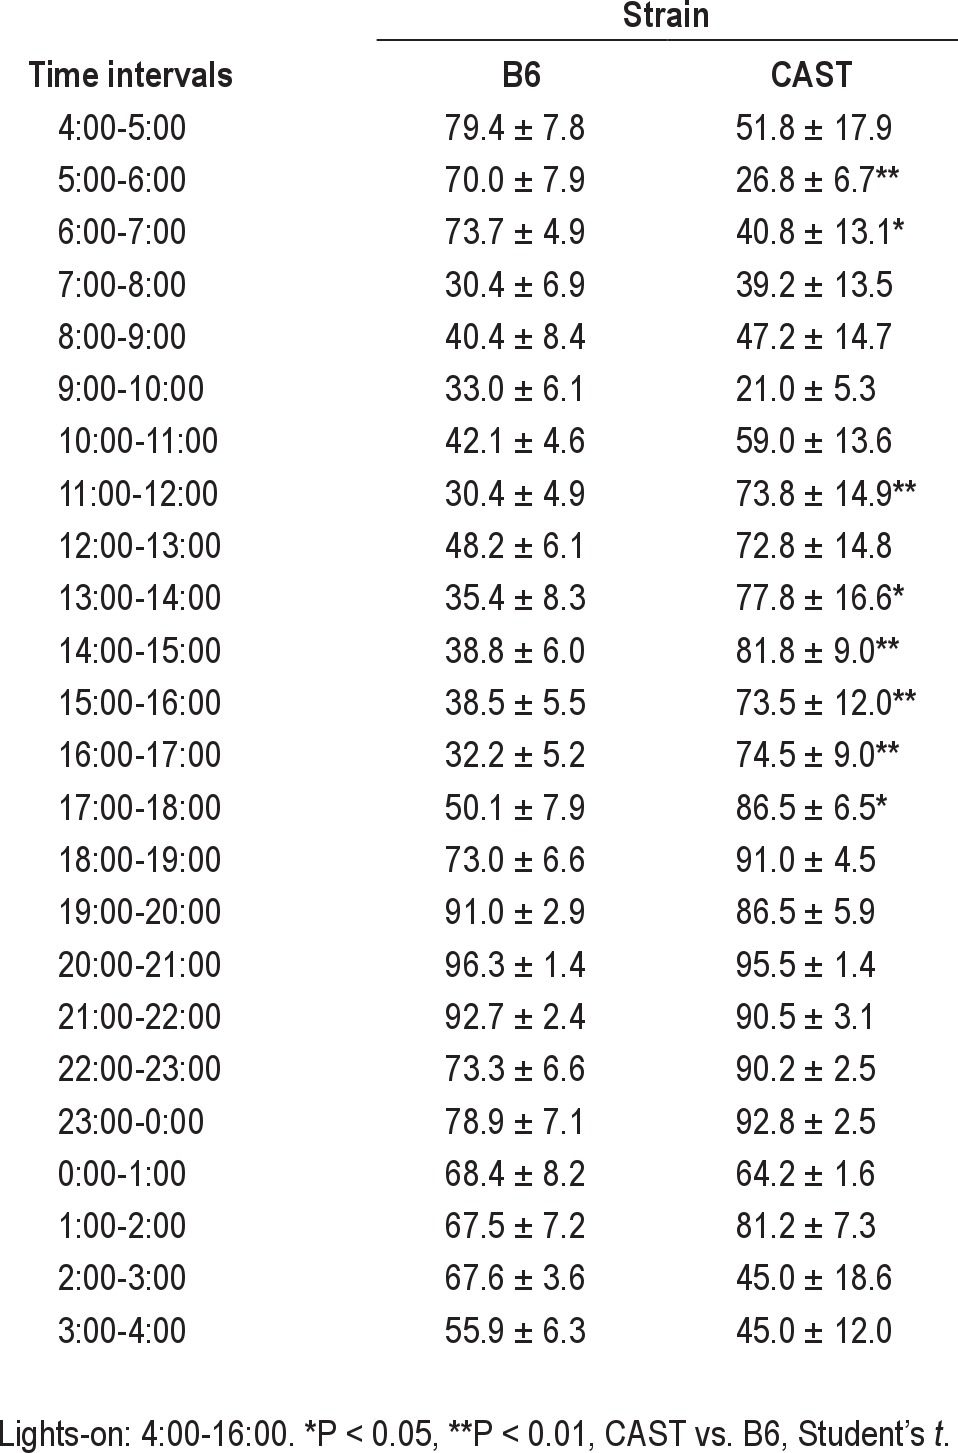
As indicated by piezoelectric recording, both strains exhibited robust daily rhythms of sleep/wake cycles under our experimental conditions (Table 1; Figure 1). There were significant main effects of time of day on sleep and wake as a percentage of time, whether the data were subjected to ANOVA in 1-h bins (F23,299 = 8.74, P < 0.001; Table 2) or 4-h bins aligned to the light/dark transitions (F5,65 = 16.14, P < 0.001). Subsequent analyses were performed on data in 4-h bins. Both CAST and B6 mice exhibited more time asleep during the light phase of the LD12:12 cycle than the dark phase (Table 1). ANOVA yielded a significant main effect of strain on sleep as a percentage of time (F1,13 = 7.43, P = 0.017). CAST mice spent approximately 20% less time asleep than B6 mice during the 24-h cycle, as well as during both the light and dark phases (Table 1). ANOVA also yielded a significant strain × time of day interaction for percent of time spent asleep in 4-h bins (F5,65 = 6.98, P < 0.001). This interaction was due to the fact that CAST and B6 mice initiated their major daily wake episodes at distinct phases of the LD12:12 cycle: CAST mice spent more time awake than B6 mice in the last 4 h of the light phase (i.e., 12:00-16:00; Figure 1). Time spent awake reached a daily trough during the first 4 h of the light phase (i.e., 4:00-8:00, local time) in CAST mice and later (at 8:00-12:00) in B6 mice (Figure 1). The difference in the timing of sleep between the strains was significant when it was measured as the ratio of sleep during the last 4 h of the light phase relative to the first 4 h of the light phase. This measure differed significantly between CAST (0.49 ± 0.32) and B6 (1.96 ± 0.28) mice (Student's t = 2.88, P = 0.013). Thus, the daily rhythm of sleep and wake was advanced in CAST mice relative to B6 mice under entrained conditions.
Table 1.
Piezoelectrically defined sleep amounts (% of total recording time) in B6 and CAST mice
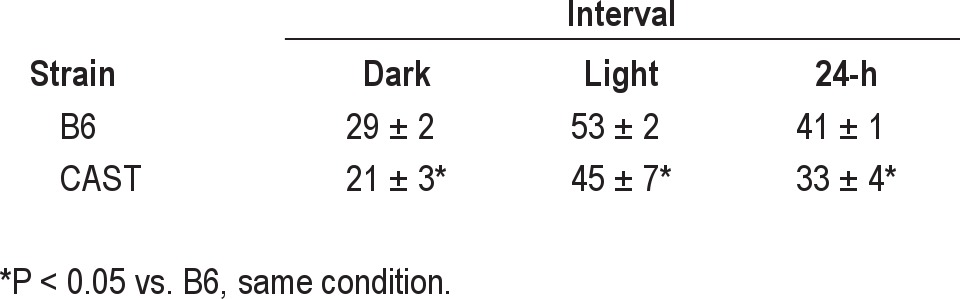
Figure 1.
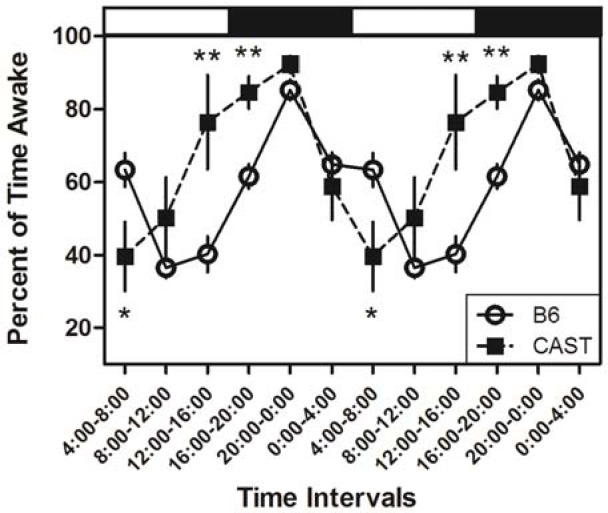
Piezoelectrically defined sleep and wake states differ between B6 and CAST strains. The advanced sleep/wake cycles in CAST compared to B6 are clearly demonstrated when the data from the two parental strains are plotted in 4-h intervals throughout the LD12:12 cycle and replicated for a second cycle. The timing of the light and dark phases of the LD12:12 cycle are indicated, respectively, by the horizontal white and black bars at the top of the graph (lights-on from 4:00 to 16:00, local time). ** and *, significantly different from B6 (P < 0.01 and P < 0.05, respectively, Student's t test).
Table 2.
Percent time spent awake in 1-h bins in B6 and CAST mice over 24 h
Per1 mRNA rhythms in extra-SCN brain regions but not in the SCN are affected by strain.
Expression of Per1 mRNA in the cerebral cortex was significantly affected by strain and time of day (Table 3A); there was also a significant strain × time interaction (Table 3A). Both the CAST and B6 strains exhibited circadian variations in the cortical expression of Per1 (Figure 2A–E). The peak of Per1 expression was advanced in CAST mice by 3 h relative to B6 mice. In CAST mice, Per1 expression in the cerebral cortex increased dramatically from 10:00 to 13:00 (local time; Figure 2E). In B6 mice, Per1 expression in the cerebral cortex did not increase from its daytime low until 16:00. As a result of the discrepancy in the timing of Per1 mRNA elevation from the daily minimum, Per1 expression was significantly higher in CAST mice relative to B6 mice at 13:00. In addition, the daily trough of Per1 mRNA level also occurred at an earlier time of day in CAST mice (1:00-10:00) than in B6 mice (7:00-13:00). Therefore, the difference in the circadian timing of behavioral measures (i.e., wheel running10 and sleep) between CAST and B6 mice is accompanied by a difference in the circadian timing of Per1 expression in the cerebral cortex.
Table 3.
Summary of ANOVA results of Per1 and Per2 expression experiments.
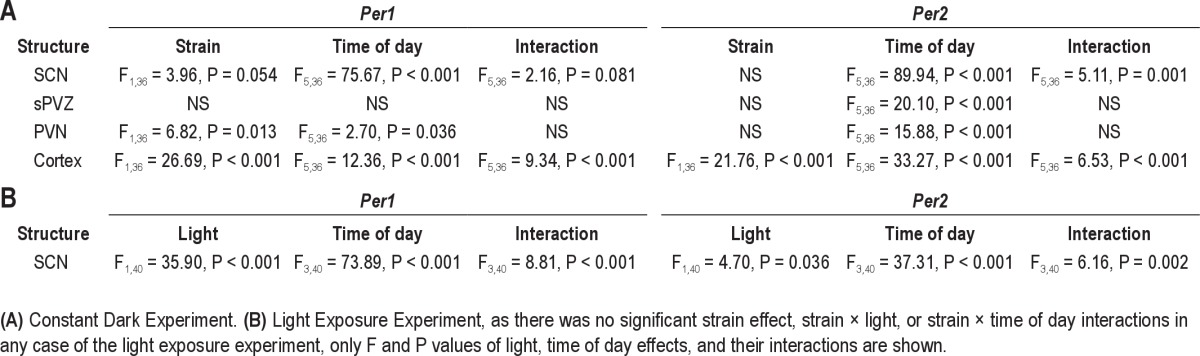
Figure 2.

Differential effects of strain (CAST vs. B6) on Per1 expression in the extra-SCN brain regions. LEFT: Photomicrographs depicting representative Per1 mRNA signal in the cerebral cortex (A-D), PVN (F-I) and sPVZ (K-N) of B6 (upper panels) and CAST (lower panels) strains at two times of day. RIGHT: Daily profiles of Per1 mRNA levels in the cortex (E), PVN (J) and sPVZ (O) of B6 (open circles and solid lines) and CAST (filled squares and dashed lines) mice (N = 4 per group). Lighting schedule (lights-on from 4:00 to 16:00, local time) of the prior LD cycle is indicated by the gray and black bars at the top of each panel. *Significantly different from B6 at the same time point (P < 0.05, Student's t test with Bonferroni correction). In all panels, scale bar = 500 μm.
To further map the basis of the strain difference in circadian rhythmicity, we measured Per1 expression in the PVN (Figure 2F–J) and sPVZ (Figure 2K–O) of the hypothalamus. In the sPVZ, there were no significant main effects of time or strain on Per1 expression nor was there a significant interaction (all P > 0.07). In contrast to the sPVZ, Per1 expression in the PVN was significantly modulated by strain (Table 3A). Per1 expression was higher in CAST mice than B6 mice, by an average of 25% across all times (Figure 2J). Per1 expression in PVN was also modulated by time (Table 3A). Highest Per1 mRNA levels occurred around 13:00 in CAST mice and 16:00 in B6 mice, although ANOVA did not yield a significant strain × time of day interaction (F5,36 = 1.18, P = 0.339).
The intensity of the Per1 mRNA signal in the SCN varied with time of day (Table 3A, Figure 3). Circadian rhythms of Per1 expression were apparent in the SCN of both strains. Per1 mRNA was maximal from 07:00-10:00 (i.e., mid-portion of the previous light phase) and lowest from 16:00 to 19:00 (i.e., mid-portion of the previous dark phase), irrespective of strain. There was a trend toward an effect of strain and strain × time interaction (Table 3A). The trend toward lower expression level in the SCN of CAST mice relative to B6 mice at 7:00 and 10:00 was not associated with any strain difference in the timing of minimal or maximal Per1 expression. These data demonstrate clearly that the SCN circadian clock of CAST mice is generally in phase with that of B6 mice. The early runner phenotype is apparent in the cerebral cortex but not in the SCN itself.
Figure 3.

Similar patterns of Per1 expression in the SCN of CAST and B6 mice. LEFT (A-L): Photomicrographs showing representative Per1 mRNA signal in the SCN of the two strains (B6, upper panels; CAST, lower panels) at various times of day, as indicated. RIGHT (M): The daily profiles of Per1 mRNA levels in the SCN of B6 (open circles and solid lines) and CAST (filled squares and dashed lines) mice (N = 4 per group). Lighting schedule (lights-on from 4:00 to 16:00, local time) of the prior LD cycle is indicated by the gray and black bars at the top of each panel. Scale bar = 500 μm.
Per2 mRNA rhythms are affected by strain in both SCN and extra-SCN brain regions.
Per2 expression in the cerebral cortex (Figure 4A–E) was significantly affected by strain, time, and strain × time interaction (Table 3A). Per2 expression was higher in the cerebral cortex of CAST mice relative to B6 mice by an average of 45% across all times and was significantly higher in the cerebral cortex of CAST mice relative to B6 mice at 16:00. This difference was due to a difference between the strains in the timing of peak Per2 expression in the cerebral cortex (Figure 4A–E): Per2 expression peaked at 16:00 in CAST mice and 19:00 in B6 mice.
Figure 4.

Differential effects of strain (CAST vs. B6) on Per2 expression in extra-SCN brain regions. LEFT: Photomicrographs showing representative Per2 mRNA expression in the cerebral cortex (A-D), PVN (F-I) and sPVZ (K-N) of B6 (upper panels) and CAST (lower panels) strains. RIGHT: Daily profiles of Per2 mRNA levels in the cortex (E), PVN (J) and sPVZ(O) of B6 (open circles and solid lines) and CAST (filled squares and dashed lines) mice (N = 4 per group). Lighting schedule (lights-on from 4:00 to 16:00, local time) of the prior LD cycle is indicated by the gray and black bars at the top of each panel. *Significantly different from B6 at the same time point (P < 0.05, Student's t with Bonferroni correction). In all panels, scale bar = 500 μm.
Per2 expression exhibited circadian rhythmicity in the sPVZ (Table 3A, Figure 4K–O) and PVN (Table 3A, Figure 4F–J) of the hypothalamus. There was no significant main effect of strain on Per2 expression in either the sPVZ or PVN (both P > 0.50). Per2 expression peaked at 13:00-16:00 in the sPVZ of both strains. Although peak Per2 expression appeared to occur at different times in the PVN of CAST mice (around 16:00) and B6 mice (around 19:00), there was not a statistically significant strain × time interaction in ANOVA (F5,36 = 1.79, P = 0.139).
Per2 expression in the SCN was significantly affected by time (Table 3A) but not strain (P = 0.899). In both strains, daily peak Per2 expression in the SCN occurred at 13:00 and daily minimal Per2 expression occurred at 1:00 (Figure 5). There was, however, a significant strain × circadian phase interaction (Table 3A), which was manifest as a more precipitous decline in Per2 expression in CAST mice relative to B6 mice after peak expression: Per2 hybridization signal was significantly lower in the CAST SCN than the B6 SCN at 16:00.
Figure 5.

Similar patterns of Per2 expression in the SCN of CAST and B6 mice. LEFT (A-L): Photomicrographs showing representative Per2 mRNA signal in the SCN of the two strains (B6, upper panels; CAST, lower panels) at various times of day. RIGHT (M): Daily profiles of Per2 mRNA levels in the SCN of B6 (open circles and solid lines) and CAST (filled squares and dashed lines) mice (N = 4 per group). Lighting schedule (lights-on at 4:00 and lights-off at 16:00, local time) of the prior LD cycle is indicated by the gray and black bars at the top of each panel. *Significantly different from B6 at the same time point (P < 0.05, Student's t with Bonferroni correction). Scale bar = 500 μm.
Light-induced expression of Per1 and Per2 in the SCN exhibits very similar phase dependence patterns in CAST and B6 mice
Per1 expression in the SCN was compared between mice euthanized at the end of 30-min light exposure starting at 10:00, 13:00, 16:00, or 19:00 (corresponding to ZT 6, 9, 12, or 15 of the prior LD cycles) and mice euthanized in darkness at these times. ANOVA indicated significant main effects of light, time of day, and light × time interaction (Table 3B). Light exposure resulted in up-regulation of Per1 expression in the SCN in a time-dependent manner (Figure 6): Per1 transcript level was significantly elevated in the SCN of light-exposed CAST mice relative to time of day controls at 16:00 and 19:00, and in the SCN of light-exposed B6 mice relative to time of day controls at 19:00. Time-dependent induction of Per1 in the SCN by light was not significantly modulated by strain (strain × time × light interaction: F3,40 = 0.79, P = 0.769).
Figure 6.
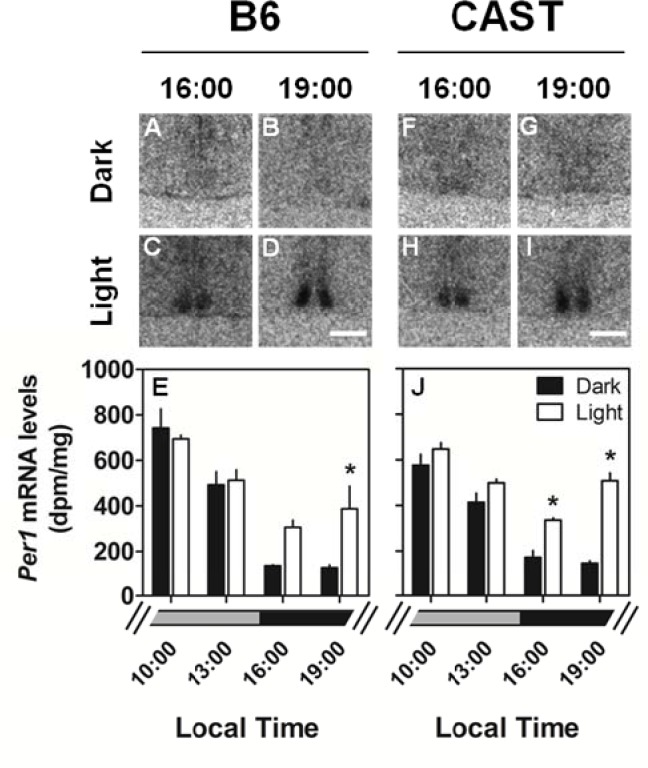
Similar Light-induction of Per1 expression in the SCN of B6 and CAST mice. TOP: Photomicrographs showing representative Per1 mRNA signal in the SCN of B6 (A-D) and CAST (F-I) mice euthanized either during exposure to darkness at the times indicated or after 30-min of light exposure beginning at the times indicated. BOTTOM: Quantitation of Per1 mRNA levels in the SCN of B6 (E) and CAST (J) euthanized as time of day controls in the dark (black bars; N = 4 per group) or after light exposure (white bars; N = 3 per group). The lighting conditions at these times under the prior LD cycle are indicated by the broken gray (light) and black (dark) bars at the bottom. *Significantly different from dark control (P < 0.05, Student's t with Bonferroni correction). Scale bar = 500 μm.
SCN Per2 expression was also affected by light. ANOVA yielded significant light × time interaction for Per2 expression in the SCN (Figure 7, Table 3B). A general trend of increased Per2 mRNA levels was observed during time analogous to the dark phase of prior LD cycles in both B6 and CAST mice. The effect of light reached statistical significance at 19:00 in CAST mice. However, the phase-dependence of light-induced Per2 expression was not modulated by strain (P > 0.200). These data demonstrate phase-dependence of light-induced Per1 and Per2 expression in the SCN but fail to demonstrate any effect of strain background on this circadian clock property.
Figure 7.
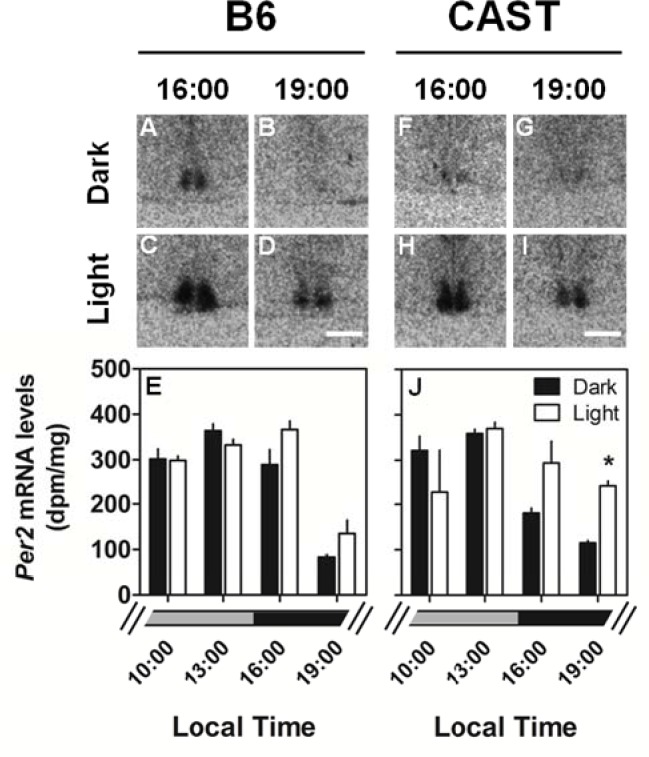
Similar patterns of light-induced Per2 expression in the SCN of B6 and CAST mice. TOP: Photomicrographs showing representative light induction of Per2 in the SCN of B6 (A-D) and CAST (F-I) mice euthanized either during exposure to darkness at the times indicated or after 30-min of light exposure beginning at the times indicated. BOTTOM: Quantitation of Per2 mRNA levels in the SCN of B6 (E) and CAST (J) euthanized as time of day controls in the dark (black bars; N = 4 per group) or after light exposure (white bars; N = 3 per group). The lighting conditions at these times under the prior LD cycle are indicated by the broken gray (light) and black (dark) bars at the bottom. *Significantly different from dark control (P < 0.05, Student's t with Bonferroni correction). Scale bar = 500 μm.
DISCUSSION
Although both exhibit robust circadian rhythms in wheel-running under LD and retain the original rhythmicity after release into constant darkness, CAST and B6 mice differ in a number of circadian phenotypes.9,10 These circadian phenotypes include an advanced wheel-running activity rhythm, a slightly shorter endogenous period, altered timing of light-induced phase-shifting responses, and blunted light-masking in CAST mice relative to B6. Comparisons of the circadian clock properties of these strains and genetic analyses of the circadian phenotypes of the intercross offspring of the strains may offer insights into the neurobiological basis for the well-known differences in circadian chronotype across human populations. We report here that additional measures of circadian rhythmicity differ dramatically between the CAST and B6 strains. The major daily waking bout occurs approximately 4 h earlier in CAST mice than in B6 mice in entrained (LD12:12) conditions, suggesting that the phase advance in activity rhythms previously observed in CAST mice is not related to the presence of the running wheel. This difference in behavioral rhythms is accompanied by differences in the expression of circadian clock-genes: Per1 andPer2 mRNA levels are elevated in the cerebral cortex of CAST mice relative to B6 mice in the hours before dark onset, when CAST mice spend the majority of time awake and B6 mice spend the majority of time asleep. The very robust strain differences in circadian behavior and the patterns of cortical Per expression contrast sharply with the relative lack of strain differences inPer1 and Per2 expression in the SCN, in which circadian rhythms of endogenous expression and photic induction were largely similar between CAST and B6 mice. Although a trend toward lower Per1 expression during the first several hours of the day (7:00-10:00) and a more steep decline of Per2 mRNA levels at 16:00 were apparent in the SCN of CAST mice, the timing of peak SCN Per1 and Per2 expression (that presumably helps determine clock time) was not different between strains. Thus, these fundamental properties of the SCN circadian clock are only affected by strain to a small extent, and are unlikely to underlie the differences between B6 and CAST in the timing of activity/rest and sleep/wake. Inasmuch as Per1 and Per2 mRNAs serve as markers for SCN circadian clock function, timing in the SCN clock itself appears to be quite similar, if not identical, between the two strains. Therefore, the early runner phenotype that we have described in CAST mice, and in many offspring from CAST × B6, is not a phenotype of the SCN, but rather appears to reflect differences in circadian mechanisms downstream of, rather than within, the master circadian pacemaker.
The upregulation of SCN Per1 and Per2 mRNA levels as a consequence of light exposure is a circadian phase-dependent phenomenon (as shown here and elsewhere16). In the current study, we also observed subtle differences between B6 and CAST in the times at which the effect of light on Per expression reached statistical significance, despite a general trend of increase at times (16:00 and 19:00) analogous to the dark phase of prior LD cycles. The lack of statistical significance at a certain time-point may reflect reduced statistical power following Bonferroni corrections; or, it may be due to the fact that light-exposed mice were euthanized 30 min later than mice kept in dark and thus there might be a reduction in the magnitude of light-induced increases in Per expression at 16:00 and 19:00 for both strains in the SCN. Nonetheless, the essentially similar pattern of light-induced Per gene expression in the CAST and B6 mice indicates that the clock resetting mechanisms, including light-input pathways and circadian gating, do not differ between CAST and B6 mice, and therefore cannot explain the circadian behavioral difference between the two strains.
Since the SCN clock oscillates at an equivalent phase and gates light-responsive gene expression in a similar manner in CAST and B6 mice, the mechanism responsible for the advanced phase of behavioral rhythms in CAST mice is likely to be mediated by some other mechanism(s), such as neural circuits downstream of the SCN in circadian regulatory pathways. As a first step in identifying the relevant loci, we measured rhythmic expression of Per1 and Per2 in other brain regions, e.g., the sPVZ, PVN, and cerebral cortex. The sPVZ, similar to the SCN, did not exhibit strain differences in the 24-h profiles of Per gene expression. Perhaps this is not surprising in view of the fact that the sPVZ receives heavy SCN input and innervates essentially the same areas as the SCN.17,18 In contrast to the sPVZ and SCN, the cortex exhibited strain differences in the 24-h profiles of Per gene expression in which those of the CAST mice showed earlier peaks. Because daily rhythms in sleep-wakefulness are associated with prominent changes in the electrical activity rhythms of cortex, the strain-associated changes in the temporal patterns of clock gene expression are correlated with changes in temporal patterns of functional activity. Lastly, the PVN receives both direct and indirect projections from the SCN,19–21 and is part of the neural pathways that regulate endocrine rhythms, including the circadian secretion of corticosterone22–24 and melatonin.22,25 The daily highest levels of Per1 and Per2 mRNA in the PVN also appeared to occur at earlier times in the CAST mice than B6, although strain × time of day interaction was not significant as determined by ANOVA. The lack of statistical significance may be related to the fact that the PVN is a heterogeneous brain structure and we measured Per expression in the PVN as a whole.
The cortex and PVN may or may not be the anatomic loci directly responsible for the difference between B6 and CAST mice in their behavioral circadian phase alignment. It is possible that Per expression in extra-SCN regions is driven by behavioral states (e.g., sleep/wake and activity/rest) and/or resulting metabolic and physiological changes. Indeed, the phase-advanced rhythms of Per1 and Per2 mRNA levels in the cerebral cortex of CAST mice relative to B6 mice are not necessarily a measure of circadian oscillator function within the cerebral cortex, but may be driven more by sleep and wake. Per gene expression in the cerebral cortex is regulated, at least in part, by sleep/wake cycles and is elevated during protracted wakefulness.26–30 This observation is compatible with a role for these genes in the homeostatic regulation of sleep, as are the many homeostatic sleep alterations in mice with deficient or altered clock gene expression.26,31,32 The difference in the phase of Per1 and Per2 mRNA oscillations in the cerebral cortex of CAST and B6 mice, therefore, may drive or be driven by the sleep/wake cycle.
Regardless of the mechanism that underlies the strain differences we describe here, our observations demonstrate that a circadian abnormality identified at the behavioral level in LD cycle-entrained mice is not necessarily indicative of an abnormality or difference in the function of the SCN circadian clock or its photic inputs. The CAST-B6 genetic model may be utilized at both genetic and molecular/biochemical levels to identify circadian mechanisms downstream of the SCN oscillator that regulate behavioral rhythms. Such downstream mechanisms are poorly understood at present. The identification of the mechanism by which the cycling of a normally entrained oscillator is transduced into an early onset of sleep/wake and wheel running rhythms in CAST mice may also reveal novel targets for interventions to improve circadian alignment in shift-workers, jet lag, and advanced or delayed sleep phase syndromes.
DISCLOSURE STATEMENT
This was not an industry supported study. Dr O'Hara is the co-founder and partial owner of Signal solutions, LLC which involves technology development and sales of sleep-related equipment. The other authors have indicated no financial conflicts of interest.
ACKNOWLEDGMENTS
This work was supported by grants from the NIH – R01 MH067752 and DoD, AFOSR, FA9550-05-1-0464 (to Dr. O'Hara), and NIH grant, R01 AG13418 (to Dr. Duncan). Work for this study was performed at Washington State University (sleep recording and tissue collections) and University of Kentucky (measurement of gene expression).
ABBREVIATIONS
- B6
C57B/6J
- CAST
CAST/EiJ
- QTL
quantitative trait locus
- PVN
paraventricular nucleus of the hypothalamus
- SCN
suprachiasmatic nucleus
- sPVZ
subparaventricular zone
- ZT
zeitgeber time
REFERENCES
- 1.Takahashi JS, Hong H-K, Ko CH, McDearmon EL. The genetics of mammalian circadian order and disorder: implications for physiology and disease. Nat Rev Genet. 2008;9:764–75. doi: 10.1038/nrg2430. [DOI] [PMC free article] [PubMed] [Google Scholar]
- 2.Lowrey PL, Shimomura K, Antoch MP, et al. Positional syntenic cloning and functional characterization of the mammalian circadian mutation tau. Science. 2000;288:483–91. doi: 10.1126/science.288.5465.483. [DOI] [PMC free article] [PubMed] [Google Scholar]
- 3.van der Horst GTJ, Muijtjens M, Kobayashi K, et al. Mammalian Cry1 and Cry2 are essential for maintenance of circadian rhythms. Nature. 1999;398:627–30. doi: 10.1038/19323. [DOI] [PubMed] [Google Scholar]
- 4.Zheng B, Albrecht U, Kaasik K, et al. Nonredundant roles of the mPer1 and mPer2 genes in the mammalian circadian clock. Cell. 2001;105:683–94. doi: 10.1016/s0092-8674(01)00380-4. [DOI] [PubMed] [Google Scholar]
- 5.Jones CR, Campbell SS, Zone SE, et al. Familial advanced sleep-phase syndrome: A short-period circadian rhythm variant in humans. Nat Med. 1999;5:1062–5. doi: 10.1038/12502. [DOI] [PubMed] [Google Scholar]
- 6.Toh KL, Jones CR, He Y, et al. An hPer2 phosphorylation site mutation in familial advanced sleep phase syndrome. Science. 2001;291:1040–3. doi: 10.1126/science.1057499. [DOI] [PubMed] [Google Scholar]
- 7.Xu Y, Padiath QS, Shapiro RE, et al. Functional consequences of a CKIdelta mutation causing familial advanced sleep phase syndrome. Nature. 2005;434:640–4. doi: 10.1038/nature03453. [DOI] [PubMed] [Google Scholar]
- 8.Roenneberg T, Kuehnle T, Juda M, et al. Epidemiology of the human circadian clock. Sleep Med Rev. 2007;11:429–38. doi: 10.1016/j.smrv.2007.07.005. [DOI] [PubMed] [Google Scholar]
- 9.Wisor JP, Striz M, DeVoss J, Murphy GM, Jr., Edgar DM, O'Hara BF. A novel quantitative trait locus on mouse chromosome 18, “era1,” modifies the entrainment of circadian rhythms. Sleep. 2007;30:1255–63. doi: 10.1093/sleep/30.10.1255. [DOI] [PMC free article] [PubMed] [Google Scholar]
- 10.Jiang P, Striz M, Wisor JP, O'Hara BF. Behavioral and genetic dissection of a mouse model for advanced sleep phase syndrome. Sleep. 2011;34:39–48. doi: 10.1093/sleep/34.1.39. [DOI] [PMC free article] [PubMed] [Google Scholar]
- 11.Daan S, Pittendrigh CS. J Comp Physiol. 1976. A functional analysis of circadian pacemakers in nocturnal rodents. III. Heavy water and constant light: homeostasis of frequency? p. 106. [Google Scholar]
- 12.Pittendrigh CS, Daan S. A functional analysis of circadian pacemakers in nocturnal rodents. II. The variability of phase response curves. J Comp Physiol. 1976;106:253–66. [Google Scholar]
- 13.Donohue K, Medonza D, Crane E, O'Hara B. Assessment of a non-invasive high-throughput classifier for behaviours associated with sleep and wake in mice. Biomed Eng Online. 2008;7:14. doi: 10.1186/1475-925X-7-14. [DOI] [PMC free article] [PubMed] [Google Scholar]
- 14.Flores AE, Flores JE, Deshpande H, et al. Pattern recognition of sleep in rodents using piezoelectric signals generated by gross body movements. IEEE Trans Biomed Eng. 2007;54:225–33. doi: 10.1109/TBME.2006.886938. [DOI] [PubMed] [Google Scholar]
- 15.Wisor JP, Jiang P, Striz M, O'Hara BF. Effects of ramelteon and triazolam in a mouse genetic model of early morning awakenings. Brain Res. 2009;1296:46–55. doi: 10.1016/j.brainres.2009.07.103. [DOI] [PubMed] [Google Scholar]
- 16.Shearman LP, Zylka MJ, Weaver DR, Kolakowski LF, Jr, Reppert SM. Two period homologs: circadian expression and photic regulation in the suprachiasmatic nuclei. Neuron. 1997;19:1261–9. doi: 10.1016/s0896-6273(00)80417-1. [DOI] [PubMed] [Google Scholar]
- 17.Saper CB, Lu J, Chou TC, Gooley J. The hypothalamic integrator for circadian rhythms. Trends Neurosci. 2005;28:152–7. doi: 10.1016/j.tins.2004.12.009. [DOI] [PubMed] [Google Scholar]
- 18.Saper CB, Scammell TE, Lu J. Hypothalamic regulation of sleep and circadian rhythms. Nature. 2005;437:1257–63. doi: 10.1038/nature04284. [DOI] [PubMed] [Google Scholar]
- 19.Vrang N, Larsen PJ, Moller M, Mikkelsen JD. Topographical organization of the rat suprachiasmatic-paraventriocular projection. J Comp Neurol. 1995;353:585–603. doi: 10.1002/cne.903530409. [DOI] [PubMed] [Google Scholar]
- 20.Vrang N, Larsen PJ, Mikkelsen JD. Direct projection from the suprachiasmatic nucleus to hypophysiotrophic corticotropin-releasing factor immunoreactive cells in the paraventricular nucleus of the hypothalamus demonstrated by means of Phaseolus vulgaris-leucoagglutinin tract tracing. Brain Res. 1995;684:61–9. doi: 10.1016/0006-8993(95)00425-p. [DOI] [PubMed] [Google Scholar]
- 21.Buijs RM, Markman M, Nunes-Cardoso B, Hou Y-X, Shinn S. Projections of the suprachiasmatic nucleus to stress-related areas in the rat hypothalamus: A light and electron microscopic study. J Comp Neurol. 1993;335:42–54. doi: 10.1002/cne.903350104. [DOI] [PubMed] [Google Scholar]
- 22.Buijs R, van Eden C, Goncharuk V, Kalsbeek A. The biological clock tunes the organs of the body: timing by hormones and the autonomic nervous system. J Endocrinol. 2003;177:17–26. doi: 10.1677/joe.0.1770017. [DOI] [PubMed] [Google Scholar]
- 23.Ulrich-Lai YM, Arnhold MM, Engeland WC. Adrenal splanchnic innervation contributes to the diurnal rhythm of plasma corticosterone in rats by modulating adrenal sensitivity to ACTH. Am J Physiol Regul Integr Comp Physiol. 2006;290:R1128–35. doi: 10.1152/ajpregu.00042.2003. [DOI] [PubMed] [Google Scholar]
- 24.Dickmeis T. Glucocorticoids and the circadian clock. J. Endocrinol. 2009;200:3–22. doi: 10.1677/JOE-08-0415. [DOI] [PubMed] [Google Scholar]
- 25.Teclemariam-Mesbah R, Ter Horst GJ, Postema F, Wortel J, Buijs RM. Anatomical demonstration of the suprachiasmatic nucleus-pineal pathway. J Comp Neurol. 1999;406:171–82. [PubMed] [Google Scholar]
- 26.Wisor J, O'Hara B, Terao A, et al. A role for cryptochromes in sleep regulation. BMC Neurosci. 2002;3:20. doi: 10.1186/1471-2202-3-20. [DOI] [PMC free article] [PubMed] [Google Scholar]
- 27.Franken P, Thomason R, Heller HC, O'Hara B. A non-circadian role for clock-genes in sleep homeostasis:a strain comparison. BMC Neurosci. 2007;8:87. doi: 10.1186/1471-2202-8-87. [DOI] [PMC free article] [PubMed] [Google Scholar]
- 28.Wisor JP, Pasumarthi RK, Gerashchenko D, et al. Sleep deprivation effects on circadian clock gene expression in the cerebral cortex parallel electroencephalographic differences among mouse strains. J Neurosci. 2008;28:7193–201. doi: 10.1523/JNEUROSCI.1150-08.2008. [DOI] [PMC free article] [PubMed] [Google Scholar]
- 29.Cirelli C, Gutierrez CM, Tononi G. Extensive and divergent effects of sleep and wakefulness on brain gene expression. Neuron. 2004;41:35–43. doi: 10.1016/s0896-6273(03)00814-6. [DOI] [PubMed] [Google Scholar]
- 30.Liu L, Jiang P, Franklin KM, et al. Per1 and Per2 expression in the forebrain of SCN lesioned and intact mice in response to sleep deprivation. 20th Anniversary Meeting, Society for Reserach on Biological Rhythms 2008:; Destin, FL. Abstract 242-3. [Google Scholar]
- 31.O'Hara BF, Ding J, Bernat RL, Franken P. Genomic and proteomic approaches towards an understanding of sleep. CNS Neurol Disord Drug Targets. 2007;6:71–81. doi: 10.2174/187152707779940745. [DOI] [PubMed] [Google Scholar]
- 32.Naylor E, Bergmann BM, Krauski K, et al. The circadian clock mutation alters sleep homeostasis in the mouse. J Neurosci. 2000;20:8138–43. doi: 10.1523/JNEUROSCI.20-21-08138.2000. [DOI] [PMC free article] [PubMed] [Google Scholar]