

Abstract
We introduce an approach based on the recently introduced functional mode analysis to identify collective modes of internal dynamics that maximally correlate to an external order parameter of functional interest. Input structural data can be either experimentally determined structure ensembles or simulated ensembles, such as molecular dynamics trajectories. Partial least-squares regression is shown to yield a robust solution to the multidimensional optimization problem, with a minimal and controllable risk of overfitting, as shown by extensive cross-validation. Several examples illustrate that the partial least-squares-based functional mode analysis successfully reveals the collective dynamics underlying the fluctuations in selected functional order parameters. Applications to T4 lysozyme, the Trp-cage, the aquaporin channels Aqy1 and hAQP1, and the CLC-ec1 chloride antiporter are presented in which the active site geometry, the hydrophobic solvent-accessible surface, channel gating dynamics, water permeability (pf), and a dihedral angle are defined as functional order parameters. The Aqy1 case reveals a gating mechanism that connects the inner channel gating residues with the protein surface, thereby providing an explanation of how the membrane may affect the channel. hAQP1 shows how the pf correlates with structural changes around the aromatic/arginine region of the pore. The CLC-ec1 application shows how local motions of the gating Glu148 couple to a collective motion that affects ion affinity in the pore.
Introduction
Protein function frequently requires dynamics. Ranging from transporters to enzymes, from motors to signaling proteins, conformational transitions are usually at the heart of protein function. Consequently, a key step in understanding protein function is detailed knowledge of the underlying dynamics. Molecular dynamics (MD) simulations and related techniques are routinely used to study the dynamics of biomolecular systems at atomic detail at timescales of typically nanoseconds to microseconds. Although in principle allowing us to directly address function-dynamics relationships, such analyses are frequently hampered by the large dimensionality of a protein’s configuration space, rendering it nontrivial to identify collective modes of motion that are directly related to a functional property of interest.
Principal component analysis (PCA) is a powerful tool to effectively reduce the dimensionality of a protein’s configuration space (1,2). Diagonalization of the variance-covariance matrix yields a large number of eigenvectors with near-zero eigenvalues, corresponding to modes with only a minor contribution to the overall dynamics, leaving a relatively small percentage of principal modes that contribute to the vast majority of overall fluctuation. Even though PCA frequently aids a structural or functional interpretation enormously, it is not primarily designed for that purpose. PCA sorts the collective modes (eigenvectors) according to their contribution (eigenvalue) to the total mean-square fluctuation. Hence, the eigenvectors corresponding to the largest eigenvalues are defined as principal modes by virtue of the size of their fluctuation, irrespective of the actual contribution to a functional property of interest. Some functional properties may be influenced by the principal modes, but only in a specific combination, thereby further obscuring the relation between dynamics and function.
The PCA-based functional mode analysis (FMA) aims to overcome this problem by taking a linear combination of principal modes that is maximally correlated to a defined functional property of interest (3). FMA yields a linear model for a unidimensional functional property f(t) (subsequently denoted as vector f to indicate that it is applicable to any ensemble, not only to time series). The correlation between the model and f, particularly the correlation for a cross-validation subset of the data that was not used to train the model, provides a measure for the goodness of fit or the predictive power of the linear relation between coordinates (dynamics) and function. The linear model, also termed maximally correlated mode (MCM), can be expressed in terms of the original (Cartesian) coordinates and visualized as a collective mode of motion, either directly or in an ensemble-weighted fashion (ewMCM for ensemble-weighted MCM), to yield a direct visualization of the dynamics underlying fluctuations in f.
In its original implementation, FMA uses the principal modes provided by PCA as a basis for the correlation optimization. It therefore takes advantage of the dimensionality reduction provided by PCA, rendering it unnecessary to carry out the correlation optimization in the full coordinate space, which could easily lead to an overfitting issue due to the large number of parameters involved. However, this rests on the assumption that fluctuations in f are predominantly influenced by the principal modes, which may or may not be the case. Indeed, a number of FMA applications require a relatively high-dimensional PCA basis (3), indicating that not only principal modes contribute. Working with such a high-dimensional basis suffers from an inherent overfitting risk, and suggests that PCA does not offer an optimal basis in such cases.
Here, we present a generalization of an FMA-based partial least-squares (PLS) algorithm, which overcomes this issue by simultaneously optimizing model and basis. PLS-based FMA therefore yields a model with the lowest possible basis dimensionality that provides optimal correlation between fluctuations in f and protein dynamics. In other words, the objective of the PLS algorithm is to get a relation (in this implementation, a linear combination of coordinates) that correlates the best with f, but, at the same time, one that allows us to identify the dynamics information in the input coordinates that contribute the most to the fluctuation in f. Applications to the active-site geometry of T4 lysozyme and solvent-accessible surface of the Trp-cage illustrate that a very specific combination of atomic fluctuations of the backbone atoms contributes to f. Furthermore, FMA based on PLS requires a significantly smaller basis than PCA-based FMA. Due to the minimal dimensionality employed, the overfitting risk is minimized, leading to an optimal predictive power, as observed in cross-validation experiments. Furthermore, complex applications to the gating of aquaporin water channels, and to a CLC antiporter illustrate the use of PLS as a general and robust method to study function-dynamics relationships in proteins.
Theory
The partial least-squares algorithm
A multiple linear least-squares regression of the type f = Xβ + ϵ, with f a vector containing n samples of the unidimensional functional property to be described in terms of a n × p matrix X of p Cartesian coordinates, yields a set of p-dimensional coefficients β with residuals ϵ. Minimizing the sum of squared elements of ϵ optimizes the correlation between f and the linear model Xβ. In practice, such a regression can yield poor results (particularly in prediction) if some of the columns of X are nearly dependent (or co-linear in statistical terms).
In PCA-based FMA, rather than the original coordinates X, the principal coordinates P = XU (with U as eigenvectors of Xt X, where Xt denotes the transpose of X) are used instead, with the advantage that generally a smaller number of principal components m ≪ p can be chosen for P, leading to a more stable fit, where the choice of m is data driven.
In PLS (4–6), k new regressors Tk are defined iteratively such that each coordinate is a linear combination of the original coordinates X (Tk = XWk) with maximal covariance with f, while being uncorrelated to each previous coordinate in Tk (7). Subsequently, the regression problem f = XWkαk + ϵ is solved using XWk as basis. This has as an advantage that both the variance in f and X as well as the correlation between f and X is taken into account, and therefore a basis Wk is generated such that by construction it includes only components of X that are correlated to f and have sufficient variance to contribute to f. In contrast, in the PCA-based FMA the basis is selected only according to variance in X.
Therefore, PLS combines the advantage of PCA-based FMA with the requirement of correlation to f, thereby yielding another substantial dimension reduction (k ≤ m) and offering a robust fit as well, if the number of independent observations is small relative to the size of the molecular system p. A priori, it is not possible to estimate a proper choice for k. In fact, k serves as a regularization parameter, which has to be chosen appropriately to maximize the predictive power, similar to m in PCA-based FMA. In practice, the optimal choice is derived from cross-validation by varying k systematically until the highest correlation is obtained between f and XWkαk for an independent subset of f. An algorithm of Helland (8) as implemented by Denham (7) was used for the applications shown here. In this article, this idea will be extended to an ensemble-weighted model, analogous to the ewMCM in PCA-based FMA (3). The ensemble-weighted model can be constructed from the PLS output by first converting Wk to an orthogonal basis by diagonalization of Tk and subsequently applying Eq. 12 from Hub and de Groot (3) to obtain the weights of the ewMCM. Alternatively, the ewMCM can be obtained as the scaled first column of Wk.
Implementation
The PLS-based FMA has been implemented based on Helland’s algorithm (8) as provided by Denham (7) and is available from the authors. Explicit details about the algorithm implementation can be found in the Supporting Material. Our implementation of the analysis tool takes coordinate trajectories in the GROMACS (9) XTC format, as input together with f, in a generic ASCII format displaying two columns: one column for the frame/structure identifiers, with the second column for the functional property of interest associated with the structure. Input coordinates should be fitted (i.e., least-squares) to a reference frame before analysis to filter out overall translation and rotation. The tool uses a preselected part of the trajectory for model building, therefore automatically allowing us to use the remaining part for cross-validation. Typical computational times for ∼1000 frames of a protein of 200 amino acids (protein atoms excluding hydrogens) are in the range of a few minutes.
Results
T4 lysozyme
T4 lysozyme (T4L) is an enzyme from the bacteriophage T4 that catalyzes the hydrolysis of 1,4-β-linkages in peptidoglycans and chitodextrins from bacterial cell walls. A prerequisite for catalysis is the correct orientation of the active site residues E11 and D20 with respect to the substrate (10). We used the distance between the Cδ of Glu11 and the Cγ of Asp20 (dED) as the functional order parameter f (Fig. 1 A). All backbone atoms of the protein were used as the coordinate set. Of an MD trajectory with a length of 460 ns, we used the first-half for model building and the second-half for cross-validation. A comparison of the results of the PLS algorithm to the PCA-based FMA is shown in Fig. 1, B–G. Correlation coefficients between model and data are shown in Fig. 1, B and C, for the model building (Rm) and cross-validation (Rc) parts as a function of the number of components in the case of PLS and the number of PCA eigenvectors in the case of PCA-based FMA. The Rm measurements for both PLS- and PCA-based FMA converge for fewer than 10 components/eigenvectors, with the PLS-based variant converging to a value closer to 1. The cross-validation Rc shows that PLS-based FMA converges at ∼10 components whereas the PCA-based FMA requires a larger basis, of ∼20 PCA eigenvectors.
Figure 1.
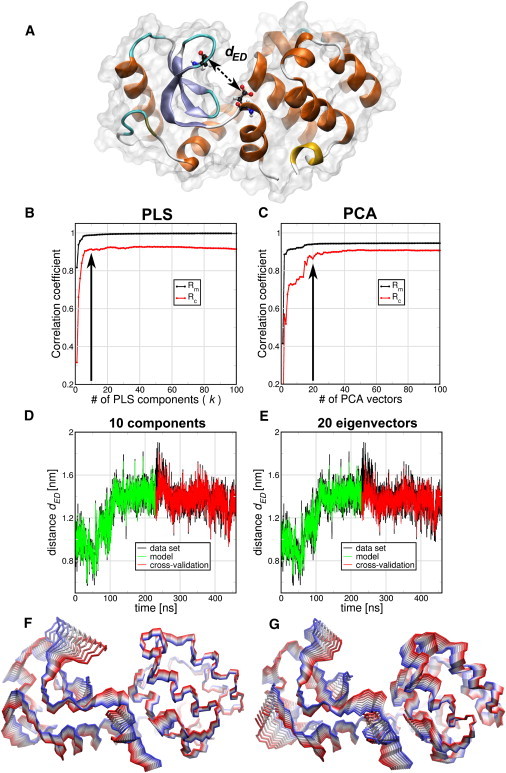
Comparison of PLS- and PCA-based FMA methods for Glu11-Asp20 distance dED (A) of T4 Lysozyme (T4L). (B and C) Pearson correlation coefficients between data and model for PLS- and PCA-based FMA as function of the number of PLS components or PCA vectors calculated for the model training subset (Rm) and the cross-validation subset (Rc). (D and E) (Overlay) Data and model for the calculated distances dED as function of time corresponding to the MD data, the training, and the model cross-validation subset. The models were calculated using 10 components for PLS-based FMA (D) and 20 PCA eigenvectors for PCA-based FMA (E). (F and G) Backbone representation of the ensemble-weighted MCM (ewMCM) contributing to the change in the distance dED. (Overlayed structures) Interpolation between the extremes of the ewMCMs. The PLS- and PCA-based FMA models used to plot the molecular representations have the same number of components or PCA vectors as the panels D and E.
In Fig. 1, D and E, the overlayed MD and the PLS/PCA-based FMA model data are shown for both the model building and cross-validation parts, using a basis of dimensionality of 10 and 20 for PLS- and PCA-based FMA, respectively. These graphs show that both PLS- and PCA-based FMA provide an adequate model that covers the general features of the fluctuations in dED. The ewMCM molecular representations of these models are shown in Fig. 1, F and G. It is observed that, in general terms, the motions described by both models are similar, especially around the E11 and D20 amino acids.
For the PLS-based FMA we also tested if the 10 components model was accurate enough to predict the dED distance of an x-ray set of 38 T4L structures. We observe (see Fig. S1 A in the Supporting Material) that the PLS model gives an Rc of 0.93 for these experimental structures. Then we used the T4L x-ray structures as the model building set and the MD frames as the cross-validation set. As can be seen in Fig. S1 B, this small experimental ensemble is also able to predict correctly the MD ensemble with only four components. It was also tested how the reference structure (the one used for least-squares fitting the trajectory) can influence the Rm and Rc. Using reference structures with dED of 0.76, 1.01 (the one used above), and 1.24 nm showed no influence on the model quality (see Fig. S1, C and D).
Robustness
To test the consistency and robustness of the PLS- and PCA-based FMA models and the influence of the basis dimensionality, we sliced the T4L data into four equally sized parts. For each part, we built a FMA model and calculated scalar products between the MCM and ewMCM from each part (Fig. 2, A and B). In addition, cross-validation was carried out using the three parts that were not used for model building (Fig. 2, C and D). Two model dimensionalities with cross-validation correlation coefficients (Rc) of ∼0.9 were chosen for the scalar product analysis. For PLS-based FMA, we chose dimensionalities 5 and 10, whereas for PCA-based FMA we chose dimensionalities 20 and 25. In Fig. 2, A and B, we plotted the distance dED to guide the eye to the part of the trajectory used for model building. The middle and lower panels show the MCM and ewMCM scalar product matrix in a gray-scale way for both PLS- and PCA-based FMA.
Figure 2.
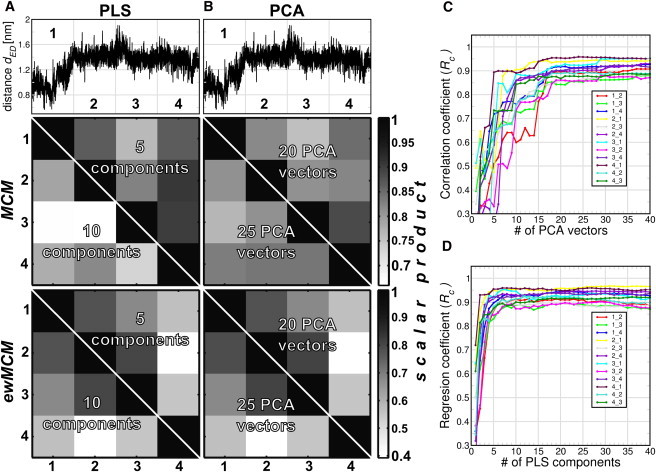
Scalar product analysis of PLS- and PCA-based FMA MCM and ewMCM models derived from different trajectory parts applied to the distance dED of T4 Lysozyme. (A and B) (Upper panels) T4L distance dED as function of time. The x axis is divided in four equally spaced subtrajectories. (Mid and lower panels) Scale-coded matrices of the scalar products of MCM and ewMCM vectors, respectively. Each (ew)MCM vector was calculated using one fourth of the T4L trajectory (as indicated in the upper panel). All the scalar product combinations were calculated for 5 and 10 components for PLS-based FMA, and 20 and 25 eigenvectors in the case of PCA-based FMA. Panels C and D show cross-validation correlation coefficients Rc as a function of the basis dimensionality. The indices of the form i,j mean that the model was constructed for fragment i and cross-validated with fragment j.
In general, it is observed that the overlap between the different parts is remarkably high, particularly for the MCM. Note that the FMA modes of the T4L backbone span a 1476-dimensional space (164 residues × 3 backbone atoms per residue × 3 spatial dimensions). The scalar product for two random, normalized vectors of that dimension follows a Gaussian distribution with mean zero and a standard deviation of 0.026. Therefore, the probability of a scalar product of 0.5 or larger for two such random vectors is vanishingly small, at an estimated 10−82. The observed scalar products therefore represent significant and substantial overlap, indicative of a robust model. The scatter in the ewMCM is by nature higher than in the MCM, as the ensemble weighting of the ewMCM introduces additional uncertainty due to nonconverged variances in MD caused by incomplete sampling.
The overlap is found to be lower for a higher basis dimensionality for both PCA- and PLS-based FMA (only the ewMCM is basis-independent in the case of PLS-based FMA). This indicates that a model with the lowest dimensionality that shows adequate predictive power in cross-validation should be chosen for maximal model robustness. It is interesting to note that the cross-validation correlation coefficient Rc provides a qualitative measure of MCM robustness: as can be seen in Fig. 2, trajectory parts that yield more similar models (high scalar products) also display a larger Rc when one part is used for model training and the other for validation. This renders Rc a useful measure not only of predictive power but also of model robustness.
As an example of a highly nonlinear functional property f, we analyzed unfolding trajectories of the Trp-cage peptide (11) in terms of the hydrophobic solvent-accessible surface. The results are shown in the Supporting Material and Fig. S2. Surprisingly also for this nonlinear case, an acceptable quality model is obtained with PLS-based FMA requiring a substantially lower dimensional basis than the PCA-based FMA.
Gating of aquaporin channels
Yeast aquaporin: Aqy1
Aqy1 is a tetrameric water channel of the yeast Pichia pastoris. The high-resolution structure revealed a closed channel, whereas functional studies indicated water channel activity (12). Together, these results therefore suggest that Aqy1 is a gated channel. Indeed, MD simulations showed that channel opening can be reproducibly induced in response to phosphorylation of Ser107 and by an increase of membrane pressure (mechanosensitivity) (12). By iterative, manual inspection of the trajectories, it was noted that the signal was predominantly located in loop D and the lower parts of helices 4–6. A PCA of only this region indeed identified a collective mode that correlated with channel opening events.
Here, we address whether this collective mode can be detected in an unbiased manner by using FMA, and we tested both the PCA and PLS variants. For this study, we took an MD simulation of 100-ns length of the S107D mutant of Aqpy1 and a simulation in which a lateral pressure of 10 bar in the membrane plane was applied. We used the distance between Ala190 and the center of mass of residues Pro29 and Tyr104 as f, a measure of the degree of channel opening of Aqy1 (Fig. 3 A). For the FMA analysis we consider all the backbone atoms of each monomer and used the data of the S107D trajectory as the model training set and the lateral pressure simulation for cross-validation. In addition, we used a smaller and independent cross-validation set (30 ns) of an Aqy1 simulation where the membrane was bent toward the cytoplasmic side of the protein; opening events were observed.
Figure 3.
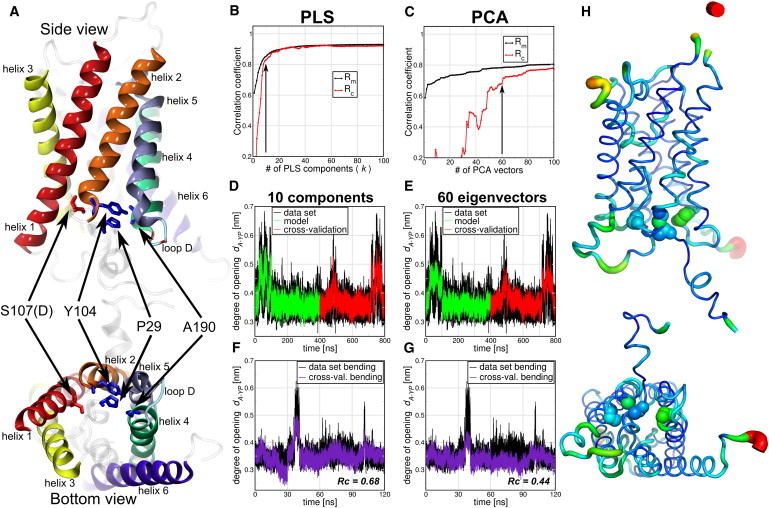
Comparison of PLS- and PCA-based FMA for the degree of channel opening of yeast Aquaporin (Aqy1). (A) The degree of opening was defined as the distance between Ala190 and the center of mass of residues Pro29 and Tyr104. Each monomer was considered an independent channel and therefore the four monomer trajectories were concatenated. The 100-ns simulation of the S107D mutant used for model training, therefore, represents the first 400 ns of the concatenated trajectory, and the applied lateral pressure simulations the time window from 400–800 ns. (B and C) Pearson correlation coefficients between data and model for PLS/PCA-based FMA as a function of the number of PLS components/PCA vectors calculated for the model training (Rm) and the cross-validation subset (Rc). (D and E) (Overlay) Data and model for the calculated channel opening distance as function of time corresponding to the MD data, the model training, and the cross-validation subset. (F and G) One-hundred-twenty nanoseconds of a membrane-bending simulation were used as an extra cross-validation set. The models were calculated using 10 components for PLS (D) and 60 PCA vectors for PCA-based FMA (E). (H) (Side and bottom view, backbone representations) PLS-based FMA ewMCM contributing to the change in the channel gating distance. (Line thickness) Root-mean-square fluctuation (RMSF) of the ewMCMs. (Spheres) S107, Y104, P29, and A190 backbone atoms. The model used for PLS-based FMA ewMCM representations has the same number of components as the model in panel D.
In Fig. 3 we show the comparison between the PLS- and the PCA-based FMA mode for Aqy1. Fig. 3, B and C, shows that the correlation between data and model in terms of both Rm and Rc is higher for the PLS as compared to the PCA-based FMA. The correlation coefficients converge to 0.9 between 10 and 20 components for the PLS-based FMA whereas the PCA-based FMA results do not yet seem to be fully converged at 100 PCA vectors. In Fig. 3, D and E, it can be seen that the channel geometry data are captured adequately for the PLS-based model with 10 components and the PCA-based FMA model with 60 components. The membrane-bending simulations were used as an extra and independent cross-validation set (12). Here (Fig. 3, F and G), we observe a similar trend as before: the PLS shows an acceptable model with Rc = 0.68 whereas PCA-based FMA shows a model with only Rc = 0.44, with PLS requiring a smaller basis than PCA. The ewMCM representation of the PLS-based FMA fluctuations is shown in Fig. 3 H. The PLS- and the PCA-based FMA versions of the ewMCM have a scalar product of 0.99, and show collective motions in the protein. Backbone motions involve primarily loop D and the lower halves of helices 1, 3, 4, and 6, which are coupled to the local opening of the pore. Hence, the ewMCM provides an explanation of how the gating residues (which are not in direct contact with the membrane) are affected by changes in the membrane, induced either by an applied lateral pressure or by membrane bending. The signal seems to be transmitted from helices 1 and 6, which are in direct contact with the membrane to the lower parts of helices 3–5, and loop D, that lines the water pore.
We compared the first PCA eigenvector of the lower parts of helix 4–6 and loop D as described in Fischer et al. (12) with the PLS-based FMA of the full backbone of Aqy1. The scalar product of both modes in this subset of atoms is 0.66, which implies a high degree of similarity of the motions. Together, in this case, these results show that unbiased PLS-based FMA analysis gives similar modes compared with a selective/iterative PCA analysis as described in Fischer et al. (12) (see Fig. S3).
Human aquaporin-1: hAQP1
hAQP1 is a tetrameric water channel ubiquitously expressed in the cell membranes. The x-ray structure of its high-identity bovine homolog (13) shows two constrictions for the water conduction: The NPA signature motif and the aromatic/arginine (the ar/R) site, the latter formed by R195, H180, and F56. Molecular-dynamics simulations showed that channel opening and closing could be induced in response to voltage changes (14) in the range of –1.5 to 1.5 V. Those analyses showed a correlation between the permeability coefficients (pf) and the membrane potential, with the channel more open at positive potentials. It was also reported that the flipping of the R195 side chain is involved in the open-close transitions.
Here, we address whether we can find a global structural model that is able to explain the changes in the functional property pf using PLS-based FMA. For this purpose, we took 22 MD simulations of 60-ns length calculated in a double-membrane setup at ±1.5 V (14). We calculated the single-channel permeabilities pf from the collective diffusion model proposed by Zhu et al. (15) at a single monomer basis. Because pf is a property that does not depend on a single structure, pf values were calculated using the last 50 ns of each trajectory, using 5-ns windows. For the FMA analysis we used the average structures of the monomer atoms (excluding the hydrogens) of the same time windows used for the pf calculation. Because we had eight monomers in total in the double membrane setup, we used six of them for model building and two for cross-validation.
In Fig. 4 A, we show the correlation between data and model in terms of both Rm and Rc for the PLS-based FMA. The correlation coefficients of the training part converged to 0.9 around 30 components. The Rc values converged to 0.6 with the same number of components. Note in Fig. 4 B that the pf signal intrinsically suffers from a low signal/noise ratio. Thus, the favorable correlation in the cross-validation stage is remarkable. An ewMCM representation of the PLS-based FMA fluctuations and extremes is shown in Fig. 4, C and D. In terms of fluctuations, Fig. 4 C shows the ewMCM changes in the loops and in the backbone of the extracellular half of the protein, mainly around R195. The extremes representation of the ewMCM in Fig. 4 D shows displacement of the R195 side chain that changes its distance to H180, as previously suggested from visual inspection (14). In addition, we noted the displacement of N127, F212, I211, and W210, which seem to move in a correlated manner with R195. Interestingly, the R195V mutant in rat AQP1 does not change the water permeability but allows urea, glycerol, ammonia, and protons to pass (16). Similarly, R195S shows proton and cation permeability and a higher osmotic water permeability (17).
Figure 4.
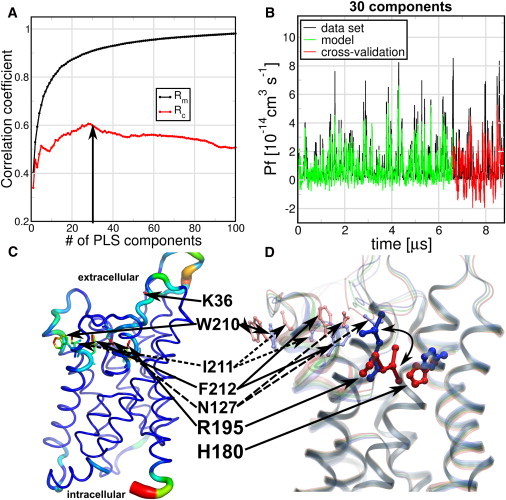
PLS-based FMA for single-channel water permeability (pf) of human Aquaporin 1 (hAQP1) in the presence of a transmembrane voltage. The pf and protein average structures were calculated within 5-ns trajectory windows and each monomer was considered an independent channel. The simulations of six monomers were used for model training, and two independent monomers for cross-validation. (A) Pearson correlation coefficients between data and model for PLS-based FMA as a function of the number of PLS components were calculated for the model training subset (Rm) and the cross-validation subset (Rc). (B) (Overlay) Data and model for the calculated pf values using 30 components (arrow in panel A) as a function of time corresponding to the MD data, the model training, and the cross-validation subset. (C) (Backbone and stick representations) Amino acids in the ewMCM mode contributing to the change in pf. (Thickness of the lines) RMSF of the ewMCM (thicker sticks means amino acids with higher RMSF). (D) (Cartoon and overlay representation) Helices and amino acids contributing to the ewMCM. (Overlayed structures) Conformations, associated with low, intermediate, and high estimated pf values. The side-chain motion of R195 associated with the low and high pf values is highlighted (curved arrow). The locations of R195, H180, N127, F212, I211, W210, and K36 amino acids are indicated in panels C and D (sticks). The model used for PLS-based FMA ewMCM representations have the same number of components as the model in panel B.
Conformational transitions of CLC-ec1
CLC comprises a family of transport proteins that function as chloride channels or proton/chloride exchangers (18). CLCs share a similar fold (18 α-helices, labeled from A to R) and dimeric architecture as it observed in x-ray structures from bacteria to eukaryotes (19,20). Mutation and electrophysiology studies have identified a glutamate in the selectivity filter that is essential for the exchange mechanism and for gating in the channels counterpart (21–24). In CLC-ec1 from Escherichia coli this conserved glutamate (E148) resides in the selectivity filter, between the extracellular and intracellular vestibules of the protein (Fig. 5 A). Close to E148 two chlorides can be found in the wild-type, which define the central and internal binding sites for anions (Scen and Sint). It has been shown by x-ray (21), MD (25), and metadynamics (26) that E148 shows an intrinsic flexibility that may play a role in transport mechanisms.
Figure 5.
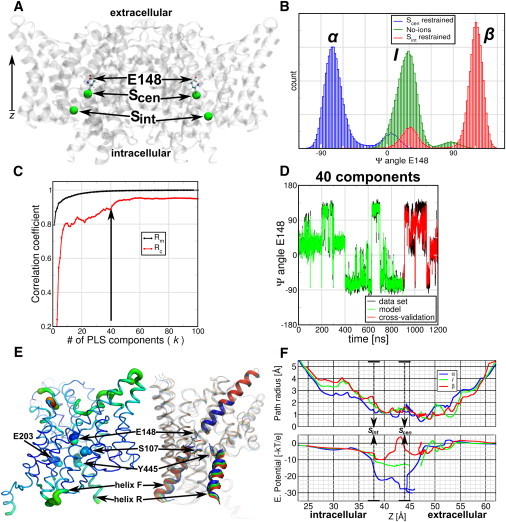
PLS-based FMA analysis for the Ψ-angle of the gating-glutamate E148 of E. coli CLC protein. (A) (Cartoon representation) CLC-ec1 dimer. (Ball-and-stick representation) E148. (Spheres) Chlorides occupying the crystallographic binding sites Scen and Sint. (B) Distribution of the E148 Ψ-angle for single occupied monomers at Scen and Sint, or for empty monomers (No-ions). Scen-occupied monomers mostly populate the α-helical conformation, Sint-occupied populate the β-sheet conformation, and in the empty monomers E148 populate an intermediate conformation, between α and β. (C) Pearson correlation coefficients between data and model for PLS-based FMA as a function of the number of PLS components calculated for the model training (Rm) and the cross-validation subset (Rc). (D) (Overlay) Data and model for the calculated CLC-ec1 angle ΨE148 as function of time corresponding to the MD data, the model training, and the cross-validation subset. (E) (Backbone representations) PLS-based FMA ewMCM contributing to the change in the ΨE148 angle. (Left) (Thickness of the lines) RMSF of the ewMCMs. (Right) (Cartoon and overlay representation) Helices and loops of CLC-ec1, representing the α, the intermediate, and the β-conformation. (Spheres and sticks) The locations of E148, S107, and Y445 are indicated in both representations. The model used for PLS-based FMA ewMCM representations have the same number of components as the model in panel D. (F) Path radius and electrostatic potential calculated along the ewMCM. The conformations correspond to α, I, and β for ΨE148. The potential was multiplied by −1 to visualize the attractive potential on negative particles (like chlorides) as wells. (Arrows) Location of the central and internal chloride sites.
By using MD, PLS-based FMA, and electrostatic calculations, we show that the intrinsic flexibility of E148 also depends on the chloride occupation and these changes are related to local and global changes in the CLC structure. We simulated wild-type CLC-ec1 (unprotonated state of E148) inserted in a preequilibrated 1-palmitoyl-2-oleoyl-sn-glycero-3-phosphoethanolamine (POPE) membrane patch. We ran six different CLC-ec1 simulations for which we changed and enforced the chloride occupation of Scen and Sint. The ion configurations were: No ions; Sint restrained; Scen restrained; Sint and Scen restrained; Sint restrained and Scen free; and free Sint and Scen. In restraining the ions we used a force constant of 1000 [kJ mol−1 nm−2]. The simulations were run for 100 ns each.
The simulations were stable and showed no spontaneous chloride translocations events. In contrast, E148 showed spontaneous flexibility in the simulations. The flexibility corresponded to transitions of the glutamate from the α-helical to the β-sheet zone in Ramachandran space. To quantify the E148 variability we calculated the Ψ-dihedral angle distribution of each simulation. In the Fig. 5 B we observe the Ψ-histograms that show three main peaks of ∼−75° (α), 25° (I for intermediate), and 120° (β). Interestingly, the Ψ-angle distributions clearly correlate with the single anion occupation or absence of anions in the selectivity filter. When the protein is occupied at Scen, the main E148 conformation is α; when occupied at Sint, the main conformation is β; and when the protein lacks anions at the selectivity filter sites, E148 adopts mainly the intermediate conformation. The doubly occupied monomers showed different proportions of the three Ψ-peaks (see Fig. S4). Structurally, the conformations of E148 imply a change in the backbone atoms of the glutamate and glycine of the highly conserved sequence GREGP (19) that flank the central site Scen. They change from orienting the amide nitrogen of G149 toward Scen in the α-conformation, to orient the carbonyl group of E148 in β. In the intermediate state (I) the peptidic bond between these amino acids is parallel to Scen.
We used PLS-based FMA to understand the structural changes of the CLC-ec1 protein related with changes in the E148 Ψ-angle. For that we calculated FMA at a monomer basis using the protein excluding the hydrogens atoms. We constructed the FMA models using 75% of the data and the remaining 25% for cross-validation. In Fig. 5 C we observe that Rm converges to values close to 1 after 40 PLS components, whereas Rc reaches values above 0.8 for 10 or more PLS components and above 0.9 after 40 components. An overlay of the original data set, the model, and the cross-validation for the model built using 40 PLS components is shown in Fig. 5 D, showing that the FMA model recovers most of the features of the original Ψ-data. The structural changes observed in the ewMCM model show delocalized fluctuations in the whole monomer, (Fig. 5 E) mainly in the loops B-C, F-G, I-J, K-L, O-P, and helices Q and R. At E148 the ewMCM includes the transition of its backbone atoms from −70° to 90° in the Ψ-angle.
As a next step we calculated pore radii profiles (using MOLE (27)) and the electrostatic potential (using APBS (28)) along the ewMCM. We used the position of E148 as starting point for MOLE paths searches that connected the central site (Scen at ∼44 Å in the z coordinate) with the extracellular side or with the intracellular vestibule (by Sint at ∼38 Å) through the chloride path (29). Fig. 5 F (upper panel) shows the radii and the electrostatic profile projected onto the z coordinate for interpolated frames along the ewMCM. We selected frames corresponding to α-, I-, and β-conformations of E148. The radii profiles show similar trends for the three frames, i.e., all pore profiles show a constriction below 2 Å radius between 37 and 53 Å. Within this zone they also show a 2 Å peak at the location of Scen. Frames I and β also show an increase of the radii between Sint to 30 Å, in the intracellular part of the chloride path. The electrostatic potentials (Fig. 5 F, lower panel) along these paths was multiplied by −1 to display the attractive potential for anions (positive) as wells.
Profiles are more attractive to anions in the intracellular side and slightly repulsive toward the extracellular side. The most dramatic changes in the potentials occur in the zone between 38 and 48 Å. We observe a first well at ∼39 Å (Sint), which increases systematically along the ewMCM (α to β from −22 to −10 kBT/e). Similarly, the well at ∼44 Å (Scen) changes from −28 to 4 kBT/e. From the Scen site to the extracellular site we found some discontinuities in the paths, which correspond to the most constricted zones of the channel (radii below 1 Å). We speculate that these changes in electrostatic potential and radii are inherent to the occupation of chlorides in CLC. These changes may modulate the relative affinity and accessibility of the sites in the transport cycle of these proteins, therefore directly linking local changes in E148 to global changes in the CLC-ec1 structure. In a transport context, the changes along the Ψ-angle show opening of the intracellular chloride path. These changes include the motion of the helices Q, R, and Y455, which have been indicated (30) as part of an internal gate in CLC-ec1. Also, the changes show how the anion occupation can tweak the electrostatic potential at Scen (31), where anions and protons can go through.
Discussion
The applications presented in Results, above, demonstrate that PLS-based FMA provides a general method to identify a hidden relation between coordinates and a functional order parameter f of interest. In our implementation only a unidimensional f is allowed. It yields a linear model in the form of a collective mode of dynamics that optimizes the covariance with the observed data. This collective mode allows a direct interpretation of the relation between the functional order parameter and the underlying protein mechanics. It also allows us to make a hypothesis about the relevant amino acids contributing the most to the functional property.
Due to the inherent overfitting risk encountered in fitting high-dimensional data sets, cross-validation with independent data is a mandatory step to assess model quality. In all investigated cases, a satisfactory correlation coefficient between model and data was obtained for cross-validation subsets (Rc) of the data that did not substantially deviate from the training subsets (Rm). Increasing the dimensionality of the basis leads to an ever-increasing Rm, but to a Rc that goes through a maximum and then deteriorates due to overfitting.
PLS-based FMA models derived from independent trajectories were found to be remarkably similar, indicating that the models, represented as MCM, are a robust representation of the relation between f and the atomic coordinates (Fig. 2). Naturally, the ewMCM scatters more for different independent trajectories, as the limited sampling in each (sub)trajectory will affect the ensemble weighting. This effect is analogous to the observation that the eigenvalues along individual PCA modes converge slowly in MD (32). It is interesting to note that the cross-validation correlation coefficient Rc provides a qualitative measure of MCM robustness: as can be seen in Fig. 2, trajectory parts that yield more similar models (high scalar products) also display a larger Rc when one part is used for model training and the other for validation.
The robustness assessment shown in Fig. 2 also indicates that the robustness decreases when increasing the dimensionality of the basis, even for a dimensionality where Rc does not yet indicate overfitting. This is likely due to coordinates with relatively little variance that, on the one hand, aid to marginally improve the model (as probed by Rc), but on the other hand, deteriorate model robustness by including additional dimensions. For most practical purposes, a minimal basis dimensionality with adequate Rc should therefore be preferred.
A prerequisite for the application of FMA is the availability of a suitable functional order parameter f. This poses a limitation for cases where a unique parameter of functional interest cannot be uniquely defined.
Our PLS-based implementation is restricted to linear correlations. As shown before, FMA can be extended to general correlations based on mutual information (3). An extension to a mutual information-based implementation is considered for the future.
Conclusions
We have introduced a versatile and general approach to relate an external order parameter f to a collective mode of internal dynamics. The partial least-squares algorithm proved to yield robust solutions to the underlying multidimensional regression problem with minimal and controllable overfitting risk. The aquaporins and CLC-ec1 examples of the PLS-based functional mode analysis illustrate that the approach successfully captures the relation between internal protein dynamics and different functional order parameters of interest. For the Aqy1 case, a putative coupling between the membrane-facing surface and the inner water pore was identified; for hAQP1, the osmotic permeability pf was shown to relate mostly with changes around the ar/R region, and for CLC-ec1 the local mobility of the gating residue Glu148 was found to be coupled to a collective mode that may modulate the chloride ion binding affinity in pore locations remote from the gating residue.
These examples illustrate that PLS-based FMA can be successfully used to study functional mechanisms by detecting collective modes of dynamics that are most related to the fluctuation of a functional property of interest. In addition, such modes can be explored dynamically for additional functional states using techniques like essential dynamics sampling (33) or conformational flooding (34).
Acknowledgments
We thank Camilo Aponte-Santamaría for the Aqy1 MD trajectories. T.K. and A.M. are grateful to N. Krämer and G. Blanchard for helpful comments. We thank Oliver Beckstein for carefully reading the manuscript.
We gratefully acknowledge the Deutsche Forschungsgemeinschaft for funding, via the collaborative research grants No. SFB803 and No. FOR916 as well as support through a Marie-Curie Intra-European fellowship within the 7th European Community Framework Program. T.K. acknowledges the support of the Deutsche Forschungsgemeinschaft as part of the institutional strategy of the Georg-August-University Göttingen.
Footnotes
This is an Open Access article distributed under the terms of the Creative Commons-Attribution Noncommercial License (http://creativecommons.org/licenses/by-nc/2.0/), which permits unrestricted noncommercial use, distribution, and reproduction in any medium, provided the original work is properly cited.
Supporting Material
References
- 1.García A.E. Large-amplitude nonlinear motions in proteins. Phys. Rev. Lett. 1992;68:2696–2699. doi: 10.1103/PhysRevLett.68.2696. [DOI] [PubMed] [Google Scholar]
- 2.Amadei A., Linssen A.B.M., Berendsen H.J.C. Essential dynamics of proteins. Proteins. 1993;17:412–425. doi: 10.1002/prot.340170408. [DOI] [PubMed] [Google Scholar]
- 3.Hub J.S., de Groot B.L. Detection of functional modes in protein dynamics. PLoS Comput. Biol. 2009;5:e1000480. doi: 10.1371/journal.pcbi.1000480. [DOI] [PMC free article] [PubMed] [Google Scholar]
- 4.Hold, H. O. A. 1966. Nonlinear estimation by iterative least squares procedures. In Research Papers in Statistics: Festschrift for J. Neyman. F. N. David, editor. Wiley, New York. 411–444.
- 5.Hold H.O.A. Nonlinear iterative partial least squares (NIPALS) modeling: some current developments. In: Krishnaiah P., editor. Multivariate analysis III. Academic Press; New York: 1973. pp. 383–407. [Google Scholar]
- 6.Hold H.O.A. Soft modeling: the basic design and some extensions. In: Jöreskog K.G., Wold H.O.A., editors. Systems Under Indirect Observation: Causality, Structure, Prediction. North-Holland; Amsterdam, The Netherlands: 1982. [Google Scholar]
- 7.Denham M.C. Implementing partial least squares. Stat. Comput. 1995;5:191–202. [Google Scholar]
- 8.Helland I.S. On the structure of partial least squares regression. Commun. Stat. Simulat. 1988;17:581–607. [Google Scholar]
- 9.van der Spoel D., Lindahl E., Berendsen H.J. GROMACS: fast, flexible, and free. J. Comput. Chem. 2005;26:1701–1718. doi: 10.1002/jcc.20291. [DOI] [PubMed] [Google Scholar]
- 10.Phillips D.C. The hen egg-white lysozyme molecule. Proc. Natl. Acad. Sci. USA. 1967;57:483–495. doi: 10.1098/rspb.1967.0034. [DOI] [PubMed] [Google Scholar]
- 11.Neidigh J.W., Fesinmeyer R.M., Andersen N.H. Designing a 20-residue protein. Nat. Struct. Biol. 2002;9:425–430. doi: 10.1038/nsb798. [DOI] [PubMed] [Google Scholar]
- 12.Fischer G., Kosinska-Eriksson U., Lindkvist-Petersson K. Crystal structure of a yeast aquaporin at 1.15 Ångstrom reveals a novel gating mechanism. PLoS Biol. 2009;7:e1000130. doi: 10.1371/journal.pbio.1000130. [DOI] [PMC free article] [PubMed] [Google Scholar]
- 13.Sui H., Han B.G., Jap B.K. Structural basis of water-specific transport through the AQP1 water channel. Nature. 2001;414:872–878. doi: 10.1038/414872a. [DOI] [PubMed] [Google Scholar]
- 14.Hub J.S., Aponte-Santamaría C., de Groot B.L. Voltage-regulated water flux through aquaporin channels in silico. Biophys. J. 2010;99:L97–L99. doi: 10.1016/j.bpj.2010.11.003. [DOI] [PMC free article] [PubMed] [Google Scholar]
- 15.Zhu F., Tajkhorshid E., Schulten K. Collective diffusion model for water permeation through microscopic channels. Phys. Rev. Lett. 2004;93:224501. doi: 10.1103/PhysRevLett.93.224501. [DOI] [PubMed] [Google Scholar]
- 16.Beitz E., Wu B., Zeuthen T. Point mutations in the aromatic/arginine region in aquaporin 1 allow passage of urea, glycerol, ammonia, and protons. Proc. Natl. Acad. Sci. USA. 2006;103:269–274. doi: 10.1073/pnas.0507225103. [DOI] [PMC free article] [PubMed] [Google Scholar]
- 17.Li H., Chen H., Voth G.A. Enhancement of proton conductance by mutations of the selectivity filter of aquaporin-1. J. Mol. Biol. 2011;407:607–620. doi: 10.1016/j.jmb.2011.01.036. [DOI] [PubMed] [Google Scholar]
- 18.Chen T.-Y. Structure and function of CLC channels. Annu. Rev. Physiol. 2005;67:809–839. doi: 10.1146/annurev.physiol.67.032003.153012. [DOI] [PubMed] [Google Scholar]
- 19.Dutzler R., Campbell E.B., MacKinnon R. X-ray structure of a CLC chloride channel at 3.0 Å reveals the molecular basis of anion selectivity. Nature. 2002;415:287–294. doi: 10.1038/415287a. [DOI] [PubMed] [Google Scholar]
- 20.Feng L., Campbell E.B., MacKinnon R. Structure of a eukaryotic CLC transporter defines an intermediate state in the transport cycle. Science. 2010;330:635–641. doi: 10.1126/science.1195230. [DOI] [PMC free article] [PubMed] [Google Scholar]
- 21.Dutzler R., Campbell E.B., MacKinnon R. Gating the selectivity filter in CLC chloride channels. Science. 2003;300:108–112. doi: 10.1126/science.1082708. [DOI] [PubMed] [Google Scholar]
- 22.Estévez R., Schroeder B.C., Pusch M. Conservation of chloride channel structure revealed by an inhibitor binding site in CLC-1. Neuron. 2003;38:47–59. doi: 10.1016/s0896-6273(03)00168-5. [DOI] [PubMed] [Google Scholar]
- 23.Yusef Y.R., Zúñiga L., Sepúlveda F.V. Removal of gating in voltage-dependent CLC-2 chloride channel by point mutations affecting the pore and C-terminus CBS-2 domain. J. Physiol. 2006;572:173–181. doi: 10.1113/jphysiol.2005.102392. [DOI] [PMC free article] [PubMed] [Google Scholar]
- 24.Zdebik A.A., Zifarelli G., Pusch M. Determinants of anion-proton coupling in mammalian endosomal CLC proteins. J. Biol. Chem. 2008;283:4219–4227. doi: 10.1074/jbc.M708368200. [DOI] [PubMed] [Google Scholar]
- 25.Bostick D.L., Berkowitz M.L. Exterior site occupancy infers chloride-induced proton gating in a prokaryotic homolog of the CLC chloride channel. Biophys. J. 2004;87:1686–1696. doi: 10.1529/biophysj.104.042465. [DOI] [PMC free article] [PubMed] [Google Scholar]
- 26.Gervasio F.L., Parrinello M., Klein M.L. Exploring the gating mechanism in the CLC chloride channel via metadynamics. J. Mol. Biol. 2006;361:390–398. doi: 10.1016/j.jmb.2006.06.034. [DOI] [PubMed] [Google Scholar]
- 27.Petřek M., Kosinová P., Otyepka M. MOLE: a Voronoi diagram-based explorer of molecular channels, pores, and tunnels. Structure. 2007;15:1357–1363. doi: 10.1016/j.str.2007.10.007. [DOI] [PubMed] [Google Scholar]
- 28.Baker N.A., Sept D., McCammon J.A. Electrostatics of nanosystems: application to microtubules and the ribosome. Proc. Natl. Acad. Sci. USA. 2001;98:10037–10041. doi: 10.1073/pnas.181342398. [DOI] [PMC free article] [PubMed] [Google Scholar]
- 29.Accardi A., Walden M., Miller C. Separate ion pathways in a Cl−/H+ exchanger. J. Gen. Physiol. 2005;126:563–570. doi: 10.1085/jgp.200509417. [DOI] [PMC free article] [PubMed] [Google Scholar]
- 30.Jayaram H., Accardi A., Miller C. Ion permeation through a Cl− selective channel designed from a CLC Cl−/H+ exchanger. Proc. Natl. Acad. Sci. USA. 2008;105:11194–11199. doi: 10.1073/pnas.0804503105. [DOI] [PMC free article] [PubMed] [Google Scholar]
- 31.Zhang Y., Voth G.A. The coupled proton transport in the CLC-ec1 Cl−/H+ antiporter. Biophys. J. 2011;101:L47–L49. doi: 10.1016/j.bpj.2011.10.021. [DOI] [PMC free article] [PubMed] [Google Scholar]
- 32.de Groot B.L., van Aalten D.M.F., Berendsen H.J. The consistency of large concerted motions in proteins in molecular dynamics simulations. Biophys. J. 1996;71:1707–1713. doi: 10.1016/S0006-3495(96)79372-4. [DOI] [PMC free article] [PubMed] [Google Scholar]
- 33.Amadei A., Linssen A.B.M., Berendsen H.J. An efficient method for sampling the essential subspace of proteins. J. Biomol. Struct. Dyn. 1996;13:615–625. doi: 10.1080/07391102.1996.10508874. [DOI] [PubMed] [Google Scholar]
- 34.Grubmüller H. Predicting slow structural transitions in macromolecular systems: conformational flooding. Phys. Rev. E. 1995;52:2893–2906. doi: 10.1103/physreve.52.2893. [DOI] [PubMed] [Google Scholar]
- 35.Krämer N., Boulesteix A.-L., Tutz G. Penalized partial least squares with applications to B-spline transformations and functional data. Chemometr. Intell. Lab. 2008;94:60–69. [Google Scholar]
- 36.Manne R. Analysis of two partial least squares algorithms for multivariate calibration. Chemometr. Intell. Lab. 1987;2:187–197. [Google Scholar]
- 37.Bühlmann P., Yu B. Boosting with the L2 loss: regression and classification. J. Am. Stat. Assoc. 2003;98:324–339. [Google Scholar]
- 38.Bissantz N., Hohage T., Ruymgaart F. Convergence rates of general regularization methods for statistical inverse problems and applications. SIAM J. Numer. Anal. 2007;45:2610–2636. [Google Scholar]
- 39.Blanchard G., Krämer N. Optimal learning rates for kernel conjugate gradient regression. Adv. Neur. 2010;23:226–234. [Google Scholar]
Associated Data
This section collects any data citations, data availability statements, or supplementary materials included in this article.