

Abstract
The structures of protein antigen–antibody (Ag–Ab) interfaces contain information about how Ab recognize Ag as well as how Ag are folded to present surfaces for Ag recognition. As such, the Ab surface holds information about Ag folding that resides with the Ab–Ag interface residues and how they interact. In order to gain insight into the nature of such interactions, a data set comprised of 53 non-redundant 3D structures of Ag–Ab complexes was analyzed. We assessed the physical and biochemical features of the Ag–Ab interfaces and the degree to which favored interactions exist between amino acid residues on the corresponding interface surfaces. Amino acid compositional analysis of the interfaces confirmed the dominance of TYR in the Ab paratope-containing surface (PCS), with almost two fold greater abundance than any other residue. Additionally TYR had a much higher than expected presence in the PCS compared to the surface of the whole antibody (defined as the occurrence propensity), along with aromatics PHE, TRP, and to a lesser degree HIS and ILE. In the Ag epitope-containing surface (ECS), there were slightly increased occurrence propensities of TRP and TYR relative to the whole Ag surface, implying an increased significance over the compositionally most abundant LYS>ASN>GLU>ASP>ARG. This examination encompasses a large, diverse set of unique Ag–Ab crystal structures that help explain the biological range and specificity of Ag–Ab interactions. This analysis may also provide a measure of the significance of individual amino acid residues in phage display analysis of Ag binding.
Keywords: Epitope, Paratope, Protein–antigen/antibody interface, Computational structural summary of epitopes and paratope, Specificity of interaction of epitope and paratope amino acid residue
1. Introduction
Full understanding of the biological roles of proteins requires knowledge of their structure, function, multi-protein complex formation, and mechanism of action. There are about 100,000 different human protein amino acid sequences formed by alternative splicing of 23,000 gene products, and perhaps 1,000,000 different modified protein isoforms in human cells. Characteristic 3D protein structures and/or flexibility are typically necessary for proper function, localization, and association with interactive partners. Genomic and proteomic analyses have focused attention on investigating the biological roles of increasing numbers of proteins and protein–protein complexes. Traditional methods of protein structure determination, X-ray crystallography or Nuclear Magnetic Resonance (NMR), are often not feasible or successful for protein structure determination.
Prediction of protein structure from amino acid sequence can be made more reliable with the addition of a relatively small number of structural or distance constraints between amino acid residues in the three-dimensional fold of a protein [1–4]. Such amino acid proximity information can come from side chain surface accessibility measurements, [5,6] nearest neighbor distance information from cross-linking, [7,8] NMR, [9] or identification of the proximity of different regions of the protein sequences based on their participation in antigen–antibody (Ag–Ab) interfaces, as identified by phage display analysis of antibody imprints [9–11].
The Ab amino acid residues in contact with Ag (paratope) are contained in six loops of the amino-terminal region of the antibodies. These loops are called the Complementarity Determining Regions (CDRs): three from the light chain CDRL1–3 and three from the heavy chain CDRH1–3 [12–14]. In contrast, the Ag residues in contact with the Ab (epitope) are by nature much more structurally diverse. Earlier extrapolation from a limited number of structures of protein antigen–Ab complexes suggested that a major fraction of Ab recognize discontinuous or so-called assembled epitopes (i.e. widely spaced regions of the primary Ag amino acid sequence that are folded in close proximity to form the epitope) [15,16].
Evidence from the structures of the Ab alone or the Ag alone often suggested that the complexes of these proteins formed in a lock and key manner, with little or no structural change induced upon complex formation, especially for the higher affinity Ab [16,17]. However, other work proposed an induced fit mechanism, where significant structural rearrangements occurred upon binding [18]. Current evidence suggests that Ab may use conformational selection to recognize preexisting substates of Ag conformational ensembles and that binding is stabilized by small local rearrangements of interface residues [19,20]. The mechanism notwithstanding, free uncomplexed Ab may be viewed as carrying loose three dimensional “imprint” approximations of at least one conformational substate of the protein antigen when in contact with the Ab. The Ab surface is analogous to a pliable three-dimensional cast of the Ag surface in contact with the Ab. We have proposed that such imprints may be “read” by combinatorial peptide-based approaches much like a hunter reads animal tracks, to reveal, with significant limitations, structural information about the antigen surface. We have used phage display of random peptide libraries to obtain NMR-analogous distance constraints between neighboring residues on Ag surfaces [9,10,21].
Since molecular dynamics calculations can assess flexibility and alternative conformations of an Ag surface, phage display peptide epitope mapping of a protein Ag can serve as a valuable starting point for developing understanding of the folding of the Ag surface. It seems clear that the applicability of phage display analysis of Ag folding could be enhanced if better nearest neighbor information about the amino acid residues that comprise the epitope-containing surface (ECS; see Fig. 1) could be gleaned from Ab-selected phage display sequence sets. Such information might provide clues about the organization and folding of an epitope even if a structure of the antigen is not available and thus may reveal distance constraints from which the folding of an antigen could be assessed [3]. It should be mentioned, however, that the concept of a structural description of ECS or paratope containing surface (PCS) outside of the relational context of the full counter surface is controversial. Firstly, the corresponding separated structures may not exactly correspond to those in the complex [20]. Second it has been argued that the interfaces may be too pliable to be mapped with peptides, as “epitope-mimicking” peptides may be interacting with different conformations of atoms than those suggested by the X-ray crystal structures of the Ag–Ab complexes [22]. Nevertheless, there has been significant success in predicting the ECS on Ag, whose X-ray crystal structures have been solved [23].
Fig. 1.

Pheasant egg white lysozyme antigen–antibody complex structure (1JHL) showing (A) a side view of interaction region surfaces and (B) the interfaces turned 90° so that the epitope-containing (ECS) and paratope-containing (PCS) surfaces (with 80% transparency) can be better visualized. Images were generated using the Chimera molecular modeling system (http://www.cgl.ucsf.edu/chimera/).
This usage of phage display mapping differs from the more oft cited goal of developing peptide vaccines from linear sequences derived from phage display sequence information [24] that act as mimotopes [22] (i.e. peptides having little or no linear sequence similarity to an epitope) and that in more recent usage are associated with the property of induction of an antibody [25]. Thus our purpose is more limited, namely to gain residue proximity and chain folding information on the Ab binding site of the Ag. Since an ultimate goal for this approach would be to devise a method to obtain an approximate structure of the ECS corresponding to any monoclonal Ab, we wish to emphasize that the ECS is also viewed as an intrinsic structural feature of only one conformational state of a protein that exists as a relational entity only in the presence of its corresponding Ab [26].
In our previous studies, we have shown that discontinuous epitopes can be mapped with peptides representing different regions of the linear sequence of the Ag in an “imprint” of the surface, i.e. the PCS. Methods to utilize the antibody “imprint” to provide proximity information on discontinuous ECS's are being developed by us [9,10,21,27,28] and more recently by others [29–31]. These methods select complementary peptides from random peptide libraries displayed on phage that bind to the antibodies and use algorithms to map the complementary peptides to the protein sequence [9,10,21,27].
The current work seeks to enhance the understanding of the ECS–PCS interactions at the amino acid level [27] to help provide additional insight useful for development of computational methods for analysis of combinatorial peptide mapping results, such as phage display. Of course, it should be understood that antibodies, to some degree, are pliable structures with significant degeneracy and cross reactivity in the peptides and proteins that they bind, so this approach has intrinsic limitations. However proximity constraints vastly facilitate computational prediction of protein structure from sequence [3]. Such an analysis would take into account the parameters determined in our study e.g. epitope occurrence propensity, epitope amino acid composition, residue interaction frequencies and substitutability. It might also consider, elements such as “hotspots” and Ab paratope features previously found to be important in protein–protein interfaces [32,33] and in the smaller set of Ag–Ab structures [14,34], as well as peptide substitutability examined with peptide antigens [35].
The number of Ag–Ab complexes examined at the amino acid level previously has been limited by the number of available structures. In the classic work by Olson and coworkers [14], general features were extrapolated from six structures, including only one protein antigen, lysozyme. As special cases of generalized protein–protein interactions, Jones and Thornton [36], considered Ab interactions with three different protein antigens. A review by MacCallum et al. in 1996 [37] considered 10 complexes, Davies and Cohen [38] reviewed three additional anti-idiotype complexes in 1996 and LoConte et al., [16] studied 19 Ag–Ab complexes, of which seven were lysozymes. Sundberg and Mariuzza studied the structures of 30 complexes in 2002 [39], but they did not discuss generalizations from this entire group. The former studies considered the contacting propensities of the Ab paratope residues in some detail; however, examination of the properties of the antigen ECS residues was more limited. A more comprehensive work by Chen et al. [40] analyzed datasets of Ag–Ab complexes containing 41 peptide antigens and 155 protein antigens of which 19 and 52 were unique, respectively. This study concluded that continuous linear peptides cannot mimic the structure of Ag sufficiently to serve as effective vaccines. The pioneering work of Sidhu and colleagues expanded on the structural diversity of recognition offered by four amino acids carried in structural features of recombinant Ab paratopes [34]. However, those studies were directed at engineering artificial Ab and extrapolated from the findings of a limited collection Ag–Ab structures.
Since our work centers on using antibodies as tools to obtain three dimensional information about Ag structure from Ab-selected phage displayed peptide sequences, it was important for us to examine Ag–Ab interactions in more detail. In particular, we wished to assess ECS–PCS residue interaction propensities to ultimately support better interpretation of phage displayed peptide sequences that are selected by Ab-binding. At the time of analyzing the data for the present paper, there were 101 Ag–Ab complexes listed in the Protein Data Bank (PDB), however, 48 of those were to some degree, redundant. We felt that including the redundant structures might bias the studies, giving higher weight for multiply-represented protein Ag having unusual surface structural features, such as the widely-studied, very basic protein, lysozyme. Thus, we have examined the contact regions of the 53 non-redundant Ag–Ab complexes available from the PDB, to provide a more generalized picture of the interfaces and the interactions that appear to be most significant for binding, paying special attention to the ECS residues. Our study confirms and extends prior general characterizations of the Ag–Ab interface and suggests that approximately one half of the 20 amino acids found in the PCS exhibit a moderate degree of promiscuity in their interactions with ECS residues, with SER, GLY, TYR and THR showing the most and MET, PHE, PRO, and ALA showing the least. In contrast, the degree of promiscuity on the ECS is higher, with ASN, GLN, ASP, GLU, VAL exhibiting greatest while TYR and MET show the least. These interaction propensities are likely to contribute to improved understanding of the diversity and specificity of protein antigen–Ab interactions and may be exploited for the interpretation of phage displayed Ab-selected sequences.
2. Materials and methods
2.1. Delineation of surface residues
At the time that this study was initiated (Nov. 2009), there were 101 (see above) peptide and protein Ag–Ab complexes in the PDB. Many of these complexes were redundant in the sense that they included numerous representatives of the same protein, for example as site-specific mutants. In our judgment this type of redundancy could bias the analysis to overly weigh certain types of interactions. Hence, we deleted all but one Ag–Ab complex representative of a unique Ab and a particular Ag taxonomic species. We included multiple representatives of the lysozymes that span different species origin (e.g. bobwhite quail, hen, pheasant, etc.) but only one representative of the multiple structures in which mutations were engineered in the Ag or Ab. This helped reduce the structural bias away from the highly studied antigens, such as lysozyme, and differentiates our study from that of Chen et al. [40].
The Ag–Ab data set was grouped based on the number of amino acid residues in the antigen for each complex in order to investigate whether there were any systematic differences in the interactions with different-sized antigens. The group I “peptide” antigens had fewer than 25 amino acid residues, Group II, “small size” proteins, had more than 25 but less than 130 residues, while Group III, “large size” proteins, had greater than 130 residues. The complexes analyzed are listed in Table A1 of the Appendix.
We defined surface residues as those residues with a solvent-accessible surface area (SASA) of >50 Å2. Since the calculated surface area for the amino acid residue with the smallest side chain, GLY, is 75 Å2 (http://www.fli-leibniz.de/IMAGE_AA.html) and for the largest (TRP) is 255 Å2, our cutoff value represents 2/3 of the smallest amino acid residue surface area. It is equivalent to the surface area of about 3 of the 4 backbone atoms of GLY and therefore excludes all but a full backbone exposure of any amino acid residue. It thus reduces the influence of backbone-only exposed residues in our calculation and raises the requirement that a substantial portion of the residue side chain be exposed to have it considered as involved in amino acid-specific recognition. This value is also slightly larger than the 30–40 Å2 used by Bordo and Argos to consider an amino acid residue as exposed [41]. It better allows for hydrogens, a slightly higher degree of flexibility that might be required by the modified induced fit model [19], and, we believe, a better correspondence to residues that might appear in antibody-selected sequences from phage display peptide libraries. The calculations of the molecular surfaces were carried out using the Chimera molecular visualization program (http://www.cgl.ucsf.edu/chimera/) and embedded software from the MSMS package (http://www.scripps.edu/~sanner/html/msms_home.html/) [42].
2.2. ECS and paratope containing surfaces
There are two main approaches that have been used to define ECS residues in Ag–Ab complexes. The first approach uses the change in solvent-accessible surface area (SASA) between two atoms of an interactive pair of molecules, [43] while the second approach uses a distance cut-off between atoms in the respective complexes [44]. We used a combination of the two approaches to define the ECS and PCS; we determined the subset of all antigen–antibody residue pairs in the complex that were (1) solvent-accessible, when dissociated, and (2) separated by a distance of ≤5 Å. If hydrogens are included, the theoretical maximum separation distance between two contacting C, N, O, or S atoms is 6.6 Å, albeit in practice the majority of contacting residues are ≤5 Å apart [44]. Hafenstein et al. recently employed a 5 Å cut-off for the interface definition for measuring the “footprint” of an antibody on an antigen surface [45]. Moreover, our cutoff is slightly larger than the 4.5 Å cutoff employed by Bordo and Argos [41] to define the neighborhood of a protein residue, and thus allows for some flexibility in the interface. Additionally, since some of the atoms within the 5 Å distance cutoff are not accessible to the solvent, they would be excluded from our definition of the ECS and PCS, tightening the definition. Thus, we explicitly use the atoms in the interface region to determine which residues belong to the interface and to calculate the interface surface area. For example, two residues, one having five solvent-accessible atoms in the interface region and the other having two solvent accessible atoms in the interface region would both be counted as contributing to the interface. It is important to state that our usage of ECS and PCS in this context is broader than the normal use of epitope and paratope as our usage defines the surface that contains the most closely interacting residues, such as those involved in hydrogen bonds, as well as those that are further away yet under the 5 Å cutoff.
2.3. Amino acid composition
We calculated the raw frequency of occurrence of each type of amino acid residue in the ECS and PCS. The amino acid surface frequencies were also calculated for entire protein antigen, and antibody surfaces of all the Ag–Ab complexes. We then calculated the Mole Fraction of each amino acid residue x in the ECS and PCS by dividing the frequency of occurrence of x in the ECS or PCS by the total number of residues on the entire surface of the antigen or antibody.
We also calculated the average mole fraction for each amino acid residue type in the ECS and PCS by summing the molar fractions for a particular residue in each respective surface and dividing by the total number of complexes,
where Mole Fractioni (x) is the mole fraction of residue x in the ith complex.
2.4. Occurrence propensity
Different amino acid residues have different tendencies to be on the surfaces of proteins. We normalized the mole fractions of residues on the ECS (or PCS) surfaces by the mole fractions of the same residues on the entire surface of the respective protein (antigen or antibody) and called these values the ECS (or PCS) Occurrence Propensities.
The average ECS occurrence propensity expresses the likelihood of finding a particular residue on the ECS (PCS) relative to the likelihood of finding the residue on the protein surface. An ECS (PCS) Occurrence Propensity>1 indicates a higher probability that a particular amino acid residue occurs in the ECS (PCS). Similarly, an ECS (or PCS) Occurrence Propensity<1 indicates that the particular amino acid residue is less likely to occur in the ECS (PCS) than on the total protein surface.
2.5. Interface properties
We characterized the 53 Ag–Ab interfaces by their surface planarity, eccentricity, size, distribution of residues, and degree of discontinuity. The planarity is a measure of the curvature and roughness of the interface. ProtorP, a protein–protein interaction analysis server [30] was used to calculate the surface planarity and eccentricity. The planarity of the surfaces between Ag–Ab complexes is calculated by computing the root mean square deviation of all the interface atoms from the least-squares plane through the interface atoms. If all the atoms would exactly fit the same plane, the planarity index would be zero [36,46]. The gap volume index measures the complementarity and closeness of packing of the interface between the two subunits. The gap volume index is determined by measuring the volume of empty space between the atoms. The gap volume index is measured in angstroms, and is computed by dividing gap volume in Å3 by the Interface Area (ASA) in Å2 [47].
The eccentricity of the Ag–Ab interface (also known as the circularity) is calculated as the ratio of the length of the principal axes of the least-squares plane through the atoms in the interface [47]. An eccentricity ratio near 1.0 indicates that an interface is approximately circular. The maximum dimensions of the ECS and PCS were determined by carrying out a pair wise Euclidean distance calculation of the distance between each pair of atoms in the ECS/PCS and selecting the largest distance found. Furthermore, we calculated the average distance of each type of residue from the center of mass of the ECS/PCS over all the complexes. We examined the ECS discontinuity from the linear amino acid sequence on the protein antigen surface. The ECS discontinuity was defined as the number of gaps of the Ag sequence within the ECS that were separated from their neighbor regions by gaps in the antigen amino acid sequence.
2.6. ECS–PCS amino acid frequency of interaction
We calculated the frequency of interaction between particular residues on the ECS and those on the PCS to obtain a measure of the importance of different pairwise residue interactions. A pair of amino acid residues i and j in a complex k was considered to be in contact if the distance between at least one of their atoms was at most 5 Å. The total number of pairwise interactions between ECS residues of type i and PCS residues of type j is
where is the actual number of interactions between ECS residues of type i and PCS residues of type j in a particular complex k.
In the Ag–Ab interface, a pair of residues will presumably interact frequently if they are each frequent in the interface or have favorable energetics of interaction. The latter reason for interaction would be expected to contribute to the specificity or affinity of the Ab–Ag interaction. One way to understand the role of amino acids on the interface is to compensate for the effect of chance occurrence on the surface. This is done by calculating the number of interactions expected by chance i.e. the expected frequency, and dividing the observed frequency by this number. This ratio was calculated for each complex in the data set and the ratios obtained were averaged over all of the complexes, to obtain the Specific Frequency of Interaction. The Specific Frequency of Interaction is a measure of how far the observed Ab–Ag interactions depart from random and thus express the relative contribution of each amino acid residue to the Ag–Ab interaction.
The expected frequency of a pair of amino acid interactions for each complex, if the interactions were random, is approximately proportional to the product of the raw frequency of occurrence of each amino acid in their respective ECS and PCS interface regions. This estimate is based on the residues being randomly distributed and is a slight overestimate, due to the fact that two randomly placed residues cannot occupy the same position. We have,
where , is the expected number of random interactions between ECS residue i and PCS residue j in complex k, is the frequency of amino acid i in the ECS of complex k, is the frequency of amino acid j in the PCS of complex k and ck is a constant chosen so that the sum of all the expected pair wise interactions is equal to the sum of observed pairwise interactions,
For each amino acid pairwise interaction, the Specific Frequency of Interaction Rij, is the ratio of the observed to the expected frequency of interaction, where the expected frequency of interaction, , is as follows:
Finally, the average specific interaction frequency is obtained by computing the average of the overall complexes ,
The average specific interaction frequencies are shown in Table 4. Values are only reported for pairs (i,j) where |Sij|≥3 for statistical significance.
Table 4.
Specific interaction frequencya.
 |
Average specific interaction frequencies reported if there were ≥3 cases.
Ae — Average over each row; Ap — Average over each column.
To further examine the significance of interaction frequency in antibody recognition of antigen, a Pearson product–moment correlation coefficient analysis was performed on the data in Table 3. The Pearson product–moment correlation coefficient analysis is a widely used measure of linear dependence of two variables [48]. It is calculated from a product of two variable covariance, divided by the product of the standard deviations.
Table 3.
Frequency of interaction matrix.
| Antibody paratope-containing surface (PCS) | ||||||||||||||||||||||||
|---|---|---|---|---|---|---|---|---|---|---|---|---|---|---|---|---|---|---|---|---|---|---|---|---|
| A | R | N | D | C | Q | E | G | H | I | L | K | M | F | P | S | T | W | Y | V | Σe | Oe | Ae | ||
| Antigen Epitope-containing Surface (ECS) | A | 4 | 8 | 11 | 4 | 0 | 0 | 5 | 0 | 6 | 4 | 3 | 3 | 1 | 5 | 2 | 13 | 7 | 10 | 33 | 1 | 120 | 15 | 8.00 |
| R | 3 | 29 | 31 | 25 | 1 | 2 | 21 | 20 | 8 | 3 | 4 | 0 | 3 | 4 | 3 | 35 | 17 | 66 | 111 | 3 | 389 | 60 | 6.48 | |
| N | 5 | 18 | 32 | 20 | 1 | 7 | 5 | 16 | 5 | 17 | 5 | 2 | 1 | 9 | 1 | 23 | 21 | 23 | 126 | 4 | 341 | 66 | 5.17 | |
| D | 6 | 31 | 22 | 1 | 0 | 0 | 3 | 16 | 7 | 4 | 1 | 3 | 0 | 5 | 0 | 30 | 15 | 14 | 141 | 1 | 300 | 55 | 5.45 | |
| C | 0 | 0 | 0 | 0 | 0 | 0 | 0 | 0 | 0 | 0 | 0 | 0 | 0 | 0 | 0 | 0 | 0 | 0 | 2 | 0 | 2 | 1 | 2.00 | |
| Q | 5 | 20 | 14 | 21 | 0 | 6 | 3 | 17 | 6 | 4 | 2 | 2 | 1 | 3 | 4 | 26 | 20 | 28 | 101 | 9 | 292 | 44 | 6.64 | |
| E | 5 | 37 | 11 | 10 | 0 | 3 | 2 | 8 | 7 | 2 | 4 | 3 | 8 | 8 | 5 | 24 | 15 | 9 | 112 | 7 | 280 | 51 | 5.49 | |
| G | 0 | 11 | 22 | 27 | 0 | 1 | 8 | 14 | 12 | 0 | 4 | 0 | 3 | 3 | 1 | 10 | 13 | 6 | 51 | 0 | 186 | 34 | 5.47 | |
| H | 1 | 4 | 13 | 10 | 0 | 2 | 0 | 4 | 4 | 3 | 0 | 0 | 0 | 3 | 3 | 4 | 7 | 5 | 21 | 4 | 88 | 22 | 4.00 | |
| I | 7 | 9 | 10 | 4 | 0 | 0 | 3 | 4 | 4 | 4 | 2 | 4 | 2 | 7 | 2 | 3 | 5 | 10 | 26 | 3 | 109 | 21 | 5.19 | |
| L | 10 | 16 | 9 | 11 | 0 | 4 | 3 | 3 | 4 | 4 | 19 | 0 | 1 | 15 | 5 | 15 | 10 | 9 | 38 | 5 | 181 | 28 | 6.46 | |
| K | 1 | 0 | 13 | 24 | 0 | 6 | 7 | 3 | 1 | 3 | 0 | 1 | 0 | 0 | 0 | 6 | 6 | 41 | 96 | 0 | 208 | 62 | 3.35 | |
| M | 0 | 2 | 5 | 0 | 0 | 1 | 1 | 3 | 0 | 3 | 0 | 0 | 7 | 9 | 0 | 0 | 2 | 5 | 16 | 4 | 58 | 8 | 7.25 | |
| F | 6 | 3 | 3 | 0 | 0 | 1 | 0 | 5 | 4 | 1 | 3 | 0 | 0 | 5 | 8 | 8 | 4 | 0 | 19 | 0 | 70 | 8 | 8.75 | |
| P | 3 | 3 | 7 | 17 | 0 | 3 | 3 | 1 | 5 | 2 | 0 | 0 | 1 | 15 | 2 | 1 | 13 | 6 | 35 | 4 | 121 | 34 | 3.56 | |
| S | 6 | 8 | 21 | 15 | 0 | 1 | 3 | 9 | 10 | 4 | 10 | 2 | 0 | 3 | 5 | 12 | 13 | 15 | 54 | 1 | 192 | 30 | 6.40 | |
| T | 4 | 22 | 24 | 20 | 1 | 8 | 6 | 9 | 6 | 11 | 5 | 3 | 3 | 2 | 1 | 21 | 16 | 21 | 46 | 7 | 236 | 42 | 5.62 | |
| W | 8 | 6 | 9 | 3 | 0 | 0 | 1 | 4 | 0 | 11 | 0 | 0 | 4 | 1 | 0 | 6 | 4 | 5 | 23 | 0 | 85 | 14 | 6.07 | |
| Y | 7 | 24 | 17 | 7 | 0 | 1 | 2 | 10 | 0 | 4 | 11 | 0 | 2 | 2 | 6 | 13 | 8 | 21 | 13 | 4 | 152 | 25 | 6.08 | |
| V | 6 | 6 | 8 | 3 | 0 | 0 | 4 | 3 | 4 | 3 | 1 | 2 | 1 | 2 | 3 | 10 | 10 | 3 | 50 | 3 | 122 | 25 | 4.88 | |
| Σp | 87 | 257 | 282 | 222 | 3 | 46 | 80 | 149 | 93 | 87 | 74 | 25 | 38 | 101 | 51 | 260 | 206 | 297 | 1114 | 60 | ||||
| Op | 27 | 63 | 82 | 94 | 1 | 23 | 36 | 108 | 36 | 32 | 30 | 24 | 9 | 37 | 29 | 119 | 101 | 59 | 219 | 27 | ||||
| Ap | 3.22 | 4.08 | 3.44 | 2.36 | 3.00 | 2.00 | 2.22 | 1.38 | 2.58 | 2.72 | 2.47 | 1.04 | 4.22 | 2.73 | 1.76 | 2.18 | 2.04 | 5.03 | 5.09 | 2.22 | ||||
Σe — Sum over each row; Σp — Sum over each column
Oe — Total number of occurrences of a particular residue in all ECS; Op — Total number of occurrences of a particular residue in all PCS
Ae — Average number of interactions of each ECS residue with PCS residues (average interaction frequency)
Ap — Average number of interactions of each PCS residue with ECS residues (average interaction frequency)
Total and averages are bolded.
The Perl scripting language was used for all the data generation and processing. R (http://www.r-project.org/index.html) and Excel were used for statistical analysis.
3. Results and discussion
3.1. General ECS features
The identities and PDB codes, of all the Ag–Ab complexes investigated are listed in Table A1, where they are grouped by antigen size. We calculated the solvent accessible surface area (SASA) of the ECS and the PCS and their sum. The average area of the solvent-accessible ECS is 1103 ± 244 Å2 with maximum dimensions of 28 ± 8 Å (Table 1). The average surface areas of the different antigen size groups in Table A4 indicate that the surface areas of the ECS and PCS are effectively equal, except in the case of the group I peptide antigens. The average surface area ratio (ECS versus PCS) is ~1.5 for the peptide antigens (Table A5). This surface area differential for peptide Ag is the result of the small dimensions of the peptides, typically falling within the distance cut-off for assessing ECS membership. Considering all groups together, the average value for the combined ECS plus PCS area is 2071 ± 456 Å2 (Table 1), which is similar to Sundberg and Mariuzza's [39] estimate of ~1400–2300 Å2, based on a more limited set of structures and that of Chen et al., [40] 1646 ± 442 (weighted average overall antigens, including redundant structures and antigens).
Table 1.
Properties of antigen ECS and antibody PCS.
| Properties | Average | Std. dev |
|---|---|---|
| ECS number of amino acid residues | 12.2 | 3.3 |
| PCS number of amino acid residues | 21.9 | 5.4 |
| ECS maximum dimension (Å) | 28 | 8 |
| ECS surface area (Å2) | 1103 | 244 |
| PCS surface area (Å2) | 967 | 253 |
| Interface region surface area (Å2) | 2071 | 456 |
| Hydrogen bonds | 21 | 17 |
| Gap volume index (Å) | 2.5 | 2.1 |
| Planarity (Å) | 2.2 | 0.6 |
| Eccentricity | 0.7 | 0.2 |
When viewed from an axis perpendicular to its least squares plane, the antigen antibody interface has an eccentricity value of 0.7 ± 0.2 suggesting that the lateral distribution in the plane of the interface is noncircular. The Ag–Ab interface is also irregular in the vertical plane, as evidenced by the planarity index, which is the root mean square deviation of interface atoms from the average plane. The average planarity index of the Ag–Ab interface is 2.2 ± 0.6 Å and there is no significant difference in the planarity index for the different antigen groups (Table A4). These values suggest that the side chains, which can be as long as 7 Å in extended conformation, lie relatively flat on the ECS and PCS and that they do not inter-digitate more than 2–3 Å, on the average. The gap volume index, another measure of the closeness of the surface interaction, is obtained by calculating the quotient of the gap volume and the interface surface area and is given in Table A4 for the different groups. The average values for the gap volume index is 1.4, 2.4, and 3.4 for antigen size Groups I through III, respectively. These values indicate that the fit is considerably tighter for the smaller antigens. There is relatively little free space between antibody and protein antigen structures, but some small voids are present, which could contain water molecules [39] especially between the larger antigens and their antibody interactive surfaces.
3.2. Amino acid composition
We examined the amino acid compositions of the ECS and PCS of the 53 complexes and compared them with the compositions of the total antigen and antibody protein surfaces. The average surface exposure of the amino acid residues is 86.3% for the peptide antigens (Group I), 47.2% for the small protein antigens (Group II), and 36.9% for the large protein antigens (Group III) (Table 2). The average antigen ECS contains a range of 12 ± 3 amino acid residues, while the peptides (Group I) showed significantly smaller value of 9 ± 3 amino acids in their ECS, reflecting the smaller and variable sizes of these antigens (Table A4). Interestingly, the PCS has almost twice the number of amino acid residues (22±5, see Table 3) as the ECS, suggesting a higher density of interaction. The mole fraction of each residue type in this interface is shown in Fig. 2A, averaged for all antigens. The mole fraction ranges from 12.9% for LYS to 0.2% for CYS with only 1 occurrence. The numerical values are tabulated in Table A2, along with the mole fractions calculated for the three different groups. The paucity of CYS<MET<PHE<TRP in the ECS is notable, as is the relative abundance of charged or polar LYS>ASN>ARG>ASP. The average mole fraction was also calculated for the entire antigen surface and is also shown in Fig. 2A as the gray bars. The three most abundant residues on the whole antigen surface match the rank order of the same residues in the ECS. Some residues, especially those that are hydrophobic, are depleted in the ECS (PHE, CYS, SER, VAL, ALA, and LEU) relative to the whole antigen surface.
Table 2.
Characteristics of the antigen groups.
| Average size (# residues) |
Std. dev |
Total # of residues |
Total # of surface residues |
% of residues on the molecule surface |
|
|---|---|---|---|---|---|
| Antigen data | |||||
| Group I (13) | 11.2 | 4.8 | 146 | 126 | 86.3% |
| Group II (21) | 116.2 | 20.4 | 2440 | 1151 | 47.2% |
| Group III (19) | 319.4 | 137.5 | 6068 | 2240 | 36.9% |
| All protein groups ombined (40) | 212.7 | 139.6 | 8508 | 3391 | 39.9% |
| All groups combined (53) | 163.3 | 149.3 | 8654 | 3517 | 40.6% |
| Antibody data (53) | 393.6 | 229.8 | 23,941 | 7872 | 32.9% |
Fig. 2.

ECS and Ag surface amino acid composition and amino acid occurrence propensities, averaged over the 53 non-redundant structures. (A) Average mole fraction of amino acids in ECS (white) and entire Ag surface (gray) and (B) average ECS occurrence propensity (ratio of molar fractions of ECS to entire Ag surface) of each amino acid residue type.
The ECS Occurrence Propensity (the ratio of the occurrence in the interface surface to the occurrence on the total protein surface) normalizes for the tendencies of different residues to occur on protein surfaces and provides a measure of the significance of finding particular amino acids in the ECS or PCS. Fig. 2B and Table A2 shows that, for the total antigen set, TRP>TYR occur in the ECS in significantly higher proportion than on the entire protein antigen surface (>1.3), suggesting that they may play a more important role in the recognition process, whereas CYS<PHE<ALA occur in the ECS at ratios that are less than 0.8. The remainder of the residues has ECS Occurrence Propensity values of close to one (0.8≤occurrence propensity≤1.1). Nussinov and colleagues found that TRP, PHE, and MET appear to be structurally conserved in protein–protein interactive surfaces [49]. We found that TRP and MET are enriched in the antibody–antigen interface, but PHE was not enriched. Bogan and Thorn [32] identified TRP>ARG>TYR>ILE as the four residues most enriched in protein interaction interfaces and suggested that they were “hotspots” of binding. These residues were also defined as contributing the greatest free energy of binding, based on alanine scanning mutagenesis experiments [32]. We found that TRP, ILE and TYR were enriched in the ECS as compared to the whole antigen surface. ARG was one of the five most abundant residues in the ECS but not any more than on the whole surface. It is also interesting to contrast these findings with those obtained from screening antibody-binding peptide data bases for individual amino acid occurrences [35] where TRP exhibited zero occurrences in the epitope sensitive regions. However, it should also be noted that in our experience finding TRP in phage displayed peptide sequences was not that unusual [21,50].
These differentials in average ECS Occurrence Propensities suggest that amino acid residues with higher average occurrence propensities may also be more important for Ab–Ag interactions. The amino acid composition of the residues on the PCS surface along with their PCS occurrence propensity values are shown in Fig. 3 and numerically in Table A3. The most abundant amino acid residue in the PCS is TYR (19%), occurring almost twice as often as the next most abundant residue SER (10%). It should also be noted that TYR, as well as PHE and TRP are about 5 times more abundant in the PCS than on the entire surface of the antibody as can be seen in Fig. 3B. The PCS occurrence propensities are also quite high for HIS (2.8)>ILE (2.3) suggesting that these residues also have an important roles in the Ag–Ab interactions. It is of interest that four of these residues were identified in the hotspot/conserved groupings mentioned above [32,49].
Fig. 3.

PCS and Ab surface amino acid composition and amino acid occurrence propensities, averaged over the 53 non-redundant structures. (A) Average mole fraction of amino acids in PCS (white) and entire Ab surface (gray) and (B) average PCS occurrence propensity (ratio of molar fractions of PCS to entire Ab surface) of each amino acid residue type.
3.3. Interactions of antibody/antigen amino acid residues
The preceding analysis indicates that some amino acids are enriched in the ECS and PCS, relative to their occurrence on protein surfaces. This implies that these favored amino acids are of correspondingly higher importance to the Ab–Ag binding interaction, but might also argue against their role in specificity, i.e. less abundant residues could imply a higher degree of specificity, resulting from a special interaction between certain residue types. However, if they have promiscuous interactions in the Ab–Ag interface, their contribution might be more important for positional spacing or a requirement that additional structural recognition could be achieved by a special order of the residues (i.e. sequence) in the structures, rather that amino acid side chain recognition [51].
To obtain another measure of the significance of particular residue types for Ag–Ab binding, we sought to identify the residues that are the most frequently involved in the interactions between antigen and antibody. We calculated the number of contacts that each residue in the ECS makes with specific residues in the PCS. A contact was scored if the distance between at least one of the atoms of the residue to the atoms of the complementary member was below the 5 Å cutoff and the atoms were solvent exposed in the separated complexes. We also made the corresponding calculation for the PCS residues. This interaction count is affected by the number of times a particular residue occurs in the ECS and PCS, as well as the side chain interaction properties (e.g. size, charge, hydrogen bonding, hydrophobicity). The interaction counts are tabulated in a 20 × 20 matrix shown in Table 3, as the number of interactions between residues in the PCS or ECS with residues in the opposing surface. Of all the residues on either surface, the PCS TYR is very remarkable. A total of 219 TYR in the PCS make a total of 1114 contacts or interactions with every type amino acid found on the ECS, averaging 5.1 interactions per TYR occurrence. By contrast on the ECS, ARG, ASN, ASP have the highest number of total interactions ranging between 300 and 389. Of the three, only ASN contacts all PCS residues. Their occurrence and average interaction values range from 55 to 66 occurrences with 5.2–6.5 average interactions per occurrence.
To display a measure of the overall interaction frequencies of each amino acid on one surface with all the residues of the complementary surface, we summed the rows and columns of Table 3 (Σe and Σp, respectively) and plotted the values for each amino acid. Fig. 4A shows the number of interactions of each amino acid in the ECS with all the residues in the PCS (white) and the number of interactions of each amino acid in the PCS with all the residues in the ECS (gray). These results show differences and similarities for the two surfaces. For the ECS residues, the number of interactions can be grouped into three categories: (2 = CYS<MET<PHE<TRP<HIS<100<ILE<ALA<PRO<VAL<TYR<LEU<GLY<SER<200<LYS<THR<GLU<GLN<ASP<ARG = 389). For the PCS, 11 amino acids had fewer than 100 interactions (3 = CYS<LYS<MET<GLN<PRO<VAL<LEU<GLU<ILE<ALA<HIS = 93), 2 had fewer than 200 interactions (PHE<GLY), and seven had more than 200 interactions (THR<ASP<ARG<SER<ASN<TRP<TYR = 1114). The most striking result from this comparison was the 7.4 fold difference between PCS and ECS TYR that demonstrates the higher usage of PCS TYR in the Ab–Ag interaction. TYR and TRP (3.5 fold more contacts) are again among the residues that are found in protein interface hotspots [32] and are identified by Sidhu and colleagues as among the most important for affinity in Ag–Ab interactions [52].
Fig. 4.

Interaction frequencies of ECS residues with PCS residues. (A) Total number of interactions of each amino acid residue type in the ECS with amino acid residues in the PCS (white) and total number of interactions of each amino acid residue type in the PCS with amino acid residues in the ECS (gray), and (B) average interaction frequency (Ae) of each ECS residue type with all amino acids in the PCS (white) and average interaction frequency of each PCS residue type (Ap) with all amino acids in the ECS (gray).
3.4. Average and specific frequency of interaction
Because the occurrences of the different residues in the ECS and PCS vary considerably, the frequency of interaction of each residue type will reflect the number of times it occurs in the ECS and PCS (the statistically expected frequency), as well as any special property it might have that increases its interaction with another residue (i.e. size, charge, hydrophobicity, etc.). To gain a measure of how often a particular amino acid in one interface interacts with all the residues of the opposite interface, we calculated two parameters that we call the average interaction frequency, Ae and Ap (Table 3) and the specific interaction frequency Se and Sp (Table 4), where the lower case letter corresponds to the ECS and PCS, respectively. Ae and Ap are tabulated in Table 3 and were calculated from the quotient of their total interactions (Σe and Σp, respectively) and occurrences (Oe and Op, respectively). We consider those residues that had a high average number of contacts to be relatively more significant for making contacts on the opposite surfaces. The distribution of these values among the amino acids from each surface is shown in Fig. 4B. Clearly PCS residues 5.1 = TYR>TRP>-MET>ARG = 4.1, having the highest Ap values, have the most impact in terms of their average interactions with the ECS, while ECS residues 8.75 = PHE>ALA>MET>GLN = 6.6 have the highest average interaction with the PCS residues. CYS appears to be a special case in both these distributions because of its low abundance and thus is statistically less significant. However, examination of the structures that have a CYS in their ECS and PCS, 2J4W, 1RJC respectively, shows that the CYS in both types of surfaces are in intramolecular disulfides that are located in prominent positions near the centers of their respective interfaces with sulfur contacts as well as backbone contacts. Interestingly, only MET is shared by both top-four lists, suggesting differences in the way that the ECS and PCS use different amino acids in their interface surfaces to mediate their complementary interactions.
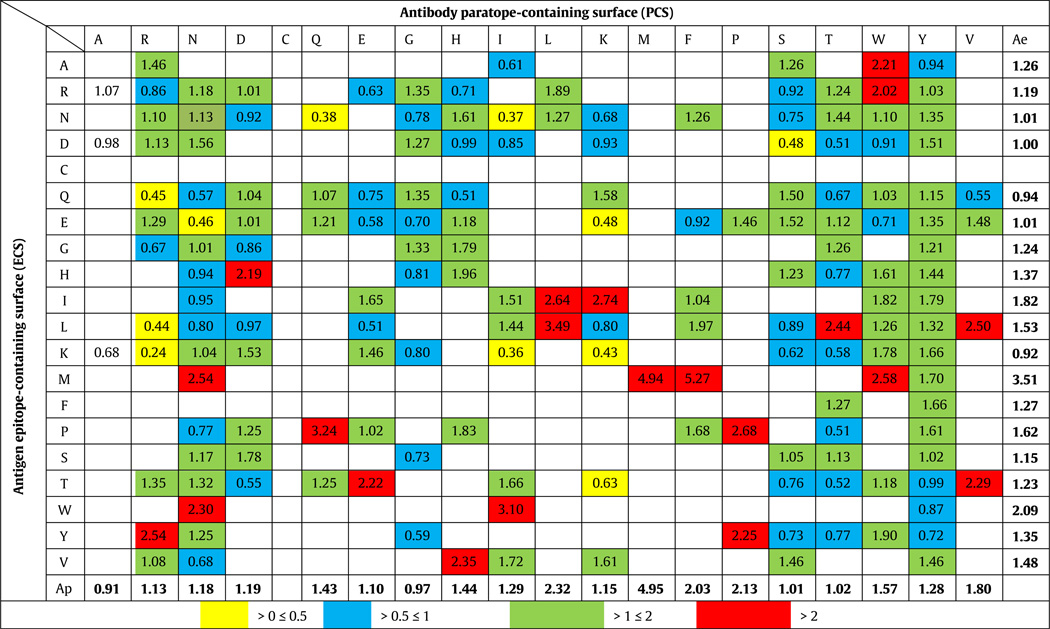
Although the average interaction frequencies computed above take into account the abundance of a particular residue in its interface, they do not take into account the dependence of the interaction frequency on the abundance of its interactive partner in the opposite interface. Thus if there are interactions that occur non-randomly, because there might be an affinity of one type of amino acid for another, we also computed another average, which we term the specific interaction frequency, to normalize the actual or measured interaction frequencies by their expected frequencies resulting from random interactions. In other words, a particular residue on one interface might have a higher interaction frequency with a particular residue on the complementary interface, if the abundance of the latter is higher. This normalization, which we term the specific interaction frequency, would be expected to show whether certain amino acid residues had a propensity for interacting with others in the complementary interface and thus give a second measure of their importance to the interaction. The result of this calculation is presented in Table 4, where the highest to lowest interactions are graded in color, with the highest being red > green > blue > yellow. Some boxes in the table were left blank for statistical considerations, as we report only those values for which there were at least three complexes that contained the ECS or PCS residue pair in question. Of particular interest in this calculation are the highest average specific interaction frequencies for individual amino acid pairs shown in red in Table 4. The top ten highest values are shown in Table 5. These pairings may represent specific propensities for individual amino acid types to interact with one another.
Table 5.
Top ten specific interaction frequencies.
| Ag–Ab | Specific interaction frequency | |
|---|---|---|
| 1 | MET–PHE | 5.3 |
| 2 | MET–MET | 4.9 |
| 3 | LEU–LEU | 3.5 |
| 4 | PRO–GLN | 3.2 |
| 5 | TRP–ILE | 3.1 |
| 6 | ILE–LYS | 2.7 |
| 7 | PRO–PRO | 2.7 |
| 8 | ILE–LEU | 2.6 |
| 9 | MET–TRP | 2.6 |
| 10 | TYR–ARG | 2.5 |
3.5. Substitutability
The selection of phage-displayed random sequence peptides by antibodies recognizing specific protein antigens has long been a fairly reliable way to identify protein antigens and their corresponding ECS [11,53]. Anyone conducting such experiments is usually impressed by the relatedness of the peptide sequences to the protein antigen sequence within a diversity of flanking or intervening sequences. Because such peptides mimic ECS sufficiently to be selected, we have assumed that each peptide selected on the antibody PCS in a sense “reads” a subregion of the PCS, translating 3 dimensional PCS structure information into a one dimensional sequence. The recent analysis of 3 ECS by Irving and colleagues [24] confirms this graphically. In the work of Irving et al., critical binding residues of the consensus peptides derived from phage display analysis of monoclonal antibodies against lysozyme and cytochrome c are shown as they are found in the ECS. Importantly, not all the amino acid residues of the selected peptides correspond to residues on the surface of the ECS. The sequences were interpreted to identify what region of the protein antigen the peptides bind to by linear sequence alignment. Examination of such sequence collections in greater depth may suggest that certain residues could be substituting for others in the linear sequence stretches selected or may be required for conformational compatibility of the peptides with their selection surface, i.e. the PCS. Such analyses also suggest that the contributions of the individual amino acid residues of the PCS and ECS may be identified and quantified. Additionally, some selected peptides may not reflect the linear sequence (mimotopes), but reflect the discontinuous Ag surface. Thus it is important to note that additional structural information may be derived from proximity information of discontinuous Ag segments [9,21].
To help identify which amino acids may substitute for one another, a Pearson product–moment correlation coefficient analysis (see Materials and methods) was performed in Table 3. This correlation analysis shows the degree of residue similarity or substitutability relative to its interaction partners. The results of this analysis are shown in Fig. 5 as heat maps for cross correlations of antibody and antigen residue interactions. The cross correlation between pairs of ECS residues, shown in Fig. 5A, indicates how similar their interactions are with their interactive partners on the PCS. These correlations may be useful in phage display analysis by providing a better weighting of the significance of a particular residue in a phage displayed antibody selected sequence. For example, a low correlation value (reddish) would suggest that a particular residue in the sequence would be less substitutable than the one with a higher value (greenish). The numerical values for these matrices are given in Table A7 (a, b). In Fig. 5B the cross correlations of pairs of PCS residues are also shown.
Fig. 5.

Pearson product–moment correlation coefficients of the ECS and PCS amino acid interaction frequencies (Table 3) and unsupervised hierarchical clustering of the residues. The Pearson product–moment correlation coefficient (A) for the frequency of interaction of residues on the ECS interacting with the PCS residues was largely positive (green), suggesting substitutability and (B) largely negative (red), suggesting interaction specificity, for the frequency of interaction of residues on the PCS with the ECS residues. Black indicates midrange on the respective correlation scales. Unsupervised hierarchical clusterings of the ECS and PCS residues are shown as trees to left of each panel.
The unsupervised hierarchical clustering of amino acids based on this analysis, results in groupings indicative of relatedness as is shown on the left sides of Fig. 5A and 5B. Thus highly related pairs such as TYR and MET, are quite distant vertically from other highly related pairs such as ASP and GLU, shown in Fig. 5A for antigen (ECS) residues. TYR and MET show the least level of promiscuity (most red), having the lowest cross correlation coefficients of all amino acids from the antigen surface and are on distant branches of the dendrogram. The second branch of the dendrogram contains 18 other residues that show much greater levels of similarity in their interaction frequencies with antibody residues. As expected, residues of similar charge such as ASP and GLU are nearest neighbors and exhibit similar patterns of interaction frequencies. The large green area in the upper right of Fig. 5A implies that these antigen (ECS) residues are more promiscuous and thus more substitutable in their interactions with the PCS residues. These results suggest that the appearance of the reddish residues in a phage displayed selected sequence should carry more weight as being a “true” match for the antigen while the greenish residues less so.
The PCS heat map also suggests that the least correlated PCS residues are MET, CYS, PRO, and PHE, although it should be noted that the data for the CYS interactions is sparse. There is a more steady gradation of interaction propensities among the antibody residues, but with TYR showing by far the most contacts and the very high promiscuity. Tyrosine is often present in antibody CDR loop germ line sequences [54], and has previously been shown to play crucial roles in antibody PCS residue contacts with ECS residues as well as playing an important role driving protein–protein interactions in general. Along with ARG, TRP, and ASP, TYR is one of the four amino acid residues identified as most enriched in “hotspot” regions of protein–protein interfaces [32]. TYR has also has been identified as a critical residue in antibody–antigen interactions in both classic [14] and recent studies [54]. Together our findings again confirm the special role of TYR in a broader spectrum of Ab–Ag interactions.
We interpret the correlation analysis to suggest that the least correlated residues preferentially bind only certain residues on the corresponding binding surface and thus by definition engage most strongly in localized specific residue recognition between the antigen and antibody. Lower levels of correlation for PCS residues in general, shown by the larger red regions in the Pearson cross correlation matrix in Fig. 5B, compared to the large green areas in the ECS cross correlation map in Fig. 5A, may reflect a specific quality of the interaction similar to hotspots of antibody interaction with antigen. It would be of interest to examine such effects in Ag–Ab complexes with site directed mutagenesis. Additionally, the large number of highly positively correlated residues in the ECS suggest that a higher level of complexity may be required to achieve full specificity, which may utilize units of two or three residues with specific sequence (i.e. sequence of pairs or triplets is more important than residue properties in predicting ECS from sequence) [38]. This latter notion is supported by the frequent observation that in phage display ECS mapping, recognition is commonly achieved by visual spotting doublet or triplets of sequence that match the antigen sequence being analyzed. These results also suggest that values derived from the correlation may be useful in weighting the contribution of a particular amino acid to an ECS when analyzing antibody selected phage displayed sequence sets in an automated analysis [27]. It would also be of interest to test whether the residues identified as substitutable in an ECS could be exchanged by site directed mutagenesis or in peptide mimetics of the antigen.
3.6. Spatial distribution of amino acids in the interfaces
Another contrasting compositional feature of ECS versus PCS is the difference in the spatial distribution of residue types in the plane of the Ag–Ab interface. The current notion of antibody ECS structure is that the crucial contacts are made near the center of the ECS but that for some antigens, especially larger ones, the contacts become more distributed [37,39,44]. Fig. 6 and Table A6 show the calculated average radial distance from the “geographic” center of amino acids in the ECS (white bars and left column of A6) and correspondingly, for the PCS (gray bars and right column of A6). This value and its standard deviation (Table A6) provide a measure of how broadly the residues are distributed in the interfaces. Immediately evident in Fig. 6 is that the distribution of the PCS residues is almost always (except for TRP and LEU) further from the average center of each respective surface, possibly suggesting some as yet undetermined order (see below) in the way residues in the two surfaces interact. Additionally for the ECS, the low abundance amino acid residues CYS<ILE<MET<ALA<PHE are closest to the ECS center whereas, except for TRP intermediate abundance residues GLY>THR>SER, are furthest from the center. Charged amino acids are in an intermediate range of distances from the center. For the PCS, these trends are not as evident, as the two groups are PHE<TRP<LEU<TYR<HIS (closest) and GLN>GLU>ILE>PRO (furthest).
Fig. 6.

The average distance of amino acid residue type from the average center of the interface regions. White bars represent distances of amino acid residue types from the center of the ECS and gray bars represent distances of amino acid residue types from the center of the PCS.
The distribution of amino acid interactions also suggests that they are distributed evenly over the PCS interface. Based on the calculations from Table 3, there were 3532 interactions in the Ag–Ab interface (not shown). Approximately half of these interactions (1745) are provided by the 6 amino acids closest to the center of the PCS (<9.7 Å). Correspondingly, half the interactions provided by the ECS come from approximately 12 amino acids, CYS<ILE<MET<ALA<PHE<TYR<PRO<ASP<LEU<GLN<LYS<HIS, which are distributed within the same approximate spatial radius mentioned above for the PCS residues. This equivalence suggests that since about half of the total interactions within this inner radius of the PCS come from TYR, that TYR has its greatest influence closer to the center of the Ag–Ab interface, as has be proposed by Mian et al. [14] and others [55]. Additionally since this value of the inner radius also identifies about half the area of a circle with a radius of 12.3 Å, the maximum average value for the most distant PCS residue, this observation also suggests that the interactions per unit area of the PCS for the complex are equivalent in the center and outer half. This observation argues against an overwhelming role of a centrally located interaction. The smaller average size for the ECS implied by the distance distribution is more difficult to interpret, but may suggest that the PCS might also grip the ECS along its edges much like a shallow cup or pie-pan.
3.7. ECS discontinuity
The Ab interface clearly “reads” the Ag surface with a biased set of amino acid residues contained in the 6 CDRs [23]. This arrangement of CDRs indicates that the antibody probes the Ag surface with at least six discontinuous segments of the Ab light and heavy chains. We also examined the degree of discontinuity of the ECS. Fig. 7 shows the distribution complexes having 1 or more gaps in the Ag sequences displayed in the ECS. Cases with 0 gaps (i.e. Group I peptides) were excluded. Our evidence suggests that all Groups II and III Ag examined are discontinuous, having at least one gap of at least 3–4 residues in length, expanding the 90% estimate of Van Regenmortel for protein antigens [17]. For ECS, where the breaks in Ag sequence are at least 3 contiguous residues (white bars Fig. 7), the distribution is bimodal with a major peak at 3 gaps per complex and a minor one at 6 gaps. For the case of 4 or more contiguous residues breaking the Ag sequence, there is only one peak at 2 gaps per complex. Thus since there are on average 14 ± 4 residues per protein (Groups II and III) ECS, then nearly half of all ECS have regions characterized by continuous sequence stretches of 3 or fewer amino acid residues. This is important for the purpose of identification of antigen residues that are part of the ECS from phage-displayed sequences that do not necessarily line up with the linear sequence of the antigen.
Fig. 7.

The distribution of the number of gaps in the epitope with a gap distance of greater than or equal to 3 amino acids (white) and greater than or equal to 4 amino acids (gray). Peptides (Group I) were excluded.
The patterns of ECS discontinuity indeed suggest that selection from phage display of random peptide libraries indirectly codes the three dimensional structure of the antigen. For example, the phage display sequence, PQVRPI, from the anti-p22phox monoclonal antibody 44.1 affinity selection of the J404 nonapeptide phage display library, [56] was persistently observed instead of the natural linear sequence, 183-PQVNPI-188 in the C-terminus. This observation with additional structural analysis of composite peptides, led us to conclude that 29-TAGRF-33 from the amino terminus and 183-PQVNPI-188 of the flavocytochrome b small subunit contributed to the three dimensional Mab 44.1 ECS [9]. Similar observations were made in the analysis of actin ECS of polyclonal antibodies [21].
Our experience spans epitope mapping of more than 30 monoclonal and polyclonal Abs that recognize native proteins and suggests that “unfoldons”, as Laver and colleagues termed them [57] i.e. partially denatured forms of protein Ag recognized by Ab, may be a subset of the species recognized by monoclonal Ab. We were able to isolate fully functional copies of the Ag from immunoaffinity matrices by competition using synthetic peptide whose sequences were derived from Ab-selected phage displayed synthetic peptides. Thus we believe that the “fuzzy” boundaries [57] found in phage displayed peptides may provide additional information about epitope surfaces [9,10,21] because they represent different discontinuous regions of the ECS. Until recently there have been very few attempts by others to examine the relationship between the peptides derived from phage display analysis with discontinuous regions of the epitope-containing surfaces revealed by X-ray crystallography or other structural methods [29–31,58].
4. Conclusions
From our studies of 53 non-redundant Ag–Ab interfaces, we have 1) confirmed certain generalities that were previously extrapolated from much smaller subsets or redundant subsets of structures and 2) have provided additional insights that may help in the understanding of the molecular basis of antibody recognition of protein surfaces. Except for smaller peptides of fewer than 25 amino acid residues, protein ECS appear to be comprised of exclusively discontinuous stretches in antigen primary sequence, with as many as 1–7 gaps in sequence of 3 to 4 or more residues in length. They have maximum dimensions of 28 Å by 21 Å with sufficient convolutions to double the surface area beyond planar, without producing a large amount of dead volume between surfaces. The interface gap volume index range is 1.3, 2.2, and 3.6 for antigen size Groups I through III, respectively, which indicates that the fits are considerably tighter for the smaller antigens. The deviation from planarity is ±2 Å is much less than a typical side chain length, suggesting little side chain interdigitation. For larger antigens, the antibody appears to form a flat cup-like or flat concave surface that utilizes its edges to help hold on to the antigen with multiple interactions, suggesting that the affinity of antibody for ECS results from a distributed interactive structure, including its edges.
The composition of the surfaces is such that at most one or two low occurrence residues per interface, especially MET and PHE provide high interaction frequency contacts that may contribute importantly to antigen recognition. Additionally, the more abundant PCS residues such as TRP and especially TYR, having high interaction frequencies with many types of residues, may provide a structural framework required for recognition and affinity. TYR, indeed as previously observed in a smaller subset of structures, [34,54] plays an especially important role in the PCS. To summarize TYR has
the highest occurrence in the PCS;
the highest occurrence propensity in the PCS, along with PHE and TRP;
the highest number of interactions with epitope residues
one of the highest statistically significant average number of interactions, along with HIS and TRP;
the broadest range of interactions with epitope residues (Tables 3 and 4);
TYR is among the most promiscuous binding Ab residue, along with SER, THR, and GLY in its interactions with Ag amino acid residues.
We interpret these results to suggest that TYR provides multiple contact points that function as pegs or probes positioning the ECS to the PCS by interacting with a multiplicity of residues. The Pearson cross correlation analysis of the ECS shows largely positive cross correlations (indicating high substitutability). The cross correlations for the PCS are significantly more negative (indicating low substitutability and more specificity). Lastly, the Pearson cross correlation values may be applicable for designing substitution matrices to help interpret antibody-selected sequences from random peptide phage libraries for the prediction of the composition and chain folding of ECS. Computational approaches to making folding predictions such as FINDMAP, EPIMAP, and EPIALIGN [10,27,28,59–62], MIMOX [63] and others [29,58,64] may be able to exploit such information in combination with other substitutability matrices such as those previously described [35]. It may be possible to build a biased substitution matrix that is based on a combination of identity, chemical property, or other occurrence frequencies in linear antigenic determinants to help predict protein structure from antibody imprints. Additional studies exploring the effects of using different amino acid residue cutoffs for defining separation distances and exposed surface areas may also be examined to explore the range of parameters measured. We are currently examining these possibilities as well as the incorporation of the cross-correlation information in Fig. 5 to refine and validate our computational approaches to predict epitopes from phage display data.
Supplementary Material
Acknowledgements
This work was supported by National Institutes of Health (NIH) Grants [5R01AI026711-21] and [3R01AI026711-21S1] (to A. J. J.) and [R01 AI 64107], [R01 GM 62547], and [5P20RR024237] (to E. A. D.).
Footnotes
Appendix A. Supplementary data
Supplementary data to this article can be found online at doi:10.1016/j.bbapap.2011.12.007.
References
- 1.Bystroff C, Baker D. Prediction of local structure in proteins using a library of sequence–structure motifs. J. Mol. Biol. 1998;281(3):565–577. doi: 10.1006/jmbi.1998.1943. [DOI] [PubMed] [Google Scholar]
- 2.Bystroff C, Shao Y. Fully automated ab initio protein structure prediction using I-SITES, HMMSTR and ROSETTA. Bioinformatics. 2002;18(Suppl 1):S54–S61. doi: 10.1093/bioinformatics/18.suppl_1.s54. [DOI] [PubMed] [Google Scholar]
- 3.Dandekar T, Argos P. Applying experimental data to protein fold prediction with the genetic algorithm. Protein Eng. 1997;10(8):877–893. doi: 10.1093/protein/10.8.877. [DOI] [PubMed] [Google Scholar]
- 4.Yuan X, Shao Y, Bystroff C. Ab initio protein structure prediction using pathway models. Comp. Funct. Genomics. 2003;4(4):397–401. doi: 10.1002/cfg.305. [DOI] [PMC free article] [PubMed] [Google Scholar]
- 5.Angel TE, et al. Structural waters define a functional channel mediating activation of the GPCR, rhodopsin. Proc. Natl. Acad. Sci. U. S. A. 2009;106(34):14367–14372. doi: 10.1073/pnas.0901074106. [DOI] [PMC free article] [PubMed] [Google Scholar]
- 6.Bennett KL, Matthiesen T, Roepstorff P. Probing protein surface topology by chemical surface labeling, crosslinking, and mass spectrometry. Methods Mol. Biol. 2000;146:113–131. doi: 10.1385/1-59259-045-4:113. [DOI] [PubMed] [Google Scholar]
- 7.Jacobsen RB, et al. Structure and dynamics of dark-state bovine rhodopsin revealed by chemical cross-linking and high-resolution mass spectrometry. Protein Sci. 2006;15(6):1303–1317. doi: 10.1110/ps.052040406. [DOI] [PMC free article] [PubMed] [Google Scholar]
- 8.Jin Lee Y. Mass spectrometric analysis of cross-linking sites for the structure of proteins and protein complexes. Mol. Biosyst. 2008;4(8):816–823. doi: 10.1039/b801810c. [DOI] [PubMed] [Google Scholar]
- 9.Burritt JB, et al. Antibody imprint of a membrane protein surface. Phagocyte flavocytochrome b. J. Biol. Chem. 1998;273(38):24847–24852. doi: 10.1074/jbc.273.38.24847. [DOI] [PubMed] [Google Scholar]
- 10.Bailey BW, et al. Constraints on the conformation of the cytoplasmic face of dark-adapted and light-excited rhodopsin inferred from antirhodopsin antibody imprints. Protein Sci. 2003;12(11):2453–2475. doi: 10.1110/ps.03233703. [DOI] [PMC free article] [PubMed] [Google Scholar]
- 11.Burritt JB, et al. Filamentous phage display of oligopeptide libraries. Anal. Biochem. 1996;238(1):1–13. doi: 10.1006/abio.1996.0241. [DOI] [PubMed] [Google Scholar]
- 12.Amit AG, et al. Three-dimensional structure of an antigen–antibody complex at 2.8 A resolution. Science. 1986;233(4765):747–753. doi: 10.1126/science.2426778. [DOI] [PubMed] [Google Scholar]
- 13.Chothia C, et al. Conformations of immunoglobulin hypervariable regions. Nature. 1989;342(6252):877–883. doi: 10.1038/342877a0. [DOI] [PubMed] [Google Scholar]
- 14.Mian IS, Bradwell AR, Olson AJ. Structure, function and properties of antibody binding sites. J. Mol. Biol. 1991;217(1):133–151. doi: 10.1016/0022-2836(91)90617-f. [DOI] [PubMed] [Google Scholar]
- 15.Barlow DJ, Edwards MS, Thornton JM. Continuous and discontinuous protein antigenic determinants. Nature. 1986;322(6081):747–748. doi: 10.1038/322747a0. [DOI] [PubMed] [Google Scholar]
- 16.Lo Conte L, Chothia C, Janin J. The atomic structure of protein–protein recognition sites. J. Mol. Biol. 1999;285(5):2177–2198. doi: 10.1006/jmbi.1998.2439. [DOI] [PubMed] [Google Scholar]
- 17.Van Regenmortel MHV. Mapping epitope structure and activity: from one-dimensional prediction to four-dimensional description of antigenic specificity. Methods. 1996;9(3):465–472. doi: 10.1006/meth.1996.0054. [DOI] [PubMed] [Google Scholar]
- 18.Bhat TN, et al. Small rearrangements in structures of Fv and Fab fragments of antibody D1.3 on antigen binding. Nature. 1990;347(6292):483–485. doi: 10.1038/347483a0. [DOI] [PubMed] [Google Scholar]
- 19.Boehr DD, Nussinov R, Wright PE. The role of dynamic conformational ensembles in biomolecular recognition. Nat. Chem. Biol. 2009;5(11):789–796. doi: 10.1038/nchembio.232. [DOI] [PMC free article] [PubMed] [Google Scholar]
- 20.Li Y, et al. Three-dimensional structures of the free and antigen-bound Fab from monoclonal antilysozyme antibody HyHEL-63(,) Biochemistry. 2000;39(21):6296–6309. doi: 10.1021/bi000054l. [DOI] [PubMed] [Google Scholar]
- 21.Jesaitis AJ, et al. Actin surface structure revealed by antibody imprints: evaluation of phage-display analysis of anti-actin antibodies. Protein Sci. 1999;8(4):760–770. doi: 10.1110/ps.8.4.760. [DOI] [PMC free article] [PubMed] [Google Scholar]
- 22.Van Regenmortel MH. Antigenicity and immunogenicity of viral proteins. In: Mahy BWJ, Van Regenmortel MHV, editors. Desk Encyclopedia of General Virology. San Diego: Academic Press; 2010. pp. 343–349. [Google Scholar]
- 23.Enshell-Seijffers D, et al. The mapping and reconstitution of a conformational discontinuous B-cell epitope of HIV-1. J. Mol. Biol. 2003;334(1):87–101. doi: 10.1016/j.jmb.2003.09.002. [DOI] [PubMed] [Google Scholar]
- 24.Irving MB, et al. Exploring peptide mimics for the production of antibodies against discontinuous protein epitopes. Mol. Immunol. 2010;47(5):1137–1148. doi: 10.1016/j.molimm.2009.10.015. [DOI] [PMC free article] [PubMed] [Google Scholar]
- 25.Meloen RH, Puijk WC. Slootstra, Mimotopes: realization of an unlikely concept. J. Mol. Recognit. 2000;13(6):352–359. doi: 10.1002/1099-1352(200011/12)13:6<352::AID-JMR509>3.0.CO;2-C. [DOI] [PubMed] [Google Scholar]
- 26.Van Regenmortel MH. What is a B-cell epitope? Methods Mol. Biol. 2009;524:3–20. doi: 10.1007/978-1-59745-450-6_1. [DOI] [PubMed] [Google Scholar]
- 27.Mumey BM, et al. A new method for mapping discontinuous antibody epitopes to reveal structural features of proteins. J. Comput. Biol. 2003;10(3–4):555–567. doi: 10.1089/10665270360688183. [DOI] [PubMed] [Google Scholar]
- 28.Greenbaum JA, et al. Towards a consensus on datasets and evaluation metrics for developing B-cell epitope prediction tools. J. Mol. Recognit. 2007;20(2):75–82. doi: 10.1002/jmr.815. [DOI] [PubMed] [Google Scholar]
- 29.Moreau V, et al. Discontinuous epitope prediction based on mimotope analysis. Bioinformatics. 2006;22(9):1088–1095. doi: 10.1093/bioinformatics/btl012. [DOI] [PubMed] [Google Scholar]
- 30.Huang YX, et al. Pep-3D-Search: a method for B-cell epitope prediction based on mimotope analysis. BMC Bioinforma. 2008;9:538. doi: 10.1186/1471-2105-9-538. [DOI] [PMC free article] [PubMed] [Google Scholar]
- 31.Chen WH, et al. MimoPro: a more efficient Web-based tool for epitope prediction using phage display libraries. BMC Bioinforma. 2011;12:199. doi: 10.1186/1471-2105-12-199. [DOI] [PMC free article] [PubMed] [Google Scholar]
- 32.Bogan AA, Thorn KS. Anatomy of hot spots in protein interfaces. J. Mol. Biol. 1998;280(1):1–9. doi: 10.1006/jmbi.1998.1843. [DOI] [PubMed] [Google Scholar]
- 33.DeLano WL. Unraveling hot spots in binding interfaces: progress and challenges. Curr. Opin. Struct. Biol. 2002;12(1):14–20. doi: 10.1016/s0959-440x(02)00283-x. [DOI] [PubMed] [Google Scholar]
- 34.Fellouse FA, Wiesmann C, Sidhu SS. Synthetic antibodies from a four-amino-acid code: a dominant role for tyrosine in antigen recognition. Proc. Natl. Acad. Sci. U. S. A. 2004;101(34):12467–12472. doi: 10.1073/pnas.0401786101. [DOI] [PMC free article] [PubMed] [Google Scholar]
- 35.Geysen HM, Mason TJ, Rodda SJ. Cognitive features of continuous antigenic determinants. J. Mol. Recognit. 1988;1(1):32–41. doi: 10.1002/jmr.300010107. [DOI] [PubMed] [Google Scholar]
- 36.Jones S, Thornton JM. Principles of protein–protein interactions. Proc. Natl. Acad. Sci. U. S. A. 1996;93(1):13–20. doi: 10.1073/pnas.93.1.13. [DOI] [PMC free article] [PubMed] [Google Scholar]
- 37.MacCallum RM, Martin AC, Thornton JM. Antibody–antigen interactions: contact analysis and binding site topography. J. Mol. Biol. 1996;262(5):732–745. doi: 10.1006/jmbi.1996.0548. [DOI] [PubMed] [Google Scholar]
- 38.Davies DR, Cohen GH. Interactions of protein antigens with antibodies. Proc. Natl. Acad. Sci. U.S.A. 1996;93(1):7–12. doi: 10.1073/pnas.93.1.7. [DOI] [PMC free article] [PubMed] [Google Scholar]
- 39.Sundberg EJ, Mariuzza RA. Molecular recognition in antibody–antigen complexes. Adv. Protein Chem. 2002;61:119–160. doi: 10.1016/s0065-3233(02)61004-6. [DOI] [PubMed] [Google Scholar]
- 40.Chen SW, Van Regenmortel MH, Pellequer JL. Structure–activity relationships in peptide–antibody complexes: implications for epitope prediction and development of synthetic peptide vaccines. Curr. Med. Chem. 2009;16(8):953–964. doi: 10.2174/092986709787581914. [DOI] [PubMed] [Google Scholar]
- 41.Bordo D, Argos P. Evolution of protein cores. Constraints in point mutations as observed in globin tertiary structures. J. Mol. Biol. 1990;211(4):975–988. doi: 10.1016/0022-2836(90)90087-3. [DOI] [PubMed] [Google Scholar]
- 42.Sanner MF, Olson AJ, Spehner JC. Reduced surface: an efficient way to compute molecular surfaces. Biopolymers. 1996;38(3):305–320. doi: 10.1002/(SICI)1097-0282(199603)38:3%3C305::AID-BIP4%3E3.0.CO;2-Y. [DOI] [PubMed] [Google Scholar]
- 43.McConkey BJ, Sobolev V, Edelman M. Quantification of protein surfaces, volumes and atom–atom contacts using a constrained Voronoi procedure. Bioinformatics. 2002;18(10):1365–1373. doi: 10.1093/bioinformatics/18.10.1365. [DOI] [PubMed] [Google Scholar]
- 44.McConkey BJ, Sobolev V, Edelman M. Discrimination of native protein structures using atom–atom contact scoring. Proc. Natl. Acad. Sci. U. S. A. 2003;100(6):3215–3220. doi: 10.1073/pnas.0535768100. [DOI] [PMC free article] [PubMed] [Google Scholar]
- 45.Hafenstein S, et al. Structural comparison of different antibodies interacting with parvovirus capsids. J. Virol. 2009;83(11):5556–5566. doi: 10.1128/JVI.02532-08. [DOI] [PMC free article] [PubMed] [Google Scholar]
- 46.Bahadur RP, Zacharias M. The interface of protein–protein complexes: analysis of contacts and prediction of interactions. Cell Mol. Life Sci. 2008;65(7–8):1059–1072. doi: 10.1007/s00018-007-7451-x. [DOI] [PMC free article] [PubMed] [Google Scholar]
- 47.Reynolds C, Damerell D, Jones S. ProtorP: a protein–protein interaction analysis server. Bioinformatics. 2009;25(3):413–414. doi: 10.1093/bioinformatics/btn584. [DOI] [PubMed] [Google Scholar]
- 48.Rodgers JL, Nicewander WA. 13 ways to look at the correlation-coefficient. Am. Stat. 1988;42(1):59–66. [Google Scholar]
- 49.Ma B, et al. Protein–protein interactions: structurally conserved residues distinguish between binding sites and exposed protein surfaces. Proc.Natl. Acad. Sci. U. S. A. 2003;100(10):5772–5777. doi: 10.1073/pnas.1030237100. [DOI] [PMC free article] [PubMed] [Google Scholar]
- 50.Taylor RM, et al. Site-specific inhibitors of NADPH oxidase activity and structural probes of flavocytochrome b: characterization of six monoclonal antibodies to the p22phox subunit. J. Immunol. 2004;173(12):7349–7357. doi: 10.4049/jimmunol.173.12.7349. [DOI] [PubMed] [Google Scholar]
- 51.Pinilla C, Appel JR, Houghten RA. Functional importance of amino acid residues making up peptide antigenic determinants. Mol. Immunol. 1993;30(6):577–585. doi: 10.1016/0161-5890(93)90032-7. [DOI] [PubMed] [Google Scholar]
- 52.Birtalan S, et al. The intrinsic contributions of tyrosine, serine, glycine and arginine to the affinity and specificity of antibodies. J. Mol. Biol. 2008;377(5):1518–1528. doi: 10.1016/j.jmb.2008.01.093. [DOI] [PubMed] [Google Scholar]
- 53.Scott JK, Smith GP. Searching for peptide ligands with an epitope library. Science. 1990;249(4967):386–390. doi: 10.1126/science.1696028. [DOI] [PubMed] [Google Scholar]
- 54.Koide S, Sidhu SS. The importance of being tyrosine: lessons inmolecular recognition from minimalist synthetic binding proteins. ACS Chem. Biol. 2009;4(5):325–334. doi: 10.1021/cb800314v. [DOI] [PMC free article] [PubMed] [Google Scholar]
- 55.Sidhu SS, et al. Phage-displayed antibody libraries of synthetic heavy chain complementarity determining regions. J. Mol. Biol. 2004;338(2):299–310. doi: 10.1016/j.jmb.2004.02.050. [DOI] [PubMed] [Google Scholar]
- 56.Burritt JB, et al. Topological mapping of neutrophil cytochrome b epitopes with phage-display libraries. J. Biol. Chem. 1995;270(28):16974–16980. doi: 10.1074/jbc.270.28.16974. [DOI] [PubMed] [Google Scholar]
- 57.Laver WG, et al. Epitopes on protein antigens: misconceptions and realities. Cell. 1990;61(4):553–556. doi: 10.1016/0092-8674(90)90464-p. [DOI] [PubMed] [Google Scholar]
- 58.Halperin I, Wolfson H, Nussinov R. SiteLight: binding-site prediction using phage display libraries. Protein Sci. 2003;12(7):1344–1359. doi: 10.1110/ps.0237103. [DOI] [PMC free article] [PubMed] [Google Scholar]
- 59.Greenbaum JA, et al. Towards a consensus on datasets and evaluation metrics for developing B-cell epitope prediction tools. J. Mol. Recognit. 2007;20(2):75–82. doi: 10.1002/jmr.815. [DOI] [PubMed] [Google Scholar]
- 60.Mumey B, et al. Filtering epitope alignments to improve protein surface prediction, Frontiers of High Performance Computing and Networking — ISPA 2006 Workshops. Proceedings. 2006;4331:648–657. [Google Scholar]
- 61.Bailey BW, et al. Constraints on the conformation of the cytoplasmic face of dark-adapted and light-excited rhodopsin inferred from antirhodopsin antibody imprints. Protein Sci. 2003;12(11):2453–2475. doi: 10.1110/ps.03233703. [DOI] [PMC free article] [PubMed] [Google Scholar]
- 62.Mumey B, et al. Mapping discontinuous antibody epitopes to reveal protein structure and changes in structure related to function; Proceedings of the 2003 Ieee Bioinformatics Conference; 2003. pp. 585–586. [Google Scholar]
- 63.Huang J, et al. MIMOX: a web tool for phage display based epitope mapping. BMC Bioinforma. 2006;7:451. doi: 10.1186/1471-2105-7-451. [DOI] [PMC free article] [PubMed] [Google Scholar]
- 64.Schreiber A, et al. 3D-Epitope-Explorer (3DEX): localization of conformational epitopes within three-dimensional structures of proteins. J. Comput. Chem. 2005;26(9):879–887. doi: 10.1002/jcc.20229. [DOI] [PubMed] [Google Scholar]
Associated Data
This section collects any data citations, data availability statements, or supplementary materials included in this article.