

Abstract
Cortical compression can be a significant problem in many types of brain injuries, such as brain trauma, localized brain edema, hematoma, focal cerebral ischemia, or brain tumors. Mechanical and cellular alterations can result in global changes in excitation and inhibition on the neuronal network level even in the absence of histologically significant cell injury, often manifesting clinically as seizures. Despite the importance and prevalence of this problem, however, the precise electrophysiological effects of brain injury have not been well characterized. In this study, the changes in electrophysiology were characterized following sustained cortical compression using large-scale, multielectrode measurement of multiunit activity in primary somatosensory cortex in a sensory-evoked, in vivo animal model. Immediately following the initiation of injury at a distal site, there was a period of suppression of the evoked response in the rat somatosensory cortex, followed by hyper-excitability that was accompanied by an increase in the spatial extent of cortical activation. Paired-pulse tactile stimulation revealed a dramatic shift in the excitatory/inhibitory dynamics, suggesting a longer term hyperexcitability of the cortical circuit following the initial suppression that could be linked to the disruption of one or more inhibitory mechanisms of the thalamocortical circuit. Together, our results showed that the use of a sensory-evoked response provided a robust and repeatable functional marker of the evolution of the consequences of mild injury, serving as an important step toward in vivo quantification of alterations in excitation and inhibition in the cortex in the setting of traumatic brain injury.
Introduction
Focal cortical compression can be a significant problem in many types of brain injuries, such as brain trauma, localized brain edema, hematoma, focal cerebral ischemia, or brain tumors (Watanabe et al., 2001; Chen et al., 2004; Salci et al., 2006; Yang et al., 2006a,b; Zhao et al., 2009). Increased cortical pressure and mechanical deformation of neurons can elevate extracellular potassium (Reinert et al., 2000), alter neuronal firing rates (Maeda and Miyazaki, 1998), and may even lead to delayed neuronal injury (Arundine et al., 2003) or outright cerebral infarction (Marino et al., 2006). Functionally, these mechanical and cellular alterations can result in global changes in excitation and inhibition on the neuronal network level, potentially even manifesting clinically as seizures (Lee et al., 1997; Wang, 2003; Arundine and Tymianski, 2004; Glass et al., 2004; Adamo et al., 2005; Ding et al., 2008). One key element, however, is that imbalances in excitation and inhibition can occur in the absence of histologically significant cell injury (Ding et al., 2008; Yu et al., 2009). Despite brain injury being an enormous problem in young adults in the United States (Baker et al., 2008) and the indication that electrophysiology may be able to detect neuronal dysfunction before cell death or even without detectable cell injury, there is a relative dearth of information on the in vivo electrophysiological effects of brain injury (Sanders et al., 2001; Alves et al., 2005).
In this study, we used large-scale, multielectrode recording of sensory evoked cortical activity in vivo to assess excitatory/inhibitory balance after compression injury to the whisker barrel cortex of rats. Given that the vibrissa-related cortical region occupies a relatively large area of S1 and has a relatively simple topographical map (Woolsey and Van der Loos, 1970; Welker, 1976), the barrel cortex is ideal brain region to probe the functional and electrophysiological effects of brain injury in vivo (Simons and Woolsey, 1979; Simons, 1985; Miller et al., 2001). By recording multiunit spiking activity following repeated single-vibrissa stimulations with a paired-pulse paradigm (Simons and Woolsey, 1979; Simons and Carvell, 1989; Webber and Stanley, 2004; Boloori and Stanley, 2006), our results revealed a period of extreme suppression/inhibition after compression, followed by a gradual recovery of cortical activity, eventually leading to possible hyperexcitability within a 2 h time window following onset of injury. Measurements across the spatial extent of the array suggested there was activation of previously silent intracortical neurons during this period of hyperexcitability. Evaluation of these changes in a relatively acute period following injury could provide insight into electrophysiological mechanisms of neuronal dysfunction. Furthermore, examination of the changes in excitation and inhibition from temporal and spatial perspectives in the acute period following injury can potentially unveil opportunities and avenues for clinical intervention in the early phases after injury.
Materials and Methods
Surgical procedure.
To assess multiunit cortex function and to generate control animals for the injury paradigm, we used 10 male Long–Evans rats (Charles River, 250–350 g). All procedures were approved by the Animal Care and Use Committee at Harvard University and in accordance with National Institutes of Health guidelines. Animals were anesthetized with 1.5–2% vaporized isoflurane before having their heads shaved clean and being transferred to a stereotaxic frame (Kopf Instruments) for surgery. Once secured in the frame, rats continued to receive isoflurane anesthesia at 2%. Vital signs were monitored via a G2 Digital Respiration Monitor (Harvard Apparatus), which allowed for continuous observation of SpO2, heart rate, and qualitative pulse strength. Anesthesia was adjusted to maintain a pulse rate of 350–400 beats per minute throughout the experiment to sustain a constant level of sedation. Body temperature was maintained at 37.5 ± 0.5°C with a feedback-controlled heating pad throughout the procedure (FHC). The animals received a 0.5 ml injection of atropine (0.09 mg/kg) to minimize fluid secretion in the lungs. Following a lidocaine injection into the scalp and sterilization with Betadine, a midline incision was made on the animal's head and the skin flaps were retracted. Connective tissue and muscle were removed to expose the skull surface. A screw was inserted into the right parietal bone of the skull, but not the brain surface, to serve as an electrical ground. A craniotomy was then performed that resulted in the removal of almost the entire parietal bone, exposing both the barrel cortex and leaving enough brain surface exposed to minimize the possibility of inserting the array through bone fragments at the edges of the craniotomy. Following the craniotomy, the dura was left intact and the brain surface was kept moist with frequent addition of saline to the exposed surface.
The connector of the microelectrode array (ICS-96, Cyberkinetics Inc.) was mounted to a stereotaxic positioner. The array was then positioned over the barrel cortex, centered at ∼4 mm laterally from the midline and 1.5 mm posterior from the anterior bregma. Once the array was positioned, the pneumatic array inserter (Cyberkinetics Inc.) was positioned over the array, set to 20 PSI, and triggered to insert the array into the cortical tissue. Following implantation of the array, the animals were allowed to recover for 90 min before recordings were initiated. Preliminary experiments had demonstrated that it would typically take between 5 and 60 min for the spontaneous activity to equilibrate following the array insertion. Thus, 90 min of recovery were given to the animals to ensure that spontaneous neural activity would be at a steady state for the controlled depth of anesthesia. Once the recovery period was complete, the animals underwent the vibrissa stimulation protocol, after which they were killed with an overdose of sodium pentobarbital.
Microelectrode array and electrophysiology.
The microelectrode arrays that we used were 8 × 8 arrays (3.2 mm × 3.2 mm) of silicon electrodes 1 mm in length, 80 μm diameter at each electrode base tapering to 50 μm, with 400 μm spacing (Fig. 1A) and 100–800 kΩ impedance (Cyberkinetics Inc.). Removal of the electrode following the experiment destroyed the tissue, precluding histological verification of the electrode placement. However, the electrode length and recorded activity were commensurate with cortical layer 4, which is ∼700–900 μm below the surface of the cortex and is the primary recipient of thalamic input (Fox, 2002; Petersen, 2007). Multiunit extracellular recordings were obtained using the microelectrode arrays. Neuronal signals were amplified and acquired using a Cerebus 128 channel data acquisition system (Cyberkinetics Inc.) at a sampling rate of 30 kHz for neural spike data. Thresholding was used to identify spike waveforms. Analyses were performed using Neuroexplorer (Nex Technologies) and Matlab (MathWorks).
Figure 1.

Multielectrode array recording of cortical layer 4 response to vibrissa deflection. A, A single vibrissa of the anesthetized rat was deflected in the rostral-caudal plane using a computer-controlled piezoelectric bending actuator (see Materials and Methods). Illustrated is the location of the cortical columns in the contra-lateral hemisphere, below which shows the approximate positioning of the 8 × 8 electrode array within the cortical tissue (400 μm spacing between electrodes). B, The matrix shows the PSTHs recorded from the multielectrode array and compiled over 60 repetitions of single whisker deflection of the C2 whisker (1 ms bin size). These are arranged in a manner corresponding to the electrode layout on the array. The ordinate displays the instantaneous firing rate over a 200 ms time window. The time of the stimulus pulse is denoted by the tick mark in each PSTH. C, Two example channels, denoted 1 and 2 in B. D, Color map of the cortical activation, representing the integrated activity in the 30 ms window following the stimulus.
Verification of microelectrode array positioning.
Since histology could not be performed on the animals, an additional control experiment was performed to assure the microelectrode array did not become displaced as a result of the compression. The array was inserted into phantom tissue, and the focal compression was repeated at the distance from the array insertion site that we used in the in vivo experiments. Optical measurements of the array position were acquired by using a high resolution camera (1280 × 1024 pixels, Tuscen) and a Navitar macrolens. The microelectrode array was inserted into commercially available phantom brain tissue (Smooth-On; 90% thinner and 10% two-part elastomer). The position of the array was measured before and after a 1 mm normal compression was induced 6 mm away from the array insertion site. The images were processed using the Matlab image processing toolbox (MathWorks) to quantify the movement caused by the compression.
Vibrissa stimulation.
Vibrissa stimulation was performed using multilayered piezoelectric bending actuators (range of motion, 1 mm; bandwidth 200 Hz; Polytec PI). Actuators were placed 10 mm away from the animal's face and the whisker was inserted a 4 cm section of 20 μl glass pipette that was fixed to the end of the actuator (∼0.57° per 100 μm deflection). Pulse deflections consisting of exponential rising and falling phases (99% rise time = 99% fall time, 5 ms; amplitude 600 μm) were used to generate whisker movement in the rostral-caudal plane. Actuators were carefully calibrated (Boloori et al., 2010) and actuator control was performed using C++ routines written within the LabWindows software environment (National Instruments). Actuator deflection initially moved vibrissae in the rostral direction before moving them caudally back into their original position. Care was taken to ensure that actuator movement only perturbed the whisker to which it was attached.
Although the C2 vibrissa was typically used for the stimulus protocol and preinjury and postinjury measurements, data were also acquired in response to the stimulation of other vibrissae, showing consistent topographical arrangement. The stimulation protocol for single whiskers consisted of paired-pulse deflections at interdeflection intervals (IDIs) of 50, 80, 100, 150, and 200 ms. Each IDI was presented at 1 Hz (i.e., 1 s between repetitions) with a total of 60 repetitions each. Every set of 60 repetitions created a “stimulus block.” Two minutes of “rest” were allowed between each stimulus block for a particular IDI.
Response measures.
Peristimulus time histograms (PSTHs) were generated using a time resolution (bin size) of 1 ms. Although cortical layer 4 and 5 neurons typically have short thalamic-driven latencies following vibrissa deflection (i.e., <12–15 ms), intracortical contributions can potentially lead to longer latency activity approaching 30 ms (Fox et al., 2003; Higley and Contreras, 2003; Boloori and Stanley, 2006). A 30 ms window poststimulus time window was thus used to quantify the stimulus driven cortical response. The response magnitude was quantified by the average spike count response of the 30 ms poststimulus interval subtracted by the 30 ms interval preceding the stimulus, to remove baseline activity or noise artifact. The “principal channel” was defined as that channel having the largest magnitude in response to the punctate vibrissa deflection. Any channel that demonstrated a peak response >25% of the response magnitude of the principal channel was referred to as “significant,” and was used for subsequent analyses. For visualization, color maps were generated using cubic interpolation across the electrodes, but all analyses were performed on the raw data.
To quantify the attenuation of a test spike count response to its unattenuated (baseline) value, conditioning-test ratio (CTR) curves were generated (Kyriazi et al., 1996, 1998). CTR curves characterize the pairwise interactions between responses to subsequent stimuli. Previous studies in single electrode experiments have fitted CTR curves to sigmoidal functions (Fanselow and Nicolelis, 1999; Webber and Stanley, 2004; Boloori and Stanley, 2006). Thus, the hyperbolic tangent function was used to fit measured normalized CTR curves
 |
where parameters t50 (time to reach 50% of the maximum), and τ were estimated through the Gauss-Newton method (MathWorks). This parameterization is valid only for IDIs >10 ms, which is less than our lowest IDI of 50 ms.
In addition to response magnitude, the temporal characteristics of the response were also studied using latency and vector strength. Latency was defined as the average time delay between the stimulus and evoked spikes and was computed as the center of mass of the PSTH in the 30 ms poststimulus time window. Vector strength (VS) quantifies how strongly the neural spikes lock to the stimulus and therefore present a quantitative method for examining the temporal precision of the response (Higley and Contreras, 2006). VS was computed as
 |
where θi = 2πti/T, ti is the latency of the ith spike relative to the latest stimulus, and T is the duration of the poststimulus response window (30 ms in this case). As can be seen from the equation, a VS of 1 indicates perfect precision (i.e., the response always occurs at exactly the same delay following the stimulus) and 0 indicates that there is no stimulus locking. Having a short time window ensures that the timing and magnitude measures correspond to the same time interval. All error bars represent one SE above and below the mean. Statistical analyses were performed using STATA (StataCorp).
Cortical compression.
Focal cortical compression was created in a manner similar to that in previous studies (Ding et al., 2008). Following the initial vibrissa stimulation protocol, a 1 mm diameter steel cylinder was placed over the compression site and secured to a depth that generated a 1 mm compression on the cortex and maintained for the duration of the experiment. Figure 3A (see below) illustrates the location of the compression site (approximately above the motor cortex) relative to the recording site. Once the cylinder had been inserted to the proper depth, 5 min were allowed to pass before performing the paired-pulse protocol on the C2 whisker, which was repeated once. This process was repeated every 15 min (i.e., first time point was taken at 5 min postinjury, the second time point occurred at 20 min postinjury, etc.) until the final time point was taken at 125 min postcompression. We observed that in many cases, channels exhibiting little or no stimulus-driven activity before injury/compression would become strongly stimulus-driven following compression. The significant channels were thus further categorized as “precompression significant” and “postcompression significant.” Postcompression significant channels were those that were not significant before the compression, but met the significance criteria following the compression. Regarding injury distance from the recording site, this parameter was not systematically explored in this study. There is a growing amount of evidence suggesting neural connections between the barrel and motor cortices in rodents (Urbain and Deschênes, 2007; Aronoff et al., 2010; Sato and Svoboda, 2010). Since the recording site was the barrel cortex, the motor cortex was selected as the injury site as it was more probable that injury to the motor cortex could manifest with a detectable electrophysiological change in the barrel cortex. From a practical perspective, it was also desirable to select an injury site that was separated from the array so as to avoid dislodging the array while creating the focal compression. The effects of injury site location and the distance between injury and recording sites were beyond the scope of this study. However, a small number of experiments were informally performed (data not shown) where the compression site was moved to different cortical regions and the results were grossly similar to those presented in this study in that similar patterns of recovery were observed. This was not formally or thoroughly interrogated and different injury sites could certainly have more subtle effects. This remains an area of potential future investigation.
Figure 3.

Focal compression induces complex evolution of cortical excitability. A, Cortical activity in S1 was recorded before and after tissue above motor cortex was focally compressed (see Materials and Methods). Shown are the relative locations of recording site and compression site. B, The corresponding color map evolution of the cortical response, over the time following sustained focal compression injury. The leftmost image shows the response before induction of injury, where the white grid shows the location of the channels shown in C. The remaining images show the progression of this response in 15 min time intervals. Suppression is normally very evident at 5 min postcompression and in this example, by 50 min postcompression, the response appears to have returned to baseline levels. However, by 125 min postcompression, the response has not only become larger, but has also spread to cover a larger area. C, An example of PSTHs in primary channels for precompression (left), 5 min following compression (middle), and 125 min following compression (right), for C2 vibrissa deflection. Horizontal axis for each spans 200 ms, and the tick mark indicates time of vibrissa deflection.
Results
Multielectrode arrays were used to record neural activity in the vibrissa region of the primary somatosensory cortex of anesthetized rats. Based on known anatomical features, the arrays were positioned approximately as illustrated in Figure 1A, later confirmed through functional mapping. The depth of electrode penetration was commensurate with layer 4 or 5; response latencies confirmed that many of the recordings were likely from layer 4 (see Materials and Methods). A computer controlled piezoelectric bending actuator was used to deliver deflections of a single vibrissa in the rostral-caudal plane while recording evoked responses in cortex, as illustrated in Figure 1A.
Recordings were conservatively labeled as multiunit (i.e., originating from the combined activity of multiple nearby neurons), even though single-unit activity was evident on some of the channels. Figure 1B shows a typical PSTH of the recorded cortical activity following deflection of the C2 vibrissa. Deflections of single vibrissae typically generated activity across multiple electrodes, which, when taking the electrode spacing (400 μm) and cortical column size into account, suggests that multiple columns/barrels were activated from a single vibrissa deflection (Moore and Nelson, 1998; Andermann and Moore, 2006; Kwegyir-Afful and Simons, 2009). Figure 1B shows the PSTH for a typical response to a single, punctate deflection of a single vibrissa (the C2 vibrissa). Each position in the PSTH grid represents the activity recorded from the corresponding electrode as positioned in Figure 1A (bottom), where the horizontal axis of each spans 200 ms, and the tick mark denotes the time of delivery of the vibrissa deflection. A limited set of channels exhibited a well driven response, highlighted with the gray shaded region. For a more detailed observation of the activity, channels labeled 1 and 2 in Figure 1B are shown again in Figure 1C. Channel 1 exhibited the strongest of the observed responses (which we denote the principal channel), with a relatively short latency following the vibrissa deflection. Channel 2 exhibited an example of an attenuated response in the surrounding region, also with a slight temporal delay relative to the response observed in the principal channel. Note that the latencies were consistent with what is typically observed for cortical layer 4 (Ahissar and Zacksenhouse, 2001; Boloori et al., 2010). As a method of visualization, the magnitude of the responses in the 30 ms poststimulus interval were used to generate color maps, as shown for this example recording in Figure 1D. Note that these spatially interpolated color maps were used for visualization only, and that all analyses were performed on the raw data as shown in Figure 1B. A subset of animals (n = 5) was evaluated in the setting of non-injury to serve as controls. The response properties of the neurons were relatively stable over the time course of the typical experiment. The ratio of the response magnitudes (principal channel response at the end of 2 h divided by initial principal channel response) was found to be 1.02 ± 0.06. There was no statistical difference between principal control animal responses and the principal injury animal responses before injury (p = 0.78, unpaired t test). No additional channels became active after 2 h of recording in the non-injury setting.
Paired-pulse vibrissa stimulation
Although assessment of the response to single pulse single whisker stimulation provides a general sense of activity in the pathway, because of the relatively low spontaneous activity in this cortical region, it does not provide a clear picture of relative roles of excitation and inhibition in the cortical circuit. Previous studies have shown that a simple paired-pulse vibrissa stimulation provides a repeatable characterization of the excitatory/inhibitory balance in the pathway (Simons and Woolsey, 1979; Simons and Carvell, 1989; Fanselow and Nicolelis, 1999; Webber and Stanley, 2004; Boloori and Stanley, 2006; Boloori et al., 2010). In this paradigm, the first deflection (Condition) is followed by a second deflection (Test) at a specific IDI with the responses comprised of all significantly active channels. This is illustrated in Figure 2A. Figure 2B shows a typical response in the highly active channels for two interdeflection intervals (50 ms and 80 ms). As in Figure 1B, each PSTH spans 200 ms, and the two tick marks indicate the timing of the two vibrissa deflections. Note that in general, there was an attenuated response to the second pulse relative to the response to the first pulse, even though the two deflections were identical in structure. Figure 2C shows a color map example of changes in the Test response magnitude as the IDIs were changed, where the superimposed grid denotes the set of channels shown in Figure 2B.
Figure 2.
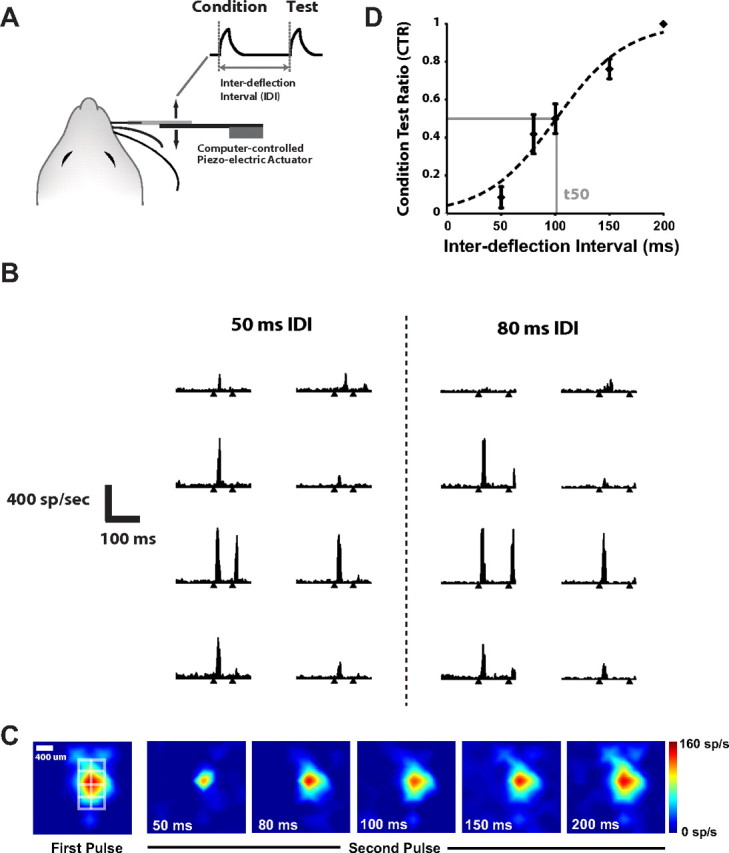
Cortical response to a vibrissa deflection is attenuated by a preceding deflection, as a function of the interdeflection interval. A, In the paired-pulse stimulation paradigm, a single vibrissa was moved in the rostral-caudal plane with the computer-controlled piezoelectric bending actuator. The stimulus, as shown, consisted of a pair of punctate vibrissa deflections (see Materials and Methods) separated by a specific interdeflection interval (IDl). B, Shown are the PSTHs for the stimulus driven channels (and surrounding) for the 50 and 80 ms IDIs. The tick marks denote the times of the deflections. C, Shown is the corresponding color map of the cortical response to the first pulse (left) and the second pulse at varying IDIs (right, IDI indicated on each image in the lower left), where the white grid shows the locations of the channels shown in B. D, CTR curve for average of all of the active channels (n = 10 animals; error bars are ±1 SEM). The data were fit with a hyperbolic tangent function (r2 = 0.94), shown with the dashed curve.
The color map clearly shows the intensity of the test response became suppressed as the IDI was decreased. As a means to quantify this qualitative observation, the CTR was calculated as the ratio of the response magnitude for the Test stimulus to that of the Condition stimulus, as a function of the IDI (Webber and Stanley, 2004; Boloori and Stanley, 2006). Figure 2D shows the CTR curve compiled from the average significant channels over all experiments (n = 10 animals). In each case, the test responses were normalized (see Materials and Methods) to the 200 ms IDI response, which is identical to the response to an isolated deflection. A hyperbolic tangent function was then fitted to these average data, as shown with the dashed curve. This curve captures the observation that for short IDIs, the Test response was typically strongly attenuated, but less so for increasing IDIs, revealing the inhibitory timescale on the order of ∼100 ms (t50 denotes the interdeflection interval for which the response reaches 50% of its maximum value; see Materials and Methods).
Injury response
Following baseline measurements as shown in Figures 1 and 2, injury was induced in each animal through focal compression of cortex rostral to the anterior bregma (see Materials and Methods). The compression site relative to the recording site is shown in Figure 3A. Following compression, the single whisker deflection response magnitude was observed to undergo changes relative to its precompression values.
Figure 3B shows the corresponding color map of the progression for a typical example, revealing a gradual recovery in the response that often exceeded precompression levels later in the recovery period following injury initiation. Figure 3C shows the PSTHs for the 12 channels outlined in by the grid in Figure 3B. The left portion shows the PSTHs for the strongly driven channels (and surround) before the focal compression (Pre-Compression). The middle portion shows the same, 5 min following the compression, exhibiting a nearly completely suppressed response across all channels. The right portion shows the activity 125 min following the compression, exhibiting even larger responses than the Pre-Compression measurements reveal.
We observed that in many cases, channels that did not exhibit significant activity before the compression did so following compression. We thus defined two categories of channels (see Materials and Methods). Precompression significant channels were defined as those that exhibited a significant responsiveness to sensory input before compression (specifically at least 25% of the response magnitude of the principal channel). Postcompression significant channels were those channels that were not precompression significant, but became significant (at least 25% of the response magnitude of the principal channel) following compression. Typically there were 7–11 total channels studied per animal in the injury cohort with approximately one third of those channels being postcompression significant. In the control animals, typically 4–6 channels were studied per animal. There was a difference between how dramatically precompression significant and postcompression significant channels were affected by the focal compression. Figure 4A shows the average magnitudes of the condition response separated by principal channel, precompression significant channels, and postcompression significant channels averaged over the entire cohort (n = 5 animals).
Figure 4.

Injury effects on evoked cortical response. A, Average changes in the three separate channel categories (principal, precompression significant, and postcompression significant) before and after injury (n = 5 animals). B, Same as in A, normalized to the precompression magnitude for each category. The activity on the precompression significant channels tended to eventually become 1.5–2 times higher than baseline, while the postcompression significant channels exhibited even larger relative increases in activity following injury (n = 5, p = 0.004, one-way ANOVA).
On average, there was a separation in absolute magnitude, with the principal channel displaying the highest response, followed by the precompression significant channels, and then the postcompression significant channels with the three groups being significantly different (p < 0.001, one-way ANOVA). Postcompression significant channels typically showed greater increases in their relative levels of activity compared with the principal and precompression significant channels. Figure 4B shows the normalized magnitude, where the groups of channels have been normalized to their preinjury values to highlight changes that result from compression injury. This clearly shows that the responses of postcompression significant channels were increased significantly relative to their baseline values (n = 5, p = 0.004, one-way ANOVA). At the 125 min time point, the principal channel was typically 1.1 ± 0.2 times greater than its baseline value, while the precompression significant channels were typically 1.35 ± 0.4 times greater and the postcompression significant channels were 3.4 ± 0.9 times greater than their baseline values. The increase in magnitude for postcompression significant channels was statistically significant relative to the 2 h magnitude in control animals (p = 0.025, unpaired t test).
Although it is possible insertion of the electrode arrays caused some degree of injury (as does placement of any electrode), this would likely be smaller in magnitude and in any case secondary to the primary injury caused by focal compression that we describe here. Both control and injury animals underwent the same electrode array placement procedure. The only difference between the injury and non-injury cohorts was the presence or absence of focal cortical compression, suggesting the observed differences between the two groups was due to the focal compression and not the array itself. Although use of biomarkers may have shed additional light on this issue, given that there is no universally accepted biomarker for this type of injury, no such assay was used here.
Paired-pulse measures following injury
Although the single deflection results provide a sense of general excitability in the pathway, the paired-pulse probe is necessary to quantify the more subtle dynamics of excitation and inhibition. Using paired-pulse whisker stimulation, the Test response showed an increase in excitation relative to their precompression values. Figure 5A shows the Test response for a 50 ms IDI from a single animal at different time points following injury. As can be seen in the figure, the 50 ms Test response is highly suppressed before injury. However, late in the postinjury period, the 50 ms response became markedly stronger. This suggests the possibility of decreased suppression in the network following injury.
Figure 5.

A paired-pulse stimulation paradigm reveals an evolution of excitation/inhibition balance following injury. A, Progression of the Test response for a 50 ms IDI paired-pulse deflection of the vibrissa. At baseline, there was essentially total suppression of the Test response for this IDI. As injury progressed, a clear response became evident, consistent with a shift in the excitation/inhibition in the circuit with injury. B, Shift in the CTR curve following the induction of injury (n = 5 animals). At each time point relative to injury, the CTR was formed from the activity measured in the principal channels for a range of IDIs, relative to the Condition response. Error bars are ±1 SEM. A hyperbolic tangent function was fit to the data to form the CTR curve (dashed curves, see Materials and Methods). At 125 min following injury, there is a clear leftward shift in the CTR curve, compared with the precompression curve.
Figure 5B displays the shift in the average CTR curve from before compression compared with its CTR curve postcompression (n = 5). The IDI to reach 50% of the maximum, t50, thus became smaller in the left-ward shifted CTR curves, indicating that the maximum level of excitation was reached at smaller IDIs. In this particular cohort, the t50 of the CTR curves became ∼35% smaller at 125 min following the initiation of injury (n = 5 animals).
Timing effects
Given the anatomical connectivity of the thalamocortical circuit, timing of the evoked response and the changes in timing following injury can reveal the origins of the functional changes induced by injury. Figure 6A shows the average latency from the time of stimulus onset to the cortical response of the principal channel responses versus the non-principal channel responses over all of the experiment animals (n = 10 animals), consistent with previous findings in single-electrode studies (Simons, 1985; Simons and Carvell, 1989; Webber and Stanley, 2004; Boloori and Stanley, 2006).
Figure 6.

Cortical response timing and the effects of injury. A, The principal response exhibited a lower latency than the non-principal channels (n = 10 animals, p = 0.00001, unpaired t test). B, The latency of the principal channel was essentially unchanged by injury, as were the latencies of the non-principal channels (n = 5 animals). Note that the precompression significant and postcompression significant channel latencies were very similar even though there was a significant difference between the two groups (p = 0.002, paired t test). C, Vector strength, or spike timing precision in response to stimuli, was typically high (i.e., more stimulus-locked) in the principal channel and lower in the non-principal channels (n = 10, p = 0.02, unpaired t test). D, The vector strength of the principal and precompression significant channels remained relatively constant throughout the postinjury time period. The postcompression significant channel increased in vector strength after the induction of injury (p = 1 × 10⁻⁷, one-way ANOVA).
The latency of the non-principal responses (12.1 ± 0.50 ms) was slightly longer than the principal response (9.2 ± 0.2 ms) on average (p = 0.00001, unpaired t test between the principal and non-principal channel latencies), but both delays fall well within the expected latency range in response to whisker stimulation as previously demonstrated by single electrode experiments (Fox et al., 2003; Webber and Stanley, 2004; Boloori and Stanley, 2006). The latencies for the non-principal channels were greater than for the principal channels, consistent with direct feedforward thalamic drive of the principal channels and more complex thalamocortical interactions for the non-principal channels. Figure 6B shows the average cortical latencies in response to a punctate whisker deflection before and after focal cortical compression (n = 5 animals). The precompression significant and postcompression significant channels had similar latencies throughout the duration of the recording period, with a mean latency of 13.6 ms for postcompression significant channels versus 12.9 ms for precompression significant channels. This difference was small, but statistically significant (p = 0.002, paired t test).
Timing precision of cortical neurons is strongly shaped by the interplay between excitatory and inhibitory elements of the thalamocortical network (Higley and Contreras, 2003, 2006). Vector strength is a measure of response precision and provides a method for quantifying the degree to which the neural response is stimulus-locked. Figure 6C shows the average vector strength in the principal and non-principal channels (n = 10 animals). The principal response displayed a high vector strength (0.80 ± 0.02), indicating a high level of stimulus-locking from the response. The non-principal, but significant channels, also showed an average vector strength (0.64 ± 0.03) that is within the limits observed in single electrode studies (Boloori and Stanley, 2006; Higley and Contreras, 2006), although the vector strength in the non-principal channels was lower and showed more variability than in the principal channel (p = 0.02, unpaired t test). Figure 6D shows the average vector strength values for the cortical response to a punctate whisker deflection for each of the three channel types before and after focal cortical compression (n = 5 animals). The vector strength of the three channel groups have been normalized to their precompression values to highlight their relative changes as a result of exposure to cortical compression. The principal channel displayed very little alteration in its vector strength relative to baseline values after the introduction of injury, while the precompression significant channels exhibited a small drop in vector strength. In contrast, the postcompression significant channels developed a higher vector strength, or more stimulus-locking, relative to their precompression values. The postcompression channels are significantly different from the other channels (p = 1 × 10⁻⁷, one-way ANOVA).
Microelectrode array positioning
The control study with the phantom brain tissue showed displacement of <60 μm as a result of distal compression (see Materials and Methods). Furthermore, there is also strong evidence from our electrophysiological data that the array did not move significantly in response to the focal compression above motor cortex. The latency of the response to whisker deflection was evaluated for all of the recordings as indicated above. Latencies at the conclusion of the experiment were essentially unchanged from the precompression response latency. Significant movements of the array would be expected to generate changes in latency, as neurons in the different cortical layers exhibit different response latencies due to the number of synapses between the periphery and the cells in the layer. Our data showed preservation of response latency, thereby suggesting stable positioning of the electrode array with respect to the cortical lamina.
Discussion
We characterized electrophysiological changes following sustained cortical compression using large-scale, multielectrode measurements in primary somatosensory cortex in a sensory-evoked, in vivo animal model. Immediately following distal injury, there was a period of suppression of the evoked cortical response, consistent with previous observations of a mechanically induced cortical spreading depression wave. Cortical excitability gradually returned to baseline and became significantly higher than precompression values ∼2 h after injury, accompanied by an increase in the spatial extent of cortical activation. Paired-pulse whisker stimulation applied at various time points following injury revealed a dramatic shift in the excitatory/inhibitory dynamics, suggesting a longer term hyperexcitability of the cortical circuit following the initial suppression that could be linked to the disruption of one or more inhibitory mechanisms of the thalamocortical circuit.
Relationship to cortical spreading depression
The most immediate effect of the injury was an initial suppression of the sensory-evoked cortical response. Five minutes postinjury, focal cortical compression initially suppresses activity, potentially over large areas of the brain since the injury site was distal to the recording site. Indeed other models of traumatic brain injury have demonstrated that electrophysiological disruption, especially in the form of spreading depression, can permeate throughout substantial portions of the brain and contribute to neuronal damage (Koistinaho and Chan, 2000; Manor et al., 2008; Hartings et al., 2009). The majority of such work has been done in vitro, with a nonsustained perturbation (e.g., a pin-prick in neural tissue or fluid percussion) (Somjen, 2001; Hartings et al., 2009). Considering neuronal sensitivity to mechanical injury and deformation (Maxwell et al., 1993, 1997), it is highly likely that even a distant focal compression can cause local disruption of ionic homeostasis and spread throughout the rest of the brain (Jefferys, 2003; Larrosa et al., 2006; Longoni and Ferrarese, 2006; Eikermann-Haerter and Moskowitz, 2008).
The evolution of excitability following injury
The longer-term effect of the focal cortical compression was an increase in excitability over ∼2 h, with a dramatic increase in the evoked response magnitude as a “rebound” following the initial postinjury suppression. The initial suppressive effect likely causes a significant imbalance in the ionic homeostasis of the affected regions which possibly causes these areas to become particularly sensitive to new inputs (Strong et al., 2002). For example, Na+ and K+ have been shown to become unbalanced following a depression wave (Somjen, 2001; Church and Andrew, 2005; Takano et al., 2007; Manor et al., 2008). These imbalances could lead to a much lower threshold for depolarization when the next synaptic input arrives, leading to increased sensitivity to the same stimulus. It has been suggested that the suppression of activity and resulting ionic imbalances caused by spreading depression “primes” the brain for hyperexcitability (Welch, 2005; Smith et al., 2006; Berger et al., 2008).
Several studies have attempted to identify the mechanism behind hyperexcitability in the setting of trauma at the synapse level (Topolnik et al., 2003; Bonislawski et al., 2007; Cohen et al., 2007; Avramescu and Timofeev, 2008; Clarkson et al., 2010), frequently with a focus on the hippocampus. Although the studies vary in detail, they generally demonstrate alterations in the GABA receptors, EPSCs, and IPSCs, all of which suggest alterations in the balance between excitation and inhibition. Similarly, there are documented metabolic changes showing alterations in baseline activity as a result of injury (Silver and Erecińska, 1994; Dijkhuizen et al., 2001, 2003; Kim et al., 2005; Takatsuru et al., 2009).
The pathophysiology behind hyperexcitability is clearly quite complex at every level and there has been speculation regarding the roles of synaptic plasticity. The majority of previous studies have focused on days to weeks after the onset of injury, in contrast to the hyperacute period analyzed here, so some caution has to be applied when integrating the results of this study with past results. Although long-term plasticity and synaptic changes almost certainly are key elements in hyperexcitability later in recovery, the changes observed in our study occur in the hyperacute period and are most likely secondary to dramatic changes in the neuronal environment rather than permanent functional changes at the synaptic level (Topolnik et al., 2003; Avramescu and Timofeev, 2008). Furthermore, although fMRI could potentially be used to investigate a similar hyperacute period of recovery, the majority of past studies have examined a substantially later period in recovery. One must also consider fMRI and electrophysiology are not always directly correlated (Kim et al., 2004, 2005).
Injury and the thalamocortical circuit
Previous studies have identified several likely sources for the postexcitatory suppression observed here through paired-pulse stimulation, pointing to thalamocortical origin, since both the primary trigeminal afferents and their downstream brainstem targets do not generally exhibit poststimulus response suppression (Simons, 1985; Sosnik et al., 2001). The intrathalamic feedback loop between the ventro-posteromedial (VPm) nucleus of the thalamus and the nucleus reticularlis thalami (nRT) (Desîlets-Roy et al., 2002) mediates delayed self-inhibition of the thalamic VPm neurons (Spacek and Lieberman, 1974; Harris and Hendrickson, 1987; Pinault et al., 1995). Any response suppression generated by intrathalamic mechanisms is augmented within SI by thalamocortical synaptic depression (Chung et al., 2002). Thalamocortical synapses in layer III depress in response to a stimulus pair (Gil et al., 1997), and similar mechanisms are likely relevant to layer IV thalamocortical synapses. Finally, although not purely a cortical etiology, intracortical mechanisms also play an important part in giving rise to the postexcitatory suppression (Porter and Nieves, 2004; David-Jürgens and Dinse, 2010). Thus the leftward shift in the CTR curve 2 h following injury in Figure 5B likely represents a disruption in one or more of these mechanisms responsible for the postexcitatory suppression.
The increase in this “whisker activated area” following injury could be due to either an increase in thalamocortical inputs to the cortex or increased intracortical interactions (Higley and Contreras, 2003), through the diminution of inhibitory/suppressive influence of one or more of the mechanisms described above. However, the results here suggest a mechanism cortical in nature. In the non-injury case, the principal channels exhibited a whisker response that was both shorter in latency and more precisely stimulus-locked, consistent with direct thalamic drive of cortical layer 4, whereas the non-principal channels exhibited a longer latency and degraded stimulus-locking. The fact that there was no difference in response latency between precompression and postcompression significant channels suggests a cortical origin for the increased activation area following injury. If the larger fields were simply the result of increased thalamic input to the cortex, the latencies for the postcompression significant channels would be shorter than those of the precompression significant channels and more consistent with the thalamically driven principal channels (Simons and Woolsey, 1979; Ebner and Armstrong-James, 1990; Armstrong-James et al., 1992).
One possible explanation for the above phenomenon is similar to the “silent synapse” theory, which proposes that there are many synapses within the brain that are present, but are inactive or silent unless receiving large amounts of input (Voronin and Cherubini, 2003, 2004). It is possible that a disturbance in ionic homeostasis can potentially alter the amount of intracortical excitation reaching these formerly inactive neurons, thereby leading them to become active and increasing the area activated by the whisker. Previous studies have indicated that a single whisker deflection can cause changes in membrane potentials spanning several cortical columns, so the apparent increase in excitation could be a sign of the formerly subthreshold activity becoming sufficiently increased to surpass threshold (Moore and Nelson, 1998; Higley and Contreras, 2003). Given that cortical compression has been shown to produce negligible thalamic effects (Moreira et al., 2007), it is quite possible that the primary channel might be less affected by the injury because it receives synaptic input directly from the thalamus, but this needs to be evaluated directly with thalamic recordings in the context of the injury model used here.
Clinical implications
The observed alterations in E/I balance within the thalamocortical circuit suggest potential future avenues for clinical intervention. A recent study found that there is heightened GABA-mediated inhibition in the peri-infarct zone after stroke in mice (Clarkson et al., 2010), which, when prevented at specific time points, improved infarct size and functional recovery. Although this study may appear to show contradictory results with our findings, it is important to note the time course is substantially different (3, 7, and 14 d after injury) and the electrophysiological portion of the study was performed in vitro. Network contributions could be critical to in vivo electrophysiological activity, which would potentially not be detected in an in vitro study. Furthermore, while the Clarkson et al. study shows increased inhibition, this is at a time point significantly after the hyperacute period we describe, and it is possible that early hyperexcitability evolves into increased inhibition or insufficient excitation. That being stated, this area remains far from clear and there are multiple studies also suggesting potential hyperexcitation at later time points following injury (Fujioka et al., 2004; Misonou et al., 2005; Yang et al., 2007, 2010). Together, these results make it clear that manipulating the pattern of excitation and inhibition could be critical for intervention.
Footnotes
This work was supported by NINDS Grant R01 NS48285.
References
- Adamo PF, Crawford JT, Stepien RL. Subdural hematoma of the brainstem in a dog: magnetic resonance findings and treatment. J Am Anim Hosp Assoc. 2005;41:400–405. doi: 10.5326/0410400. [DOI] [PubMed] [Google Scholar]
- Ahissar E, Zacksenhouse M. Temporal and spatial coding in the rat vibrissal system. Prog Brain Res. 2001;130:75–87. doi: 10.1016/s0079-6123(01)30007-9. [DOI] [PubMed] [Google Scholar]
- Alves OL, Bullock R, Clausen T, Reinert M, Reeves TM. Concurrent monitoring of cerebral electrophysiology and metabolism after traumatic brain injury: an experimental and clinical study. J Neurotrauma. 2005;22:733–749. doi: 10.1089/neu.2005.22.733. [DOI] [PubMed] [Google Scholar]
- Andermann ML, Moore CI. A somatotopic map of vibrissa motion direction within a barrel column. Nat Neurosci. 2006;9:543–551. doi: 10.1038/nn1671. [DOI] [PubMed] [Google Scholar]
- Armstrong-James M, Fox K, Das-Gupta A. Flow of excitation within rat barrel cortex on striking a single vibrissa. J Neurophysiol. 1992;68:1345–1358. doi: 10.1152/jn.1992.68.4.1345. [DOI] [PubMed] [Google Scholar]
- Aronoff R, Matyas F, Mateo C, Ciron C, Schneider B, Petersen CC. Long-range connectivity of mouse primary somatosensory barrel cortex. Eur J Neurosci. 2010;31:2221–2233. doi: 10.1111/j.1460-9568.2010.07264.x. [DOI] [PubMed] [Google Scholar]
- Arundine M, Tymianski M. Molecular mechanisms of glutamate-dependent neurodegeneration in ischemia and traumatic brain injury. Cell Mol Life Sci. 2004;61:657–668. doi: 10.1007/s00018-003-3319-x. [DOI] [PMC free article] [PubMed] [Google Scholar]
- Arundine M, Chopra GK, Wrong A, Lei S, Aarts MM, MacDonald JF, Tymianski M. Enhanced vulnerability to NMDA toxicity in sublethal traumatic neuronal injury in vitro. J Neurotrauma. 2003;20:1377–1395. doi: 10.1089/089771503322686166. [DOI] [PubMed] [Google Scholar]
- Avramescu S, Timofeev I. Synaptic strength modulation after cortical trauma: a role in epileptogenesis. J Neurosci. 2008;28:6760–6772. doi: 10.1523/JNEUROSCI.0643-08.2008. [DOI] [PMC free article] [PubMed] [Google Scholar]
- Baker AJ, Park E, Hare GM, Liu E, Sikich N, Mazer DC. Effects of resuscitation fluid on neurologic physiology after cerebral trauma and hemorrhage. J Trauma. 2008;64:348–357. doi: 10.1097/01.ta.0000245973.71929.db. [DOI] [PubMed] [Google Scholar]
- Berger M, Speckmann EJ, Pape HC, Gorji A. Spreading depression enhances human neocortical excitability in vitro. Cephalalgia. 2008;28:558–562. doi: 10.1111/j.1468-2982.2008.01556.x. [DOI] [PubMed] [Google Scholar]
- Boloori AR, Stanley GB. The dynamics of spatiotemporal response integration in the somatosensory cortex of the vibrissa system. J Neurosci. 2006;26:3767–3782. doi: 10.1523/JNEUROSCI.4056-05.2006. [DOI] [PMC free article] [PubMed] [Google Scholar]
- Boloori AR, Jenks RA, Desbordes G, Stanley GB. Encoding and decoding cortical representations of tactile features in the vibrissa system. J Neurosci. 2010;30:9990–10005. doi: 10.1523/JNEUROSCI.0807-10.2010. [DOI] [PMC free article] [PubMed] [Google Scholar]
- Bonislawski DP, Schwarzbach EP, Cohen AS. Brain injury impairs dentate gyrus inhibitory efficacy. Neurobiol Dis. 2007;25:163–169. doi: 10.1016/j.nbd.2006.09.002. [DOI] [PMC free article] [PubMed] [Google Scholar]
- Chen JR, Wang YJ, Tseng GF. The effects of decompression and exogenous NGF on compressed cerebral cortex. J Neurotrauma. 2004;21:1640–1651. doi: 10.1089/neu.2004.21.1640. [DOI] [PubMed] [Google Scholar]
- Chung S, Li X, Nelson SB. Short-term depression at thalamocortical synapses contributes to rapid adaptation of cortical sensory responses in vivo. Neuron. 2002;34:437–446. doi: 10.1016/s0896-6273(02)00659-1. [DOI] [PubMed] [Google Scholar]
- Church AJ, Andrew RD. Spreading depression expands traumatic injury in neocortical brain slices. J Neurotrauma. 2005;22:277–290. doi: 10.1089/neu.2005.22.277. [DOI] [PubMed] [Google Scholar]
- Clarkson AN, Huang BS, Macisaac SE, Mody I, Carmichael ST. Reducing excessive GABA-mediated tonic inhibition promotes functional recovery after stroke. Nature. 2010;468:305–309. doi: 10.1038/nature09511. [DOI] [PMC free article] [PubMed] [Google Scholar]
- Cohen AS, Pfister BJ, Schwarzbach E, Grady MS, Goforth PB, Satin LS. Injury-induced alterations in CNS electrophysiology. Prog Brain Res. 2007;161:143–169. doi: 10.1016/S0079-6123(06)61010-8. [DOI] [PubMed] [Google Scholar]
- David-Jürgens M, Dinse HR. Effects of aging on paired-pulse behavior of rat somatosensory cortical neurons. Cereb Cortex. 2010;20:1208–1216. doi: 10.1093/cercor/bhp185. [DOI] [PMC free article] [PubMed] [Google Scholar]
- Desîlets-Roy B, Varga C, Lavallée P, Deschênes M. Substrate for cross-talk inhibition between thalamic barreloids. J Neurosci. 2002;22:RC218. doi: 10.1523/JNEUROSCI.22-09-j0002.2002. [DOI] [PMC free article] [PubMed] [Google Scholar]
- Dijkhuizen RM, Ren J, Mandeville JB, Wu O, Ozdag FM, Moskowitz MA, Rosen BR, Finklestein SP. Functional magnetic resonance imaging of reorganization in rat brain after stroke. Proc Natl Acad Sci U S A. 2001;98:12766–12771. doi: 10.1073/pnas.231235598. [DOI] [PMC free article] [PubMed] [Google Scholar]
- Dijkhuizen RM, Singhal AB, Mandeville JB, Wu O, Halpern EF, Finklestein SP, Rosen BR, Lo EH. Correlation between brain reorganization, ischemic damage, and neurologic status after transient focal cerebral ischemia in rats: a functional magnetic resonance imaging study. J Neurosci. 2003;23:510–517. doi: 10.1523/JNEUROSCI.23-02-00510.2003. [DOI] [PMC free article] [PubMed] [Google Scholar]
- Ding MC, Lo EH, Stanley GB. Sustained focal cortical compression reduces electrically-induced seizure threshold. Neuroscience. 2008;154:551–555. doi: 10.1016/j.neuroscience.2008.03.088. [DOI] [PMC free article] [PubMed] [Google Scholar]
- Ebner FF, Armstrong-James MA. Intracortical processes regulating the integration of sensory information. Prog Brain Res. 1990;86:129–141. doi: 10.1016/s0079-6123(08)63172-6. [DOI] [PubMed] [Google Scholar]
- Eikermann-Haerter K, Moskowitz MA. Animal models of migraine headache and aura. Curr Opin Neurol. 2008;21:294–300. doi: 10.1097/WCO.0b013e3282fc25de. [DOI] [PubMed] [Google Scholar]
- Fanselow EE, Nicolelis MA. Behavioral modulation of tactile responses in the rat somatosensory system. J Neurosci. 1999;19:7603–7616. doi: 10.1523/JNEUROSCI.19-17-07603.1999. [DOI] [PMC free article] [PubMed] [Google Scholar]
- Fox K. Anatomical pathways and molecular mechanisms for plasticity in the barrel cortex. Neuroscience. 2002;111:799–814. doi: 10.1016/s0306-4522(02)00027-1. [DOI] [PubMed] [Google Scholar]
- Fox K, Wright N, Wallace H, Glazewski S. The origin of cortical surround receptive fields studied in the barrel cortex. J Neurosci. 2003;23:8380–8391. doi: 10.1523/JNEUROSCI.23-23-08380.2003. [DOI] [PMC free article] [PubMed] [Google Scholar]
- Fujioka H, Kaneko H, Suzuki SS, Mabuchi K. Hyperexcitability-associated rapid plasticity after a focal cerebral ischemia. Stroke. 2004;35:e346–348. doi: 10.1161/01.STR.0000130990.28734.9c. [DOI] [PubMed] [Google Scholar]
- Gil Z, Connors BW, Amitai Y. Differential regulation of neocortical synapses by neuromodulators and activity. Neuron. 1997;19:679–686. doi: 10.1016/s0896-6273(00)80380-3. [DOI] [PubMed] [Google Scholar]
- Glass TF, Reeves B, Sharp FR. The impact of excitotoxic blockade on the evolution of injury following combined mechanical and hypoxic insults in primary rat neuronal culture. Neurobiol Dis. 2004;17:378–384. doi: 10.1016/j.nbd.2004.07.017. [DOI] [PubMed] [Google Scholar]
- Harris RM, Hendrickson AE. Local circuit neurons in the rat ventrobasal thalamus—a GABA immunocytochemical study. Neuroscience. 1987;21:229–236. doi: 10.1016/0306-4522(87)90335-6. [DOI] [PubMed] [Google Scholar]
- Hartings JA, Strong AJ, Fabricius M, Manning A, Bhatia R, Dreier JP, Mazzeo AT, Tortella FC, Bullock MR. Spreading depolarizations and late secondary insults after traumatic brain injury. J Neurotrauma. 2009;26:1857–1866. doi: 10.1089/neu.2009.0961. [DOI] [PMC free article] [PubMed] [Google Scholar]
- Higley MJ, Contreras D. Nonlinear integration of sensory responses in the rat barrel cortex: an intracellular study in vivo. J Neurosci. 2003;23:10190–10200. doi: 10.1523/JNEUROSCI.23-32-10190.2003. [DOI] [PMC free article] [PubMed] [Google Scholar]
- Higley MJ, Contreras D. Balanced excitation and inhibition determine spike timing during frequency adaptation. J Neurosci. 2006;26:448–457. doi: 10.1523/JNEUROSCI.3506-05.2006. [DOI] [PMC free article] [PubMed] [Google Scholar]
- Jefferys JG. Models and mechanisms of experimental epilepsies. Epilepsia. 2003;44(Suppl 12):44–50. doi: 10.1111/j.0013-9580.2003.12004.x. [DOI] [PubMed] [Google Scholar]
- Kim DS, Ronen I, Olman C, Kim SG, Ugurbil K, Toth LJ. Spatial relationship between neuronal activity and BOLD functional MRI. Neuroimage. 2004;21:876–885. doi: 10.1016/j.neuroimage.2003.10.018. [DOI] [PubMed] [Google Scholar]
- Kim YR, Huang IJ, Lee SR, Tejima E, Mandeville JB, van Meer MP, Dai G, Choi YW, Dijkhuizen RM, Lo EH, Rosen BR. Measurements of BOLD/CBV ratio show altered fMRI hemodynamics during stroke recovery in rats. J Cereb Blood Flow Metab. 2005;25:820–829. doi: 10.1038/sj.jcbfm.9600084. [DOI] [PubMed] [Google Scholar]
- Koistinaho J, Chan PH. Spreading depression-induced cyclooxygenase-2 expression in the cortex. Neurochem Res. 2000;25:645–651. doi: 10.1023/a:1007559003261. [DOI] [PubMed] [Google Scholar]
- Kwegyir-Afful EE, Simons DJ. Subthreshold receptive field properties distinguish different classes of corticothalamic neurons in the somatosensory system. J Neurosci. 2009;29:964–972. doi: 10.1523/JNEUROSCI.3924-08.2009. [DOI] [PMC free article] [PubMed] [Google Scholar]
- Kyriazi HT, Carvell GE, Brumberg JC, Simons DJ. Quantitative effects of GABA and bicuculline methiodide on receptive field properties of neurons in real and simulated whisker barrels. J Neurophysiol. 1996;75:547–560. doi: 10.1152/jn.1996.75.2.547. [DOI] [PubMed] [Google Scholar]
- Kyriazi H, Carvell GE, Brumberg JC, Simons DJ. Laminar differences in bicuculline methiodide's effects on cortical neurons in the rat whisker/barrel system. Somatosens Mot Res. 1998;15:146–156. doi: 10.1080/08990229870871. [DOI] [PubMed] [Google Scholar]
- Larrosa B, Pastor J, López-Aguado L, Herreras O. A role for glutamate and glia in the fast network oscillations preceding spreading depression. Neuroscience. 2006;141:1057–1068. doi: 10.1016/j.neuroscience.2006.04.005. [DOI] [PubMed] [Google Scholar]
- Lee KR, Drury I, Vitarbo E, Hoff JT. Seizures induced by intracerebral injection of thrombin: a model of intracerebral hemorrhage. J Neurosurg. 1997;87:73–78. doi: 10.3171/jns.1997.87.1.0073. [DOI] [PubMed] [Google Scholar]
- Longoni M, Ferrarese C. Inflammation and excitotoxicity: role in migraine pathogenesis. Neurol Sci. 2006;27(Suppl 2):S107–S110. doi: 10.1007/s10072-006-0582-2. [DOI] [PubMed] [Google Scholar]
- Maeda M, Miyazaki M. Control of ICP and the cerebrovascular bed by the cholinergic basal forebrain. Acta Neurochir Suppl. 1998;71:293–296. doi: 10.1007/978-3-7091-6475-4_85. [DOI] [PubMed] [Google Scholar]
- Manor T, Barbiro-Michaely E, Rogatsky G, Mayevsky A. Real-time multi-site multi-parametric monitoring of rat brain subjected to traumatic brain injury. Neurol Res. 2008;30:1075–1083. doi: 10.1179/174313208X346107. [DOI] [PubMed] [Google Scholar]
- Marino R, Gasparotti R, Pinelli L, Manzoni D, Gritti P, Mardighian D, Latronico N. Posttraumatic cerebral infarction in patients with moderate or severe head trauma. Neurology. 2006;67:1165–1171. doi: 10.1212/01.wnl.0000238081.35281.b5. [DOI] [PubMed] [Google Scholar]
- Maxwell WL, Watt C, Graham DI, Gennarelli TA. Ultrastructural evidence of axonal shearing as a result of lateral acceleration of the head in non-human primates. Acta Neuropathol. 1993;86:136–144. doi: 10.1007/BF00334880. [DOI] [PubMed] [Google Scholar]
- Maxwell WL, Povlishock JT, Graham DL. A mechanistic analysis of nondisruptive axonal injury: a review. J Neurotrauma. 1997;14:419–440. doi: 10.1089/neu.1997.14.419. [DOI] [PubMed] [Google Scholar]
- Miller KD, Pinto DJ, Simons DJ. Processing in layer 4 of the neocortical circuit: new insights from visual and somatosensory cortex. Curr Opin Neurobiol. 2001;11:488–497. doi: 10.1016/s0959-4388(00)00239-7. [DOI] [PubMed] [Google Scholar]
- Misonou H, Mohapatra DP, Menegola M, Trimmer JS. Calcium- and metabolic state-dependent modulation of the voltage-dependent Kv2.1 channel regulates neuronal excitability in response to ischemia. J Neurosci. 2005;25:11184–11193. doi: 10.1523/JNEUROSCI.3370-05.2005. [DOI] [PMC free article] [PubMed] [Google Scholar]
- Moore CI, Nelson SB. Spatio-temporal subthreshold receptive fields in the vibrissa representation of rat primary somatosensory cortex. J Neurophysiol. 1998;80:2882–2892. doi: 10.1152/jn.1998.80.6.2882. [DOI] [PubMed] [Google Scholar]
- Moreira T, Cebers G, Pickering C, Ostenson CG, Efendic S, Liljequist S. Diabetic Goto-Kakizaki rats display pronounced hyperglycemia and longer-lasting cognitive impairments following ischemia induced by cortical compression. Neuroscience. 2007;144:1169–1185. doi: 10.1016/j.neuroscience.2006.10.054. [DOI] [PubMed] [Google Scholar]
- Petersen CC. The functional organization of the barrel cortex. Neuron. 2007;56:339–355. doi: 10.1016/j.neuron.2007.09.017. [DOI] [PubMed] [Google Scholar]
- Pinault D, Bourassa J, Deschênes M. The axonal arborization of single thalamic reticular neurons in the somatosensory thalamus of the rat. Eur J Neurosci. 1995;7:31–40. doi: 10.1111/j.1460-9568.1995.tb01017.x. [DOI] [PubMed] [Google Scholar]
- Porter JT, Nieves D. Presynaptic GABAB receptors modulate thalamic excitation of inhibitory and excitatory neurons in the mouse barrel cortex. J Neurophysiol. 2004;92:2762–2770. doi: 10.1152/jn.00196.2004. [DOI] [PMC free article] [PubMed] [Google Scholar]
- Reinert M, Khaldi A, Zauner A, Doppenberg E, Choi S, Bullock R. High extracellular potassium and its correlates after severe head injury: relationship to high intracranial pressure. Neurosurg Focus. 2000;8:e10. doi: 10.3171/foc.2000.8.1.2027. [DOI] [PubMed] [Google Scholar]
- Salci K, Nilsson P, Goiny M, Contant C, Piper I, Enblad P. Low intracranial compliance increases the impact of intracranial volume insults to the traumatized brain: a microdialysis study in a traumatic brain injury rodent model. Neurosurgery. 2006;59:367–373. doi: 10.1227/01.NEU.0000222648.61065.38. [DOI] [PubMed] [Google Scholar]
- Sanders MJ, Dietrich WD, Green EJ. Behavioral, electrophysiological, and histopathological consequences of mild fluid-percussion injury in the rat. Brain Res. 2001;904:141–144. doi: 10.1016/s0006-8993(01)02424-6. [DOI] [PubMed] [Google Scholar]
- Sato TR, Svoboda K. The functional properties of barrel cortex neurons projecting to the primary motor cortex. J Neurosci. 2010;30:4256–4260. doi: 10.1523/JNEUROSCI.3774-09.2010. [DOI] [PMC free article] [PubMed] [Google Scholar]
- Silver IA, Erecińska M. Extracellular glucose concentration in mammalian brain: continuous monitoring of changes during increased neuronal activity and upon limitation in oxygen supply in normo-, hypo-, and hyperglycemic animals. J Neurosci. 1994;14:5068–5076. doi: 10.1523/JNEUROSCI.14-08-05068.1994. [DOI] [PMC free article] [PubMed] [Google Scholar]
- Simons DJ. Temporal and spatial integration in the rat SI vibrissa cortex. J Neurophysiol. 1985;54:615–635. doi: 10.1152/jn.1985.54.3.615. [DOI] [PubMed] [Google Scholar]
- Simons DJ, Carvell GE. Thalamocortical response transformation in the rat vibrissa/barrel system. J Neurophysiol. 1989;61:311–330. doi: 10.1152/jn.1989.61.2.311. [DOI] [PubMed] [Google Scholar]
- Simons DJ, Woolsey TA. Functional organization in mouse barrel cortex. Brain Res. 1979;165:327–332. doi: 10.1016/0006-8993(79)90564-x. [DOI] [PubMed] [Google Scholar]
- Smith JM, Bradley DP, James MF, Huang CL. Physiological studies of cortical spreading depression. Biol Rev Camb Philos Soc. 2006;81:457–481. doi: 10.1017/S1464793106007081. [DOI] [PubMed] [Google Scholar]
- Somjen GG. Mechanisms of spreading depression and hypoxic spreading depression-like depolarization. Physiol Rev. 2001;81:1065–1096. doi: 10.1152/physrev.2001.81.3.1065. [DOI] [PubMed] [Google Scholar]
- Sosnik R, Haidarliu S, Ahissar E. Temporal frequency of whisker movement. I. Representations in brain stem and thalamus. J Neurophysiol. 2001;86:339–353. doi: 10.1152/jn.2001.86.1.339. [DOI] [PubMed] [Google Scholar]
- Spacek J, Lieberman AR. Ultrastructure and three-dimensional organization of synaptic glomeruli in rat somatosensory thalamus. J Anat. 1974;117:487–516. [PMC free article] [PubMed] [Google Scholar]
- Strong AJ, Fabricius M, Boutelle MG, Hibbins SJ, Hopwood SE, Jones R, Parkin MC, Lauritzen M. Spreading and synchronous depressions of cortical activity in acutely injured human brain. Stroke. 2002;33:2738–2743. doi: 10.1161/01.str.0000043073.69602.09. [DOI] [PubMed] [Google Scholar]
- Takano T, Tian GF, Peng W, Lou N, Lovatt D, Hansen AJ, Kasischke KA, Nedergaard M. Cortical spreading depression causes and coincides with tissue hypoxia. Nat Neurosci. 2007;10:754–762. doi: 10.1038/nn1902. [DOI] [PubMed] [Google Scholar]
- Takatsuru Y, Fukumoto D, Yoshitomo M, Nemoto T, Tsukada H, Nabekura J. Neuronal circuit remodeling in the contralateral cortical hemisphere during functional recovery from cerebral infarction. J Neurosci. 2009;29:10081–10086. doi: 10.1523/JNEUROSCI.1638-09.2009. [DOI] [PMC free article] [PubMed] [Google Scholar]
- Topolnik L, Steriade M, Timofeev I. Hyperexcitability of intact neurons underlies acute development of trauma-related electrographic seizures in cats in vivo. Eur J Neurosci. 2003;18:486–496. doi: 10.1046/j.1460-9568.2003.02742.x. [DOI] [PubMed] [Google Scholar]
- Urbain N, Deschênes M. A new thalamic pathway of vibrissal information modulated by the motor cortex. J Neurosci. 2007;27:12407–12412. doi: 10.1523/JNEUROSCI.2914-07.2007. [DOI] [PMC free article] [PubMed] [Google Scholar]
- Voronin LL, Cherubini E. “Presynaptic silence” may be golden. Neuropharmacology. 2003;45:439–449. doi: 10.1016/s0028-3908(03)00173-4. [DOI] [PubMed] [Google Scholar]
- Voronin LL, Cherubini E. ‘Deaf, mute and whispering’ silent synapses: their role in synaptic plasticity. J Physiol. 2004;557:3–12. doi: 10.1113/jphysiol.2003.058966. [DOI] [PMC free article] [PubMed] [Google Scholar]
- Wang JH. Short-term cerebral ischemia causes the dysfunction of interneurons and more excitation of pyramidal neurons in rats. Brain Res Bull. 2003;60:53–58. doi: 10.1016/s0361-9230(03)00026-1. [DOI] [PubMed] [Google Scholar]
- Watanabe S, Hoffman JR, Craik RL, Hand PJ, Croul SE, Reivich M, Greenberg JH. A new model of localized ischemia in rat somatosensory cortex produced by cortical compression. Stroke. 2001;32:2615–2623. doi: 10.1161/hs1101.097384. [DOI] [PubMed] [Google Scholar]
- Webber RM, Stanley GB. Nonlinear encoding of tactile patterns in the barrel cortex. J Neurophysiol. 2004;91:2010–2022. doi: 10.1152/jn.00906.2003. [DOI] [PubMed] [Google Scholar]
- Welch KM. Brain hyperexcitability: the basis for antiepileptic drugs in migraine prevention. Headache. 2005;45(Suppl 1):S25–S32. doi: 10.1111/j.1526-4610.2005.4501008.x. [DOI] [PubMed] [Google Scholar]
- Welker C. Receptive fields of barrels in the somatosensory neocortex of the rat. J Comp Neurol. 1976;166:173–189. doi: 10.1002/cne.901660205. [DOI] [PubMed] [Google Scholar]
- Woolsey TA, Van der Loos H. The structural organization of layer IV in the somatosensory region (SI) of mouse cerebral cortex. The description of a cortical field composed of discrete cytoarchitectonic units. Brain Res. 1970;17:205–242. doi: 10.1016/0006-8993(70)90079-x. [DOI] [PubMed] [Google Scholar]
- Yang H, Zhang X, Chopp M, Jiang F, Schallert T. Local fluorouracil chemotherapy interferes with neural and behavioral recovery after brain tumor-like mass compression. Behav Brain Res. 2006a;172:80–89. doi: 10.1016/j.bbr.2006.04.023. [DOI] [PubMed] [Google Scholar]
- Yang H, Chopp M, Jiang F, Zhang X, Schallert T. Interruption of functional recovery by the NMDA glutamate antagonist MK801 after compression of the sensorimotor cortex: implications for treatment of tumors or other mass-related brain injuries. Exp Neurol. 2006b;200:262–266. doi: 10.1016/j.expneurol.2006.02.007. [DOI] [PubMed] [Google Scholar]
- Yang L, Benardo LS, Valsamis H, Ling DS. Acute injury to superficial cortex leads to a decrease in synaptic inhibition and increase in excitation in neocortical layer V pyramidal cells. J Neurophysiol. 2007;97:178–187. doi: 10.1152/jn.01374.2005. [DOI] [PubMed] [Google Scholar]
- Yang L, Afroz S, Michelson HB, Goodman JH, Valsamis HA, Ling DS. Spontaneous epileptiform activity in rat neocortex after controlled cortical impact injury. J Neurotrauma. 2010;27:1541–1548. doi: 10.1089/neu.2009.1244. [DOI] [PubMed] [Google Scholar]
- Yu Z, Elkin BS, Morrison B. Quantification of functional alterations after in vitro traumatic brain injury. Conf Proc IEEE Eng Med Biol Soc. 2009;2009:1135–1138. doi: 10.1109/IEMBS.2009.5332381. [DOI] [PubMed] [Google Scholar]
- Zhao X, Grotta J, Gonzales N, Aronowski J. Hematoma resolution as a therapeutic target: the role of microglia/macrophages. Stroke. 2009;40:S92–94. doi: 10.1161/STROKEAHA.108.533158. [DOI] [PubMed] [Google Scholar]