Abstract
Total Cavopulmonary Connection is the result of a series of palliative surgical repairs performed on patients with single ventricle heart defects. The resulting anatomy has complex and unsteady hemodynamics characterized by flow mixing and flow separation. Although varying degrees of flow pulsatility have been observed in vivo, non-pulsatile (time-averaged) boundary conditions have traditionally been assumed in hemodynamic modeling, and only recently have pulsatile conditions been incorporated without completely characterizing their effect or importance. In this study, 3D numerical simulations with both pulsatile and non-pulsatile boundary conditions were performed for 24 patients with different anatomies and flow boundary conditions from Georgia Tech database. Flow structures, energy dissipation rates and pressure drops were compared under rest and simulated exercise conditions. It was found that flow pulsatility is the primary factor in determining the appropriate choice of boundary conditions, whereas the anatomic configuration and cardiac output had secondary effects. Results show that the hemodynamics can be strongly influenced by the presence of pulsatile flow. However, there was a minimum pulsatility threshold, identified by defining a weighted pulsatility index (wPI), above which the influence was significant. It was shown that when wPI < 30%, the relative error in hemodynamic predictions using time-averaged boundary conditions was less than 10% compared to pulsatile simulations. In addition, when wPI <50, the relative error was less than 20%. A correlation was introduced to relate wPI to the relative error in predicting the flow metrics with non-pulsatile flow conditions.
Keywords: Fontan procedure, Total cavopulmonary connection, Computational fluid dynamics, Pulsatile modeling
1. Introduction
Single ventricle heart defects are present in 2 per 1000 live births. Palliative surgical repairs (Fontan procedure) are usually performed in these patients which commonly result in the total cavopulmonary connection (TCPC), where the systemic inferior vena cava, IVC, and superior vena cava, SVC, are directly routed to the right and left pulmonary arteries (RPA and LPA). Two major options for connecting IVC to PAs are extra-cardiac (EC) and intra-atrial (IA) procedures. In the EC procedure, an artificial conduit is connected outside the heart, while in the IA procedure, a tunnel is constructed through the right atrium. Several modifications have been made to the original Fontan procedure which have increased patient survival; however, long term complications still exist (Mair et al., 2001). These patients have limited exercise tolerance due to poor hemodynamic efficiency and having pumping power of only one ventricle (Brassard et al., 2006; Marsden et al., 2007; Whitehead et al., 2007).
Although the blood flow in these anatomies is unsteady, pulsatility is often neglected when modeling TCPC hemodynamics, and time-averaged flow boundary conditions have traditionally been used. Recent studies have shown that pulsatility could have an effect on the hemodynamic predictions of TCPC when the pulsatility level is high (Marsden et al., 2007). DeGroff et al. and Dur et al. showed that pulsatility led to significant increase in power loss in idealized models (DeGroff and Shandas, 2002; Dur et al., 2010). Synchronized real-time echo data have also been used to study the effect of venous waveform on the efficiency of Fontan circulations (Dur et al., 2011). De Zélicourt showed that in a patient with high flow pulsatility, the non-pulsatile assumption failed to capture the global flow characteristics (De Zélicourt, 2010).
Using time-averaged boundary conditions can reduce experimental and numerical complexity which results in considerable savings in time and resources. However, a clear assessment of the effect of flow pulsatility on TCPC hemodynamics based on a large group of patient data is still missing. The hypothesis for the present study was that there is a threshold for the flow pulsatility amplitude above which the pulsatile nature of the flow has a strong influence on the TCPC hemodynamics, and conversely, under that threshold pulsatility can be neglected without significant errors in predicting the hemodynamic factors. In this work, a systematic numerical study was conducted on patient specific data from the Georgia Tech Fontan database to investigate this hypothesis. Patients with EC and IA TCPC configurations with different IVC and SVC flow pulsatility levels were included. The effects of geometry and flow waveform on the accuracy of the numerical prediction were investigated using both types of boundary conditions.
Materials and Methods
1.1. Patient Cohort
A total of 24 patient specific TCPC cases from Georgia Tech Fontan database were chosen in the present study. 12 IA and 12 EC patients were selected such that they represent different patient specific flow waveforms (e.g. flow rates, or pulsatility level). The patient data are summarized in Table 1. All patients were imaged at the Children’s Hospital of Philadelphia (CHOP). Informed consent was obtained from all patients and all study protocols complied with the Institutional Review Boards of CHOP and the Georgia Institute of Technology.
Table 1.
Patient data
| Case | Age | PI(IVC) % | PI(SVC) % | C.O. (L/min) | % IVC Flow | Re | BSA (m2) |
|---|---|---|---|---|---|---|---|
| EC1 | 8 | 15 | 40 | 3.5 | 50 | 657 | 0.69 |
| EC2* | 4 | 25 | 80 | 1.5 | 61 | 300 | 0.63 |
| EC3 | 4 | 30 | 30 | 2.1 | 52 | 446 | 0.63 |
| EC4 | 21 | 35 | 90 | 3.7 | 76 | 805 | 1.6 |
| EC5* | 6 | 35 | 130 | 3.7 | 83 | 780 | 0.81 |
| EC6 | 9 | 40 | 35 | 2.2 | 61 | 360 | 1.04 |
| EC7 | 3 | 50 | 40 | 1.9 | 57 | 826 | 0.59 |
| EC8 | 8 | 50 | 55 | 3.3 | 63 | 538 | 0.99 |
| EC9 | N/A | 70 | 20 | 2.7 | 40 | 365 | 0.65 |
| EC10* | 18 | 100 | 70 | 4.2 | 60 | 530 | 1.63 |
| EC11 | 3 | 200 | 20 | 1.5 | 24 | 105 | 0.54 |
| EC12 | 5.51 | 270 | 90 | 1.9 | 46 | 321 | 0.75 |
| IA1 | 20 | 20 | 50 | 3.5 | 70 | 535 | 1.54 |
| IA2* | 25 | 20 | 10 | 4.6 | 75 | 834 | 1.6 |
| IA3 | 9 | 30 | 30 | 3.9 | 59 | 578 | 1.18 |
| IA4* | 18 | 30 | 35 | 6.9 | 71 | 1094 | 2.01 |
| IA5 | 16 | 40 | 50 | 2.2 | 71 | 490 | 1.23 |
| IA6 | 10 | 50 | 80 | 3.7 | 58 | 541 | 0.93 |
| IA7 | 10 | 50 | 30 | 4.5 | 61 | 710 | NA |
| IA8 | 8 | 60 | 40 | 2.9 | 50 | 382 | 0.95 |
| IA9 | 10 | 70 | 50 | 2.4 | 70 | 420 | 0.98 |
| IA10 | 4 | 70 | 50 | 2.2 | 53 | 366 | 0.61 |
| IA11 | 14 | 90 | 60 | 2.8 | 58 | 355 | 1.02 |
| IA12 | 7.25 | 190 | 40 | 2.7 | 52 | 360 | 0.94 |
| Mean | 10.5±6 | 68±64 | 51±27 | 3.1±1.2 | 59±13 | 530±220 | 1.0±0.4 |
anatomies with a persistent left SVC
EC: Extra-Cardiac; IA: Intra-Atrial; PI: Pulsatility Index; IVC: Inferior Vena Cava, SVC: Superior Vena Cava; C.O.: Cardiac Output; Re: Reynolds Number; BSA: Body Surface Area; N/A: Not available
1.2. Anatomic reconstruction and Velocity segmentation
Patient specific 3D anatomies and flow conditions were obtained using magnetic resonance imaging (MRI) and phase contrast MRI (PCMRI). The MRI data were gated with the cardiac cycle, and the respiratory effects were not included. The MRI slices were first interpolated using the adaptive control grid interpolation technique, and then segmented using a bouncing ball algorithm. The in vivo 3D geometries were finally obtained by surface fitting performed in Geomagic Studio (Geomagic Inc., NC, USA) (Frakes et al., 2003; Frakes et al., 2008; Frakes et al., 2005). Time-varying velocity fields, from through-plane PCMRI slices, were integrated over vessel cross-sectional areas (e.g. at venae cavae and pulmonary arteries) to calculate the associated flow rates throughout a cardiac cycle (Frakes et al., 2004; Sundareswaran et al., 2009b).
1.3. Computational method
The numerical modeling was conducted using an in-house transient Navier-Stokes solver which has been demonstrated to adequately capture TCPC flow instabilities (De Zélicourt et al., 2009). Briefly, the computational method is based on a sharp interface immersed boundary (IB) approach. In this approach the immersed boundary is recast into an unstructured Cartesian grid to reduce the challenges of meshing the complex TCPC anatomies (De Zélicourt et al., 2009). The spatial discretization scheme is based on a hybrid staggered/non-staggered arrangement. The convective terms are discretized using the upwind difference scheme. A fractional step formulation is used to solve the Navier-Stokes equations. In this method rigid walls are assumed for TCPC and blood is assumed as a single phase Newtonian fluid.
The minimum time steps were 2000 per cardiac cycle, and the Cartesian grid resolution was h=0.02DIVC, where DIVC is the equivalent hydraulic diameter of the IVC. This resolution has been shown to yield mesh insensitive results (De Zélicourt et al., 2009). The pulsatile inflow boundary conditions were taken directly from PCMRI measurements, and imposed as a uniform velocity profile at the inlets (IVC and SVC). To facilitate flow development, extension of 10mm and 50mm were added to the inlets and outlets. Outflow boundary conditions (at the PAs) were prescribed using the in vivo LPA/RPA mass flow splits obtained from PC MRI to ensure mass conservation. In the time-averaged simulations, the mean in vivo flow rates and mass flow splits were applied at the inlet and outlet boundaries, respectively.
1.4. Hemodynamic parameters and power loss
To quantify the inflow waveforms, cardiac output (CO), and IVC Reynolds number (Re) were used. Flow pulsatility was quantified by calculating the pulsatility index (PI) as:
| (1) |
where Q̄i, Qi min and Qi max are the average, minimum and maximum flow rates across vessel i, respectively. In order to better characterize the overall flow pulsatility in TCPC, a weighted pulsatility index, wPI, was defined as:
| (2) |
where n is the total number of inlet vessels, Qmean is the time-averaged total inlet flow, and ci is the flow split of vessel i.
In the present study, power loss and overall flow structures were compared between pulsatile and non-pulsatile simulations. By considering the flow structures, the difference between pulsatile and time-averaged simulations can be recognized qualitatively. Power loss provides a quantitative measure to understand the relative error in applying non pulsatile boundary conditions. Power loss (PL) is defined as the rate at which energy is dissipated in the fluid across the TCPC:
| (3) |
where, ρ, p, v, and Q respectively stand for blood density, hydrostatic pressure, mean velocity, and flow rate across each vessel cross-section. In pulsatile models, this quantity is averaged through a cardiac cycle. The relative error in calculating power loss is quantified by , where P and NP denote pulsatile and non-pulsatile simulations.
1.5. Effect of TCPC geometry and flow waveform
To investigate the relative significance of TCPC geometry and flow waveform on dPL, four TCPC samples with relatively high and low PIs (according to the PI range in Table 1) were studied. First, each TCPC sample was modeled using its patient specific flow waveform and dPL was calculated for both samples. In the next step, the boundary conditions were swapped between two geometries and dPL was calculated. Comparing the calculated dPL in the first and the second steps determines which parameter (geometry or flow waveform) has the dominant effect on dPL. The study was performed on two IA and two EC samples to investigate the effect of TCPC connection type.
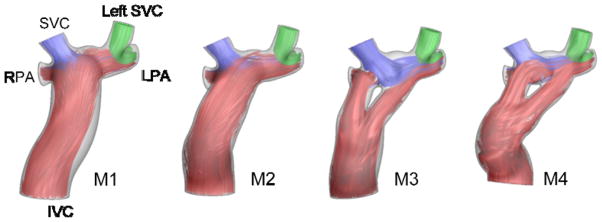
To further investigate this point, four different virtual geometries were modeled using similar flow waveforms (ReIVC=390, C.O. = 2.25 L/min, PI=90). The geometries (IA, EC, and two Y graft designs) were produced using the SURGEM surgical planning tool (Pekkan et al., 2008; Sundareswaran et al., 2009a). Here, only the IVC connection was changed between the four cases and the geometry of other vessels (SVC, left SVC and PAs) was similar in all the cases.
2. Results
2.1. Comparison of pulsatile and non-pulsatile models
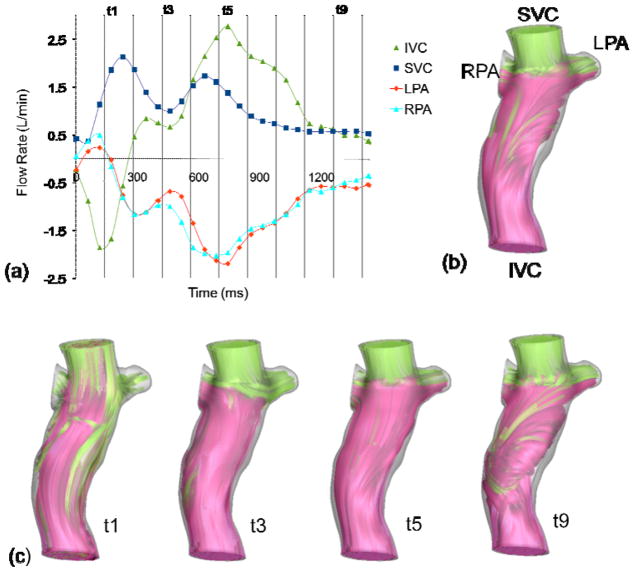
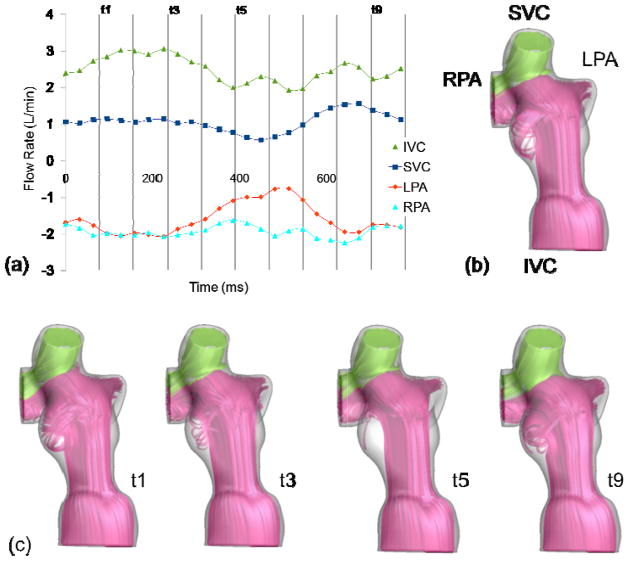
Pulsatility index of each vessel, as defined previously, represents the deviation of a vessel flow rate from its mean value throughout a cardiac cycle. In this section, several simulations were performed to investigate the effect of using non-pulsatile boundary conditions on the accuracy of hemodynamic predictions. To illustrate the findings, the pulsatile and non-pulsatile results obtained for two sample TCPC anatomies were compared; one with a high PIIVC (EC12, Figure 1) and one with a low PIIVC (IA1, Figure 2). The two anatomies have similar geometrical characteristics, with a very small caval offset and head-on collision between IVC and SVC flows, but differ in their PI levels. Pulsatile and non-pulsatile flow structures are illustrated using instantaneous 3D streamtraces color-coded by the vessel of origin.
Figure 1.
Pulsatile flow waveform (a), and streamtraces of EC12 with non-pulsatile (b), and pulsatile (c) boundary conditions
Figure 2.
Pulsatile flow waveform (a), and streamtraces of IA1 with non-pulsatile (b), and pulsatile (c) boundary conditions
In patient EC12, the IVC and SVC flows have similar time-averages (Table 1), but drastically different flow waveforms (Figure 1). The IVC flow features significant pulsatility (PIIVC=270). There is reverse flow in IVC and PAs at the beginning of the cardiac cycle. The IVC flow then increases through the rest of the cycle and reaches its maximum in the middle of the cycle. SVC flow has less fluctuations through the cycle (PISVC=90). Figure 1-b shows flow structures for the time-averaged boundary conditions and Figure 1-c presents time varying flow structures at four different instances in the cardiac cycle. At instant t1, reverse flow is observed in IVC and the pulmonary arteries. The SVC flow is dominant and has penetrated significantly into the IVC baffle. At t3, the SVC flow rate is still higher than the IVC flow rate and most of the IVC flow is directed to RPA. At t5, both IVC and SVC flows are nearly at peak and are distributed to the two PAs uniformly. At t9, IVC and SVC flow rates are equal, effective flow mixing is observed in the baffle, and a uniform flow distribution to PAs is observed. As a result of the high variations in the caval flow rates and their relative contributions, the mean pressure in the different vessels and the power losses vary significantly across the cardiac cycle and their time-averaged values significantly differ from the non-pulsatile ones (Table 2). The calculated power losses from pulsatile and non-pulsatile simulations were 3 and 2 mW, respectively, having dPL=30% difference. The computational time for the model with pulsatile boundary conditions was approximately twice that for the model with time averaged boundary conditions in this case.
Table 2.
Comparison of power loss, PL, and mean static pressure, p, at different vessels between the pulsatile and time averaged models
| EC12 | IA1 | |||
|---|---|---|---|---|
|
| ||||
| Pulsatile | Non- pulsatile | Pulsatile | Non- pulsatile | |
|
|
||||
| PL (mW) | 3 | 2 | 1.4 | 1.4 |
| p_IVC (mmHg) | 0 | 0 | 0 | 0 |
| p_SVC (mmHg) | 0 | 0 | 0 | 0 |
| p_LPA (mmHg) | −2.1 | −1.5 | −0.3 | −0.3 |
| p_RPA (mmHg) | −0.4 | −0.2 | −0.2 | −0.2 |
In comparison, as seen in
Figure 2 and Table 2, the flow structures and average pressures of patient IA1 do not change significantly between pulsatile and non-pulsatile models (PIIVC=20).
-b shows the flow structures for the time-averaged boundary conditions and
-c presents time varying flow structures at four different points in the cardiac cycle. It is observed that IVC flow is always dominant and the SVC flow is mostly directed to the RPA. The calculated average power loss was 1.4 mW for both flow conditions. As summarized in Table 2, the model with time-averaged boundary conditions accurately predicted the hemodynamics in this case.
2.2. Comparing the effect of TCPC geometry and flow waveform
In this section, the relative impact of the TCPC geometry and inflow waveforms on dPL was investigated. All results are summarized in Table 3 in terms of the error made when using the time-averaged boundary conditions (dPL). EC1 and IA1 (PIIVC=15% and 20%, respectively) represent the low pulsatility boundary conditions, while boundary conditions of EC12 and IA12 have high pulsatility (PIIVC=270% and 190%, respectively). The calculated dPL was less than 5% for both EC anatomies with low pulsatility applied, but was more than 30% under highly pulsatile flows. A similar change was observed in IA12 and IA1. The present results suggest that dPL is not significantly dependent on TCPC type. However, dPL is strongly dependent on the inlet flow waveform.
Table 3.
Effect of anatomy and flow waveform on dPL
| TCPC case | EC12 | EC1 | IA12 | IA1 | ||||
|---|---|---|---|---|---|---|---|---|
| PIIVC | 270% | 15% | 190% | 20% | ||||
| Flow Boundary | BC of | BC of | BC of | BC of | BC of | BC of | BC of | BC of |
| Condition (BC) | EC12 | EC1 | EC1 | EC12 | IA12 | IA1 | IA1 | IA12 |
| dPL (%) | 33 | 5 | 2 | 41 | 36 | 5 | 1 | 44 |
Next, four different virtual geometries were modeled using the same flow waveforms as shown in Figure 3. The calculated dPL did not change significantly with respect to change in geometry and was 31%, 29%, 31% and 38% for M1 to M4, respectively.
Figure 3.
Virtual geometrical variations designed on the same SVCs and PAs. Time averaged streamtraces are color-coded with the vessel of origin.
2.3. Effect of cardiac output
The TCPC inlet flow waveforms can be characterized by cardiac output, which is the mean flow rate, and the pulsatility index, which is a measure of flow fluctuations from the mean value. For a given TCPC, a higher cardiac output results in higher power losses. Here, keeping the PI constant, the effect of increased cardiac output (simulated exercise condition) on dPL was investigated (Table 4). Exercise condition is usually modeled/simulated considering 2 and 3 times increase in the resting IVC flow rate (Marsden et al., 2007; Whitehead et al., 2007). It is observed that the order of magnitude of dPL does not change with increasing the flow rate. It suggests the higher impact of flow fluctuations, PI, on determining dPL compared to the impact of mean flow rate.
Table 4.
Effect of mean flow rate on dPL
| dPL | |||
|---|---|---|---|
| TCPC case | Rest | Light exercise (QIVC × 2) | Medium exercise (QIVC × 3) |
| EC12 | 33% | 45% | 47% |
| EC1 | 2% | 6% | 2% |
| IA1 | 1% | 3% | 6% |
2.4. Effect of flow pulsatility
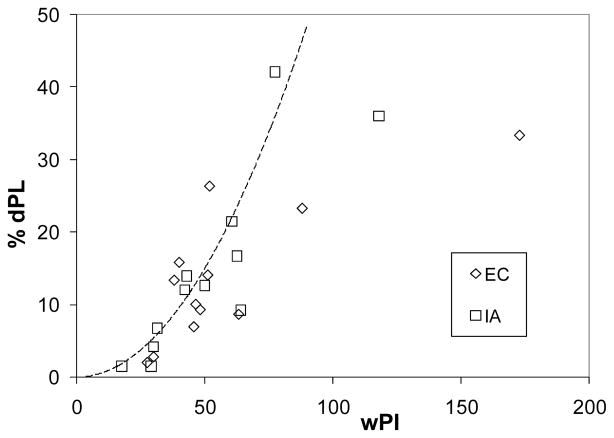
Figure 4 shows dPL versus flow pulsatility for all the patients listed in Table 1. As discussed before, dPL is generally higher in the samples with higher PI. It is observed that when flow pulsatility is small (wPI < 30), time-averaged boundary conditions can be used with a relatively small inaccuracy (dPL < 10%). On the other hand, when wPI > 50, the inaccuracy is higher (dPL > 20%). These thresholds can provide guidelines for selecting the most efficient modeling technique for future studies depending on the required accuracy of a specific study. Having patient specific wPI, the expected level of accuracy (here quantified by %dPL) of a non-pulsatile technique can be estimated. The following correlation between dPL and wPI can be derived based on the presented results for low and medium flow pulsatility levels, wPI < 100:
| (4) |
Figure 4.
Effect of flow pulsatility on dPL
At higher pulsatility levels, wPI > 100, the relative error can be large (dPL > 30% for the present datasets).
3. Discussion
In the previous sections, it was shown that flow waveform has the primary effect on dPL. Although the mean cardiac flow rate affects the power loss, it does not change dPL significantly, when PI is maintained constant. The present results showed that the fluctuations in the flow waveform in a cardiac cycle have the largest effect on dPL. PI was used to characterize the time varying patient specific flow waveforms, and it was used to derive a correlation for dPL. When flow pulsatility is high, there are larger fluctuations in the flow, which can cause discrepancies between the results from pulsatile and steady simulations. To investigate which is the most representative index for this effect, two of the possibilities were: (i) selecting the highest PI of inlet vessels, or (ii) taking the average values of inlet PIs. However, as shown in Table 1, PI and flow rates can be different in each of the inlet vessels. In some cases, a vessel with higher PI may provide a lower fraction of the cardiac flow and therefore its overall effect on dPL may not be significant. Therefore, a weighted pulsatility index, wPI, was defined.
A correlation between dPL and wPI was suggested based on the present results. This correlation can be combined with existing correlations for PL (such as the correlation derived by Dasi et al. (Dasi et al., 2008)), to estimate PL which can be useful when detailed simulations are not necessary or applicable.
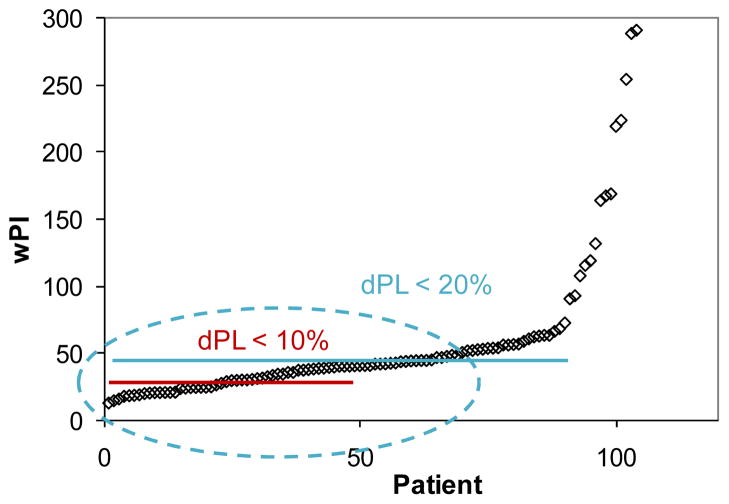
Figure 5 presents the pulsatility indices of more than 100 TCPC patients in the Georgia Tech database. It is observed that in approximately 30% of patients pulsatility is in the lower range (wPI <30). Therefore, at least in one third of the TCPC cases, using time-averaged boundary conditions would result in less than 10% relative error in calculating power loss. In addition, it is observed that in approximately 60% of TCPC patients, wPI < 50. The present results predict that the relative error, dPL, is less than 20% for these cases, showing the significance of identifying these thresholds. As an example application, surgical planning for Fontan patients usually requires several numerical simulations for different surgical options. In addition, surgical planning cases usually require quick, while reliable, results. Based on the results of the present work, the cases for which the simplifying flow assumptions can be reliably used can quickly be identified, saving a considerable amount of time while maintaining accuracy.
Figure 5.
Distribution of pulsatility indices in the Georgia Tech database
It should be noted that the suggested thresholds are for IA and EC TCPC anatomies. The results may not be generalized to other anatomies (such as a large atriopulmonary connection or a persistent left SVC to a large coronary sinus connection) without further study. A large sinus baffle can act as a reservoir which damps the flow oscillations caused by pulsatile inflows.
In the computations, rigid walls are assumed for TCPC and blood is modeled as a single phase Newtonian fluid. It has recently been shown that there is a small effect of wall motion on time averaged energy loss (Long et al., 2012), however geometrical parameters may have more significant effect on dPL if a compliant TCPC model is considered. Although the current modeling methods often ignore wall motion, this point should be considered in future studies.
4. Conclusions
The validity of applying steady flow boundary conditions in modeling EC and IA TCPC anatomies was investigated. The results show that when PI of venae cavae is large, the accuracy of hemodynamic predictions can be strongly affected by using time-averaged boundary conditions. Weighted pulsatility index (wPI) was introduced to identify the relative error in TCPC hemodynamic simulations. For the patients included in this study, the relative error in calculating power loss was less than 10 and 20% when wPI was less than 30 and 50%, respectively. These thresholds provide guidelines for identifying the appropriate type of boundary conditions for future studies of TCPC hemodynamics, based on the desired level of accuracy. Investigating more than 100 datasets of Fontan patients, it was found that wPI<50% in about 60% of patients, confirming that using the guidelines described in this paper, can result in considerable savings in time and computational resources.
Acknowledgments
This study was supported by the National Heart, Lung, and Blood Institute Grants HL67622 and R01HL098252.
Footnotes
Conflict of interest statement
There is no conflict of interest.
Publisher's Disclaimer: This is a PDF file of an unedited manuscript that has been accepted for publication. As a service to our customers we are providing this early version of the manuscript. The manuscript will undergo copyediting, typesetting, and review of the resulting proof before it is published in its final citable form. Please note that during the production process errors may be discovered which could affect the content, and all legal disclaimers that apply to the journal pertain.
References
- Brassard P, Bedard E, Jobin J, Rodes-Cabau J, Poirier P. Exercise capacity and impact of exercise training in patients after a Fontan procedure: a review. Can J Cardiol. 2006;22:489–495. doi: 10.1016/s0828-282x(06)70266-5. [DOI] [PMC free article] [PubMed] [Google Scholar]
- Dasi LP, Pekkan K, Katajima HD, Yoganathan AP. Functional analysis of Fontan energy dissipation. J Biomech. 2008;41:2246–2252. doi: 10.1016/j.jbiomech.2008.04.011. [DOI] [PMC free article] [PubMed] [Google Scholar]
- De Zélicourt D. PhD Thesis. Georgia Institute of Technology; Atlanta: 2010. Pulsatile Fontan hemodynamics and patient-specific surgical planning: a numerical investigation. [Google Scholar]
- De Zélicourt D, Ge L, Wang C, Sotiropoulos F, Gilmanov A, Yoganathan AP. Flow Simulations in Arbitrarily Complex Cardiovascular Anatomies - an Unstructured Cartesian Grid Approach. Computers & Fluids. 2009;38:1749–1762. [Google Scholar]
- DeGroff CG, Shandas R. Designing the optimal Total Cavopulmonary Connection: pulsatile versus steady flow experiments. Medical Science Monitor. International Medical Journal Of Experimental And Clinical Research. 2002;8:MT41–MT45. [PubMed] [Google Scholar]
- Dur O, DeGroff CG, Keller BB, Pekkan K. Optimization of inflow waveform phase-difference for minimized total cavopulmonary power loss. Journal of Biomechanical Engineering. 2010;132 doi: 10.1115/1.4000954. [DOI] [PubMed] [Google Scholar]
- Dur O, Kocyildirim E, Soran O, Wearden P, Morell V, Degroff C, Pekkan K. Pulsatile venous waveform quality affects the conduit performance in functional and “failing” Fontan circulations. Cardiology in the young. 2011;1 doi: 10.1017/S1047951111001491. [DOI] [PubMed] [Google Scholar]
- Frakes D, Smith M, de Zelicourt D, Pekkan K, Yoganathan A. Three-dimensional velocity field reconstruction. J Biomech Eng. 2004;126:727–735. doi: 10.1115/1.1824117. [DOI] [PubMed] [Google Scholar]
- Frakes DH, Conrad CP, Healy TM, Monaco JW, Fogel M, Sharma S, Smith MJ, Yoganathan AP. Application of an adaptive control grid interpolation technique to morphological vascular reconstruction. IEEE Trans Biomed Eng. 2003;50:197–206. doi: 10.1109/TBME.2002.807651. [DOI] [PubMed] [Google Scholar]
- Frakes DH, Dasi LP, Pekkan K, Kitajima HD, Sundareswaran K, Yoganathan AP, Smith MJ. A new method for registration-based medical image interpolation. IEEE Trans Med Imaging. 2008;27:370–377. doi: 10.1109/TMI.2007.907324. [DOI] [PubMed] [Google Scholar]
- Frakes DH, Smith MJ, Parks J, Sharma S, Fogel SM, Yoganathan AP. New techniques for the reconstruction of complex vascular anatomies from MRI images. J Cardiovasc Magn Reson. 2005;7:425–432. doi: 10.1081/jcmr-200053637. [DOI] [PubMed] [Google Scholar]
- Long C, Hsu M, Bazilevs Y, Feinstein J, Marsden A. Fluid–structure interaction simulations of the Fontan procedure using variable wall properties. International Journal for Numerical Methods in Biomedical Engineering. 2012 doi: 10.1002/cnm.1485. [DOI] [PubMed] [Google Scholar]
- Mair DD, Puga FJ, Danielson GK. The Fontan procedure for tricuspid atresia: early and late results of a 25-year experience with 216 patients. J Am Coll Cardiol. 2001;37:933–939. doi: 10.1016/s0735-1097(00)01164-5. [DOI] [PubMed] [Google Scholar]
- Marsden AL, Vignon-Clementel IE, Chan FP, Feinstein JA, Taylor CA. Effects of exercise and respiration on hemodynamic efficiency in CFD simulations of the total cavopulmonary connection. Annals of Biomedical Engineering. 2007;35:250–263. doi: 10.1007/s10439-006-9224-3. [DOI] [PubMed] [Google Scholar]
- Pekkan K, Whited B, Kanter K, Sharma S, de Zelicourt D, Sundareswaran K, Frakes D, Rossignac J, Yoganathan AP. Patient-specific surgical planning and hemodynamic computational fluid dynamics optimization through free-form haptic anatomy editing tool (SURGEM) Med Biol Eng Comput. 2008;46:1139–1152. doi: 10.1007/s11517-008-0377-0. [DOI] [PubMed] [Google Scholar]
- Sundareswaran K, de Zélicourt D, Sharma S, Kanter K, Spray T, Rossignac JR, Sotiropoulos F, Fogel M, Yoganathan AP. Correction of pulmonary arteriovenous malformation using image based surgical planning. JACC Imaging. 2009a doi: 10.1016/j.jcmg.2009.03.019. [DOI] [PMC free article] [PubMed] [Google Scholar]
- Sundareswaran K, Frakes D, Fogel M, Soerensen D, Oshinski JN, Yoganathan A. Optimum fuzzy filters for phase-contrast magnetic resonance imaging segmentation. Journal of Magnetic Resonance Imaging. 2009b;29:155–165. doi: 10.1002/jmri.21579. [DOI] [PMC free article] [PubMed] [Google Scholar]
- Whitehead KK, Pekkan K, Kitajima HD, Paridon SM, Yoganathan AP, Fogel MA. Nonlinear power loss during exercise in single-ventricle patients after the Fontan: insights from computational fluid dynamics. Circulation. 2007;116:I165–171. doi: 10.1161/CIRCULATIONAHA.106.680827. [DOI] [PubMed] [Google Scholar]


