Abstract
Antigen cross-presentation is a principal function of specialized antigen-presenting cells of bone marrow origin such as dendritic cells. While these cells are sometimes known as “professional” antigen-presenting cells, non-bone marrow derived cells may also act as antigen-presenting cells. Here, using four-way liver cell isolation and parallel comparison of candidate antigen presenting cells, we show that depending on the abundance of antigen-donor cells, different subsets of liver cells could cross-present a hepatocyte-associated antigen. This function was observed in both liver sinusoidal endothelial cells and Kupffer cells even at very low antigen concentration, as well as when using soluble protein. Antigen cross-presentation by liver cells induced efficient CD8+ T cell proliferation in a similar manner to classical dendritic cells from spleen. However, proliferated cells expressed lower level of T-cell activation markers and intracellular interferon-gamma levels. In contrast to classical spleen dendritic cells, cross-presentation by liver antigen presenting cells was predominantly dependent on Intercellular Adhesion Molecule-1.
Conclusion
Hepatic sinusoids are an environment rich in antigen cross-presenting activity. However the liver's resident antigen-presenting cells cause partial T-cell activation. These results clarify how the liver can act as a primary site of CD8+ T-cell activation, and why immunity against hepatocyte pathogens is sometimes ineffective
Keywords: Liver sinusoidal endothelial cells, Kupffer cells, Stellate cells, CD8+ T cells, Liver immunology
Introduction
Specialized antigen presenting cells (APCs) such as dendritic cells (DCs) are capable of capturing exogenous antigens from other cells and indirectly presenting them on class I MHC molecules, a capacity that has been referred to as “antigen cross-presentation”. Such cross-presentation plays an essential role in the induction of effective cytotoxic T lymphocyte (CTL) immunity to various antigens, including minor histocompatibility antigens, tumor-associated antigens, and viral antigens, a process referred to as “cross-priming” (1, 2).
Inflammation and poor immunity are characteristic of many liver infections. The persistence of liver pathogens is often accompanied by a weak CD8+ T cell response to hepatocellular antigens (3), in part because liver pathogens subvert antigen presentation mechanisms (4). However cross-presentation can allow the antigen to be presented by a non-infected, and thus non-subverted cell. In addition, weak CD8+ T cell responses can be augmented by CD4+ T cell help (5). Hepatocytes are the main target of liver pathogens and lack MHC class II antigen presentation. In this situation, cross-presentation on an MHC class II positive APC could also allow the priming of CD4+ T-cells. Therefore, cross-presentation of antigen, whether on bone marrow-derived cells or on non-hematopoietic APCs, is likely to be critical in determining the outcome of hepatocellular infection.
Non-parenchymal liver cells include liver sinusoidal endothelial cells (LSECs), Kupffer cells (KCs), and hepatic stellate cells (HSCs). These subsets of liver cells have been shown to present antigens to T cells (6, 7), and may be responsible for delivery of either tolerogenic or immunogenic signals to T cells. Soluble ovalbumin (OVA) protein has been used to investigate liver antigen presentation (8-10); however the more relevant forms of antigens in vivo may be cell-associated. Cross-presentation of soluble antigens can occur in stable early or in recycling endosomes, while cell-associated proteins engage phagosomes and late endosomes where they are temporally separated from MHC class II loading (11, 12). Illustrating this distinction, mannose receptor deficient DCs show impaired endocytosis of soluble OVA and abrogated antigen presentation, while their uptake of cell-associated OVA and activation of T cells was unaffected(13).
In this study, we investigate the relative capacity of different liver APCs to engage in direct presentation, cross-presentation of soluble antigens and cross-presentation of cellular antigens. Our results show that many liver cells can cross-present antigens and induce T-cell proliferation. However, cross-presentation by liver APCs induces partial T cell activation, which is dependent on Intercellular Adhesion Molecule-1 (ICAM-1) expression. These results support a model of liver immunity that achieves primary T-cell activation but fails to induce an effective immune response.
Materials and Methods
Mice
Eight to ten week old C57BL/6 wild type, OVA transgenic, ICAM-1 deficient, OVA-specific H-2Kb-restricted TCR transgenic (OT-I), and B6.C-H-2bm8 (bm8) mice were used in accordance with Institutional Animal Care and Use Committee guidelines.
Cell isolations
Candidate liver APCs were isolated to high purity using a novel multistep isolation technique (Figure S1). Spleen mDCs were isolated using magnetic antibody cell sorting against CD11c (MACS, Miltenyi Biotec). CD8+ T cells were isolated from spleen and peripheral lymph nodes of OT-1 mice as described previously(14). Following isolation, OT-1 CD8+ T cells were labeled with 0.7 mM carboxy-fluorescein-succinimidyl-ester (CFSE) and used in antigen presentation experiments. Antibody use is described in the supplemental information.
Antigen cross-presentation experiments
For studying antigen cross-presentation, 2.5 × 10⁴ isolated liver APCs or spleen DCs were seeded in 96-well round-bottom plates, and soluble ovalbumin (OVA) protein (final concentration of 100 μg/ml, grade VII) was added. On the following day, OT-I CD8+ T-cells were isolated, CFSE labeled, and added to the cultures at 105 cells per well. In antibody blocking experiments, antibodies (10 μg/ml) were added 1 hr before the OT-I CD8+ T cells. For cross-presentation from bm8-OVA hepatocytes, one day before isolation of APCs, hepatocytes from bm8-OVA mice were isolated and seeded in the plates at 102, 103, or 104 cells per well. All cells were cultured in RPMI supplemented with 10% FBS, 50 μM beta-mercaptoethanol, glutamine, sodium pyruvate, and antibiotics. We characterized the uptake, intracellular processing and presentation of OVA using fluorescein-OVA, DQ™ OVA, and H-2Kb-SIINFEKL staining, respectively. DQ™ is a self-quenched conjugate of OVA that exhibits bright green fluorescence upon proteolytic degradation. We also quantified the relative basal expression of H-2Kb in each cell type.
Results
Cross-presentation of hepatocyte-derived antigen by liver APCs
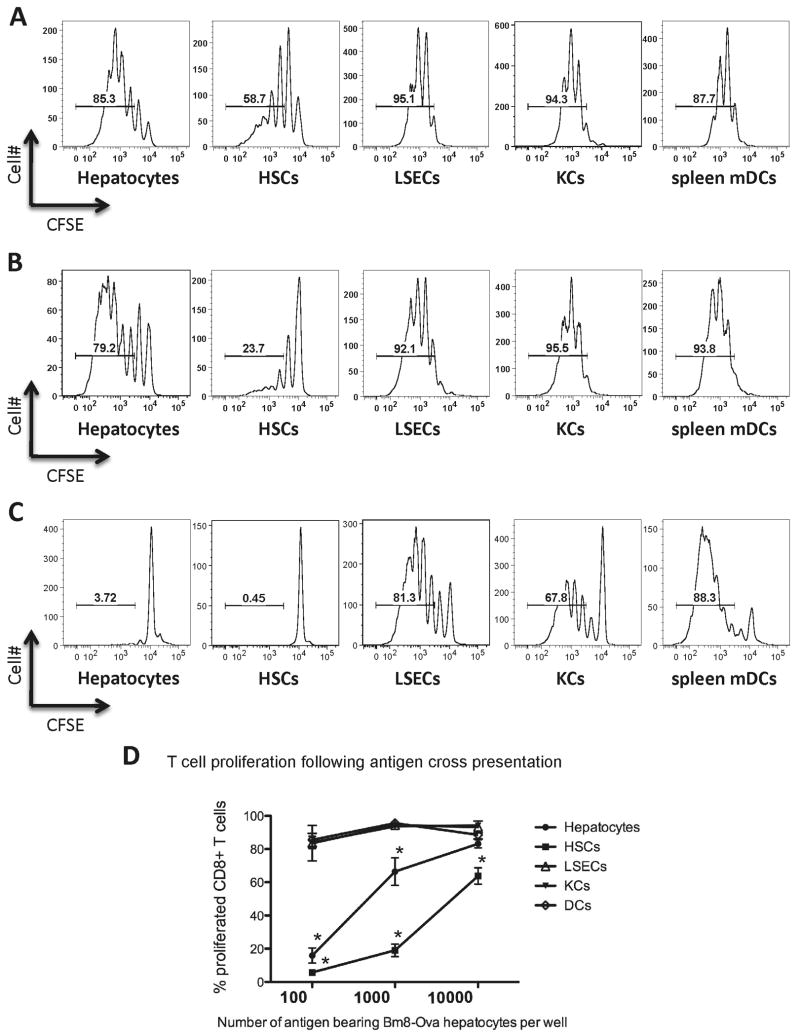
Isolated hepatocytes from bm8-OVA transgenic mice were used as the source of cell-derived antigen. Cells derived from these mice were unable to present the OVA peptide to OT-I CD8+ T cells due to a mutation in the H-2Kb molecule(15). OT-I CD8+ T-cells express transgenic TCRs against the peptide derived from OVA257-264, peptide sequence SIINFEKL, in the context of H-2Kb. In parallel experiments, we tested the capacity of the different liver APCs to cross-present hepatocyte-derived OVA to CD8+ OT-I T cells. We isolated candidate APCs from B6 mice and co-cultured them with bm8-OVA hepatocytes and OT-I CD8+ T cells. The proliferation of OT-I cells was assessed by the dilution of CFSE staining. When the antigenic cells were hepatocytes at 104 and 103 per well, all liver APCs were efficient in the cross-presentation of OVA associated with bm8-OVA hepatocytes, and all induced more than 5 rounds of T cell proliferation (Figure 1A, 1B). However, HSCs were not as efficient as the other liver cells in the induction of T cell proliferation (Figure 1D, P<0.01 at all concentrations of antigen). Even normal hepatocytes were better than HSCs in cross-presentation of OVA antigen (Figure 1D, P=0.014 at both 103 or 104 bm8-OVA hepatocytes/well). KCs and LSECs strongly cross-presented cell-associated antigens and induced high levels of T cell proliferation, similar to the level that we observed with spleen mDCs (Figure 1D).
Figure 1. Cross-presentation of hepatocyte-associated ovalbumin by candidate liver APCs.
Bm8-OVA primary hepatocytes were seeded in a 96-well plate (Day 0) at 104 (A), 103 (B), or 102 (C) cells per well. On the following day, 2.5×10⁴ highly purified candidate liver APCs (hepatocytes, hepatic stellate cells (HSCs), liver sinusoidal endothelial cells (LSECs), and Kupffer cells (KCs)) or spleen myeloid dendritic cells (mDCs) from C57BL/6J mice were added to the bm8-OVA hepatocytes. On Day 2, CFSE-labeled OT-I CD8+ T-cells (1×10⁵) were added to each well. After 80 hours of co-culture, CD8+ T-cell proliferation was quantified by CFSE dilution using flow cytometry (A-C, representative histograms). D. Data from 4 independent experiments showed that when antigen was abundant, all liver APCs cross-presented cell-associated OVA. However, APC-induced T-cell division attenuated significantly in cultures of hepatocytes and HSCs. LSECs and KCs induced comparable T-cell division to mDC at all doses. Plots represent means ±SEM. * P<0.01 different from spleen mDCs, at the same concentration of antigen.
It has been postulated that antigen dose can regulate cross-presentation function, (16) therefore limiting the availability of antigen may create conditions that are not favorable for cross-presentation. By decreasing the source of antigen in cultures, cross-presentation activity was attenuated in both HSCs and hepatocytes (Figure 1 C, 1 D). Plating 102 bm8-OVA hepatocytes per well, LSECs and KCs were the only liver cells that could efficiently cross-present OVA to OT-I CD8+ T cells. Both LSECs and KCs were as efficient as spleen DCs in the induction of CD8+ T cell proliferation (Figure 1 C, 1 D). The capacity of LSECs and KCs to cross-present hepatocyte-associated antigens could explain the potential of the liver as a primary site of T cell activation when antigen is in hepatocytes.
Cross-presentation of soluble antigen by liver APCs
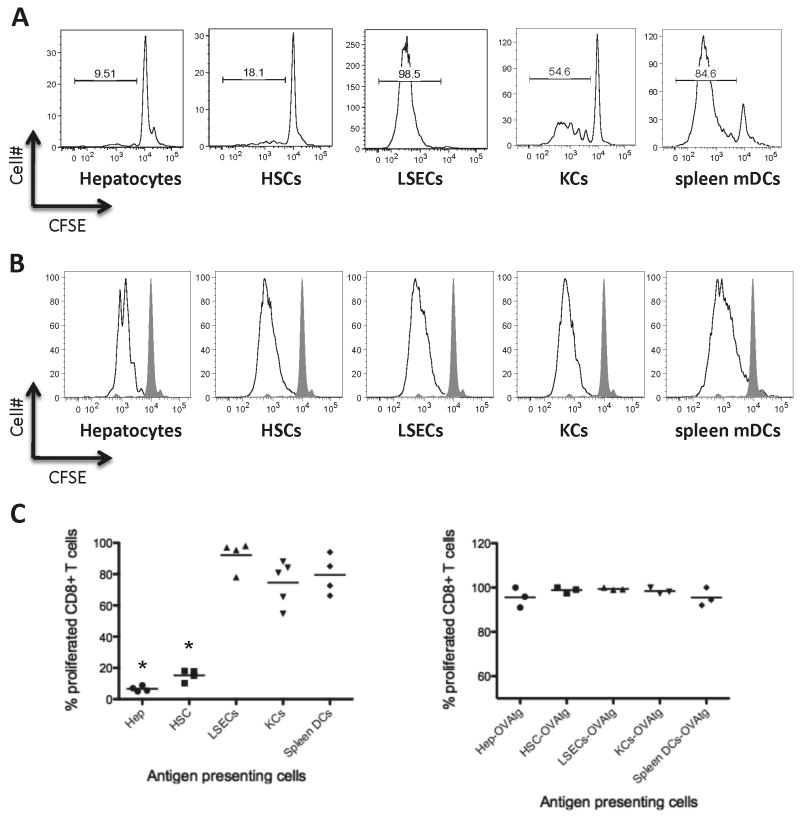
In separate studies, HSCs, KCs, and LSECs have been proposed to cross-present soluble OVA protein and activate CD8+ T cells (8-10). However, from such studies it is difficult to draw conclusions about the relative ability of each cell type to induce CD8+ T cell activation. Using direct back-to-back comparison of the different liver APCs, we can conclude that among the liver APCs, LSECs induced the most robust T cell proliferation, and in fact appeared to be slightly more potent than mDC (Figure 2A, 2C, P=0.058). KCs were also capable of inducing significant levels of CD8+ T cell proliferation; however, they tended to be less potent than LSECs (Figure 2A, 2C,P=0.055). Both hepatocytes and HSCs were inefficient in the presentation of soluble OVA proteins to CD8+ T cells (Figure 2A, 2C, p<0.01 in comparison to mDCs).
Figure 2. Cross-presentation of exogenous soluble ovalbumin protein or direct presentation of endogenously expressed ovalbumin.
A. Representative figure showing CFSE dilution following cross-presentation of soluble OVA by different subsets of liver APCs as well as spleen mDCs as positive controls. There was a clear hierarchy when antigen was soluble. LSECs were the best APC in induction of CD8+ T cell proliferation. KCs could induce a substantial level of proliferation; however, they were less efficient than LSECs. HSCs and hepatocytes were not efficient in this condition. B. Representative figure showing CFSE dilution following direct presentation of OVA using cells from OVA-transgenic mice. All APCs induced CD8+ T cell proliferation efficiently when comparing to control cultures of CD8+ T cells without APCs (shaded graph). C. Data from 3-5 separate experiments showing percent of proliferated OT-I T cells following soluble antigen cross presentation (left plot) or direct presentation of a transgenic antigen (right plot). Each data point represents an independent experiment. *P<0.01 different from spleen mDCs, which were positive controls.
Presentation of endogenous antigen by liver cells
Direct presentation of endogenous antigen by liver cells is likely an important component of liver immunity(17-19). To evaluate direct presentation of antigen by liver APCs, we took advantage of cells from OVA transgenic mice. Back to back comparison of these cells showed that all liver APCs can induce proliferation of CD8+ T-cells very efficiently. The level of this induction was comparable to OVA transgenic mDCs (Figure 2B, 2C).
LSECs show superior uptake, processing, and presentation of soluble antigen
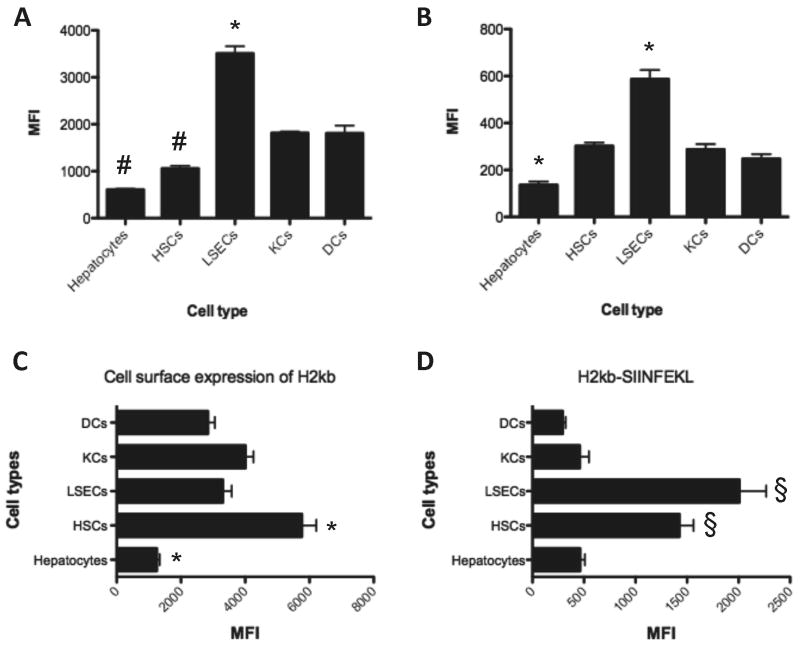
The SIINFEKL antigen needs to be in complex with MHC class I H-2Kb in order to engage an OT-I CD8 T cell receptor. The basal expression of H-2Kb was lower in hepatocytes compared to the other liver cells or mDC (Figure 3C, p<0.05). This may suggest a lower capacity of these cells to induce T cell response (Figure 3). Following 4 and 24 hours of incubation with fluorescein OVA conjugate, LSECs took up more OVA compared to other APCs (Figure 3A and S3). Concordantly, LSECs processed more DQ™ OVA and displayed higher levels of H-2Kb-SIINFEKL on their cell surface (Figures 3B and 3D, respectively). These results explain how LSECs show such strong cross-presentation of soluble proteins and induce T cell proliferation. Hepatocytes and HSCs could uptake OVA protein, but less efficiently than the other liver APCs (Figure 3 and S3). Unexpectedly, we also noticed high levels of H-2Kb-SIINFEKL on the surface of HSCs after 24 hours incubation with OVA protein.
Figure 3. Uptake and processing of soluble ovalbumin protein and the level of MHC class I protein.
A. After 4 hours of incubation with fluorescein OVA conjugate (100 μg/ml) the cells were studies by flow cytometry. The data showed higher levels of OVA uptake in LSECs and lower levels in hepatocytes and HSCs. B. Processing of DQ™ OVA showed increased fluorescent signal in LSEC population and lower level of signal in hepatocytes. However this can be influenced by level of OVA uptake by these cells. C and D. After 24 hours of incubation we stained for both H-2Kb and H-2Kb-SIINFEKL proteins, respectively, and assessed by flow cytometry. The data showed the highest levels of H-2Kb on HSCs and lowest levels on hepatocytes. H-2Kb-SIINFEKL is highest in LSECs. HSCs also displayed high levels of H-2Kb-SIINFEKL. * P<0.05 from all other APCs. # P<0.05 from LSECs, KCs and DCs. § P<0.05 from hepatocytes, KCs and DCs. All data are from 3 independent experiments.
Cross-presentation is dependent upon ICAM-1
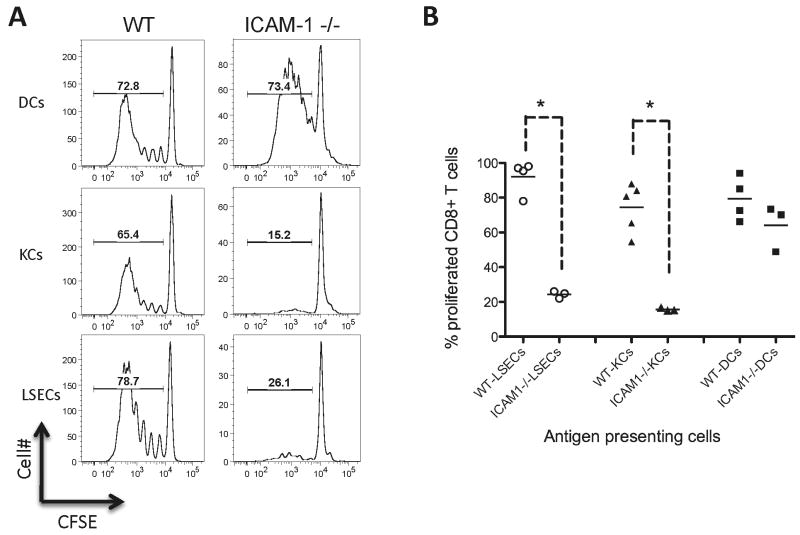
The events that lead to T cell activation are critically regulated by costimulatory molecules, such as CD28 and ICAM-1 located at the immunological synapse (20, 21). With a focus on LSECs, KCs, and spleen mDCs, we tested whether liver APCs exhibit distinctive costimulatory requirements during antigen cross-presentation and activation of CD8+ T cells. During initial experiments using blocking antibodies, we observed an important role for ICAM-1 in antigen presentation by liver cells (Figure S2). Thus, to further address the role of ICAM-1 in cross-presentation of OVA by liver APCs, we used APCs isolated from ICAM-1 deficient mice. ICAM-1 deficient LSECs and KCs could not cross-present soluble OVA to CD8+ T cells and failed to induce T cell proliferation (Figure 4, WT versus ICAM-1 deficient APCs, P=0.029 for LSECs and P=0.018 for KCs). However, ICAM-1 deficient spleen mDCs induced robust proliferation of CD8+ T cells similar to wild-type mDCs (Figure 4). This suggests that ICAM-1 is particularly important in T cell activation by liver APCs, in contrast to its smaller contribution to T cell activation by spleen mDCs.
Figure 4. Significance of ICAM-1 in activation of CD8+ T cells by liver antigen presenting cells.
A. Representative histograms showing OT-I CD8+ T cell division following antigen cross-presentation by OVA-pulsed LSECs, KCs or splenic mDCs. ICAM-1 deficient LSECs and KCs did not induce CD8+ T cell division, while mDCs function was comparable between ICAM-1 deficient and wild-type (WT) mice. B. Data from 3-5 separate experiments showed a significant decrease in OT-I T cell proliferation when using liver APCs deficient in ICAM-1 protein. * P<0.01 from spleen mDCs, which were positive controls.
Cross-presentation by liver APCs induced partial T cell activation
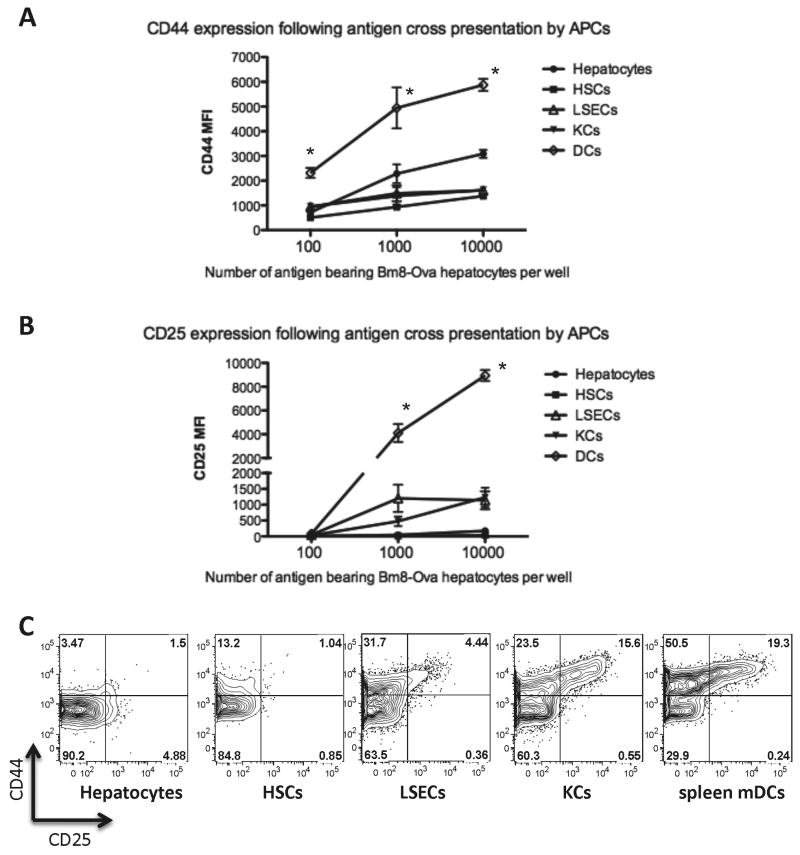
The CD8+ T cell activation response relies on the differentiation of a small number of specific naive CD8+ T lymphocytes into potent effector CTLs. One of the many facets of this activation is up-regulation of cell adhesion molecules including the hyaluronic acid receptor (CD44), and the expression of the CD25 receptor for IL-2, an important cytokine for T cell proliferation (22, 23). We evaluated the expression of these two markers of CD8+ T-cell activation following antigen cross-presentation by liver APCs or spleen mDCs. Compared to mDCs, we observed that liver APCs induced less CD25 and CD44 expression on proliferated CD8+ cells (Figure 5A-C). Increasing bm8-OVA hepatocyte density failed to elevate CD44 or CD25 to levels induced by liver APCs comparable to spleen mDCs (Figures 5 A, B). Cross-presentation of soluble OVA by liver APCs also failed to induce CD44 or CD25 to the same degree as mDCs, although LSECs and KCs caused greater CD44 and CD25 induction than other liver APCs (Figure 5 C).
Figure 5. CD44 and CD25 expression following antigen cross-presentation.
CD44 (A) and CD25 (B) expression on OT-I CD8+ T cells following cross-presentation of cell-associated OVA protein. Data from 4 independent experiments showed that when CD8+ T cells were cross-primed with liver APCs, they expressed lower levels of CD44 (A) and CD25 (B) compared to CD8+ T cells cross-primed with mDCs from the spleen. * P<0.01 different from each liver cell type, at the same concentration of antigen. C. Representative FACS plots showing up-regulation of CD44 and CD25 following cross-presentation of soluble OVA protein. Consistent with cross-presentation of cell-associated antigen, cross presentation of soluble OVA by liver APCs resulted in lower levels of CD44 and CD25 when compared with cross-presentation by spleen mDCs.
Since PD-L1 on APCs can interact with PD-1 to reduce activation of CD8+ T cells, we explored whether a PD-L1 blocking antibody (MIH5 clone)(24) could increase the T cell activation phenotype following antigen presentation by liver APCs. However, in our setting, blocking PD-L1 did not restore CD44 or CD25 in proliferated CD8+ T cells (Figure S4).
It is also plausible that antigen presentation by liver APCs promote activation-induced cell death (AICD) of highly activated T cells. In this scenario, strongly activated T cells would be predicted die more rapidly. To address this, we measured CD8+ T cell death following cross-presentation of Bm8-OVA hepatocytes by liver APCs or spleen DCs. The results showed no significant difference in the frequency of dead cells among cultures of KCs, LSECs or spleen DCs (Figure S5). Additionally we measured expression of CD44 and CD25 in CD8+ T cells that are 7-AAD permeable. These dead CD8+ T cells from cultures of liver APCs were still lower in expression of CD44 and CD25 when compared with T cells from cultures of spleen DCs (P<0.05, Figure S5). We found the highest frequency of 7AAD+ CD8+ cells in the cultures of OT-1 T cells with hepatocytes and HSCs, in which the T cells were not so strongly activated. This does not fit with an AICD model (see Discussion).
Reduced intracellular levels of Interferon-γ following antigen cross-presentation by liver APCs
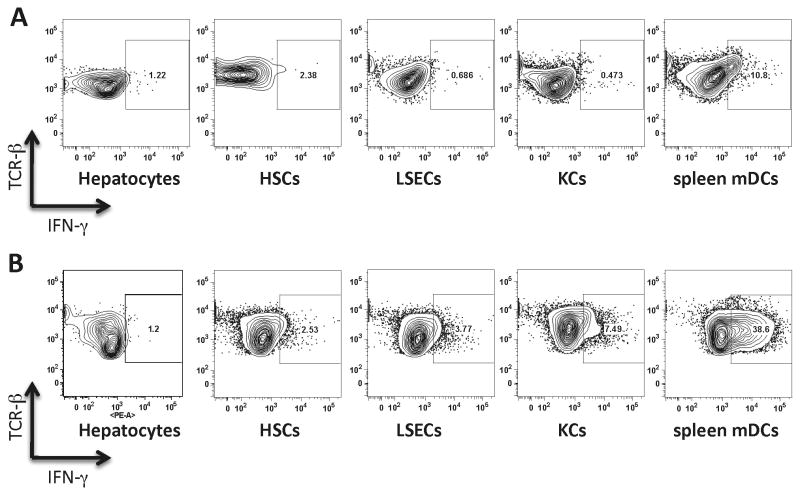
Following activation, CD8+ T cells produce IFN-γ an important signature cytokine of anti-viral responses. While measurements of IFN-γ in a culture supernatant can give us a crude estimate of IFN-γ secretion from both CD8+ T cells and their APCs, intracellular staining of CD8+ TCR+ cells for IFN-γ can accurately reveal the levels of IFN-γ. Consistent with lower CD44 and CD25 expression, we observed that CD8+ T cells cross-primed by liver APCs produced less IFN-γ (Figure 6A). To understand whether a low level of IFN-γ production is exclusive to the conditions in which antigen is cross-presented, we assessed IFN-γ levels following direct presentation of OVA protein. Direct presentation of OVA by liver APCs, but not spleen mDCs, was also accompanied by inefficient IFN-γ production (Figure 6B). This was particularly interesting since the levels of proliferation were similar. These experiments showed that the attenuated level of IFN-γ in T cells exposed to liver APCs is independent of the source of antigen. These results, taken together with the CD44 and CD25 expression data, show that antigen cross-presentation by liver APCs can induce T-cell proliferation but not full T cell activation.
Figure 6. Intracellular IFN-γ staining in CD8+ T cells A.
Cross-presentation of soluble OVA protein by liver APCs induced lower levels of IFN-γ when compared with cross-presentation by spleen mDCs. B. Direct presentation by OVA transgenic liver APCs induced lower levels of IFN-γ when compared with direct presentation by OVA transgenic mDCs. Data are representative of two independent experiments.
Discussion
The goal of this study was to conduct an unbiased back-to-back comparison of the major resident liver cell populations as APCs. This approach led us to precisely characterize cross-presentation of hepatocyte-associated and soluble protein antigens by liver APCs. Our results show that the liver is very rich in cell types that can perform antigen cross-presentation. Antigen presentation by liver cells was dependent on the amount of available antigen, and was specialized to LSECs and KCs in the case of soluble protein antigen, or with a low dose of a cellular antigen. HSCs were not efficient in activation of T cells through cross-presentation of antigens. However, HSCs were quite good in direct presentation of endogenous antigens. Cross-presentation by liver APCs resulted in proliferation of CD8+ T cells to a level comparable to spleen mDCs under certain conditions. Interestingly, classical features of fully activated CD8+ T cells, such as high CD44, high CD25 and high IFN-γ, did not accompany liver APC-induced T-cell proliferation. We believe these features of intra-hepatic antigen presentation strongly influence liver immune responses.
Hepatocytes are the predominant target cells in liver infection. In this study, we observed that at high antigen levels, these cells could cross-present cell-associated antigens from neighboring hepatocytes to CD8+ T cells and induce a substantial level of proliferation. However, it has been shown that activation of CD8+ T cells on hepatocytes promotes helpless CTLs and suboptimal T cell activation (25, 26). Thus, upon infection of a small number of hepatocytes, it is the cross-presentation of hepatocyte antigens by liver non-parenchymal cells that has the potential to engage both CD4+ and CD8+ T cells simultaneously and deliver an appropriate effective immune response. Presumably, CD4+ help is one of the microenviromental cues that can influence the ultimate fate of adaptive immune response in the context of partial CD8+ T cell activation. In this study, we were able to show that the function of cross-presentation is not limited to classic professional APCs, such as mDCs. Assessment of both LSECs and KCs showed that they efficiently cross-presented antigens to CD8+ T cells under all of the conditions tested. However, the cross-presentation by these liver APCs was accompanied by suboptimal CD8+ T cell cross-priming.
Hepatic stellate cells have recently been proposed as professional liver-resident APCs that efficiently present antigens and drive proliferation of NKT cells (10), but there have been few follow-up studies to characterize the antigen presentation activity of these cells. One concern is that the standard protocols for isolation of HSCs could result in some level of cross-contamination from liver macrophages. We isolated and compared several APC candidates in parallel, making special efforts to deplete CD11b+ macrophages from HSC cultures. This allows us to offer a more detailed assessment of antigen presentation by HSCs. Our data show that purified HSCs were indeed very competent in presentation of endogenously expressed antigens to CD8+ T cells. However, in our parallel comparison, HSCs poorly cross-presented antigens at various concentrations. It was therefore unexpected to observe such high levels of H-2Kb-SIINFEKL on surface of HSCs that were incubated with OVA protein. Since HSCs did not induce T cell proliferation, this suggests that HSCs either actively inhibit T cell proliferation or fail to express co-stimulatory factors that allow HSCs to function as efficient cross-presenting cells (27, 28).
Following TCR engagement, T-cell activation can be outwardly measured by proliferation, expression of surface molecules such as CD44 and CD25, or cytokine secretion. Whether these aspects of the T cell response are triggered concomitantly or independently following engagement of the TCR complexes on naive CD8+ T cells has been the target of several investigations; however, it is difficult to propose a cohesive model (29, 30). Tight linkage between proliferation and function is evident in some experimental models of differentiation, but not others (29, 30). In our study, we observed that even with a similar level of proliferation between liver APCs and spleen mDCs, there are distinct differences in CD44, CD25, and IFN-γ levels. This may suggest that T cells primed by liver APCs could require additional cell division to achieve the same level of activation, or alternatively, that cell division and cytokine synthesis are not strictly coupled in this context. The exact underlying mechanisms that shape this partial activation state warrant further investigation. However, one possible mechanism is that liver APCs promote cell death in highly activated T cells.
Studying the dead cells in relation to the level of proliferation and CD44 and CD25 expression, the data do not support the activation-induced cell death hypothesis. Instead, the finding that less efficient APC (hepatocytes and HSCs) induced lower levels of proliferation, and less induction of CD44 and CD25, but higher levels of cell death. This suggests that sub-optimally activated CD8+ T cells are less viable. This phenotype is particularly evident in hepatocyte-mediated cross-presentation where CD8+ T cells divide, but fail to up-regulate CD25 or IFN-γ production and die. It is important to consider that proliferation and IFN-γ production by the CD8+ T cells are influenced by the spectrum of cytokines secreted by the APCs. For instance, in the fibrotic liver KCs are an important source of TGF-β, which can skew naïve CD8+ T cell activation and IFN-γ production (31-33). Thus, this T cell phenotype is additionally regulated by further microenvironmental cues during the course of infection.
The liver microenvironment is constitutively exposed to intestinal bacterial products that engage pathogen recognition receptors and result in continuous low-level stimulation of the MyD88-NF-κB axis(6). In such an environment, it makes sense to have a higher threshold for effector T-cell activation. Thus, in the liver, the CD8+ T cell response may be tuned down in order to meet the physiologic requirement of this organ and prevent uncontrolled inflammation or immune response. owever, this tolerance may also allow pathogens to achieve hepatic chronicity.
This study demonstrates that the chronicity of many liver infections is not likely to be due to the lack of efficient antigen cross-presentation; in fact, the liver is an organ with diverse cells that can cross-present antigens. Instead, antigen cross-presentation in the liver may expand a CD8+ T cell population with an atypical phenotype, the purpose of which has yet to be understood. Taken together, these results help to explain how the liver can be a primary site for T cell proliferation, and yet liver-activated T cells are prone to deliver ineffective immunity.
Supplementary Material
Acknowledgments
We would like to thank Ms. Rebekah Brown and Mr. Dat Mai as well as flow core facilities at Seattle BioMed and the University of Washington for their technical support during this study. We also thank JoAnne Dyer for help with the preparation of the manuscript.
Grant support: NIH R01-DK075274 and NIH R01-AI064463
List of Abbreviations
- LSECs
liver sinusoidal endothelial cells
- HSCs
hepatic stellate cells
- KCs
Kupffer cells
- bm8
B6.C-H-2bm8
- mDCs
spleen myeloid dendritic cells
- OVA
ovalbumin
- MHC
major histocompatibility complex
Contributor Information
Isaac Mohar, Email: isaac.mohar@seattlebiomed.org.
Ian N Crispe, Email: nick.crispe@seattlebiomed.org.
References
- 1.Bevan MJ. Cross-priming for a secondary cytotoxic response to minor H antigens with H-2 congenic cells which do not cross-react in the cytotoxic assay. J Exp Med. 1976;143:1283–1288. doi: 10.1084/jem.143.5.1283. [DOI] [PMC free article] [PubMed] [Google Scholar]
- 2.Heath WR, Carbone FR. Cross-presentation in viral immunity and self-tolerance. Nat Rev Immunol. 2001;1:126–134. doi: 10.1038/35100512. [DOI] [PubMed] [Google Scholar]
- 3.Rehermann B. Hepatitis C virus versus innate and adaptive immune responses: a tale of coevolution and coexistence. J Clin Invest. 2009;119:1745–1754. doi: 10.1172/JCI39133. [DOI] [PMC free article] [PubMed] [Google Scholar]
- 4.O'Beirne J, Mitchell J, Farzaneh F, Harrison PM. Inhibition of major histocompatibility complex Class I antigen presentation by hepatitis C virus core protein in myeloid dendritic cells. Virology. 2009;389:1–7. doi: 10.1016/j.virol.2009.03.035. [DOI] [PubMed] [Google Scholar]
- 5.Thimme R, Oldach D, Chang KM, Steiger C, Ray SC, Chisari FV. Determinants of viral clearance and persistence during acute hepatitis C virus infection. J Exp Med. 2001;194:1395–1406. doi: 10.1084/jem.194.10.1395. [DOI] [PMC free article] [PubMed] [Google Scholar]
- 6.Crispe IN. The liver as a lymphoid organ. Annu Rev Immunol. 2009;27:147–163. doi: 10.1146/annurev.immunol.021908.132629. [DOI] [PubMed] [Google Scholar]
- 7.Thomson AW, Knolle PA. Antigen-presenting cell function in the tolerogenic liver environment. Nat Rev Immunol. 10:753–766. doi: 10.1038/nri2858. [DOI] [PubMed] [Google Scholar]
- 8.Limmer A, Ohl J, Kurts C, Ljunggren HG, Reiss Y, Groettrup M, Momburg F, et al. Efficient presentation of exogenous antigen by liver endothelial cells to CD8+ T cells results in antigen-specific T-cell tolerance. Nat Med. 2000;6:1348–1354. doi: 10.1038/82161. [DOI] [PubMed] [Google Scholar]
- 9.You Q, Cheng L, Kedl RM, Ju C. Mechanism of T cell tolerance induction by murine hepatic Kupffer cells. Hepatology. 2008;48:978–990. doi: 10.1002/hep.22395. [DOI] [PMC free article] [PubMed] [Google Scholar]
- 10.Winau F, Hegasy G, Weiskirchen R, Weber S, Cassan C, Sieling PA, Modlin RL, et al. Ito cells are liver-resident antigen-presenting cells for activating T cell responses. Immunity. 2007;26:117–129. doi: 10.1016/j.immuni.2006.11.011. [DOI] [PubMed] [Google Scholar]
- 11.Kurts C, Robinson BW, Knolle PA. Cross-priming in health and disease. Nat Rev Immunol. 2010;10:403–414. doi: 10.1038/nri2780. [DOI] [PubMed] [Google Scholar]
- 12.Burgdorf S, Scholz C, Kautz A, Tampe R, Kurts C. Spatial and mechanistic separation of cross-presentation and endogenous antigen presentation. Nat Immunol. 2008;9:558–566. doi: 10.1038/ni.1601. [DOI] [PubMed] [Google Scholar]
- 13.Burgdorf S, Lukacs-Kornek V, Kurts C. The mannose receptor mediates uptake of soluble but not of cell-associated antigen for cross-presentation. J Immunol. 2006;176:6770–6776. doi: 10.4049/jimmunol.176.11.6770. [DOI] [PubMed] [Google Scholar]
- 14.Wuensch SA, Pierce RH, Crispe IN. Local intrahepatic CD8+ T cell activation by a non-self-antigen results in full functional differentiation. J Immunol. 2006;177:1689–1697. doi: 10.4049/jimmunol.177.3.1689. [DOI] [PubMed] [Google Scholar]
- 15.Pease LR, Schulze DH, Pfaffenbach GM, Nathenson SG. Spontaneous H-2 mutants provide evidence that a copy mechanism analogous to gene conversion generates polymorphism in the major histocompatibility complex. Proc Natl Acad Sci U S A. 1983;80:242–246. doi: 10.1073/pnas.80.1.242. [DOI] [PMC free article] [PubMed] [Google Scholar]
- 16.Kurts C, Miller JF, Subramaniam RM, Carbone FR, Heath WR. Major histocompatibility complex class I-restricted cross-presentation is biased towards high dose antigens and those released during cellular destruction. J Exp Med. 1998;188:409–414. doi: 10.1084/jem.188.2.409. [DOI] [PMC free article] [PubMed] [Google Scholar]
- 17.Radkowski M, Bednarska A, Horban A, Stanczak J, Wilkinson J, Adair DM, Nowicki M, et al. Infection of primary human macrophages with hepatitis C virus in vitro: induction of tumour necrosis factor-alpha and interleukin 8. J Gen Virol. 2004;85:47–59. doi: 10.1099/vir.0.19491-0. [DOI] [PubMed] [Google Scholar]
- 18.Steffan AM, Lafon ME, Gendrault JL, Schweitzer C, Royer C, Jaeck D, Arnaud JP, et al. Primary cultures of endothelial cells from the human liver sinusoid are permissive for human immunodeficiency virus type 1. Proc Natl Acad Sci U S A. 1992;89:1582–1586. doi: 10.1073/pnas.89.5.1582. [DOI] [PMC free article] [PubMed] [Google Scholar]
- 19.Tuyama AC, Hong F, Saiman Y, Wang C, Ozkok D, Mosoian A, Chen P, et al. Human immunodeficiency virus (HIV)-1 infects human hepatic stellate cells and promotes collagen I and monocyte chemoattractant protein-1 expression: implications for the pathogenesis of HIV/hepatitis C virus-induced liver fibrosis. Hepatology. 2010;52:612–622. doi: 10.1002/hep.23679. [DOI] [PMC free article] [PubMed] [Google Scholar]
- 20.Kishimoto K, Dong VM, Issazadeh S, Fedoseyeva EV, Waaga AM, Yamada A, Sho M, et al. The role of CD154-CD40 versus CD28-B7 costimulatory pathways in regulating allogeneic Th1 and Th2 responses in vivo. J Clin Invest. 2000;106:63–72. doi: 10.1172/JCI9586. [DOI] [PMC free article] [PubMed] [Google Scholar]
- 21.Van Seventer GA, Shimizu Y, Horgan KJ, Shaw S. The LFA-1 ligand ICAM-1 provides an important costimulatory signal for T cell receptor-mediated activation of resting T cells. J Immunol. 1990;144:4579–4586. [PubMed] [Google Scholar]
- 22.Mitchell DM, Williams MA. An activation marker finds a function. Immunity. 32:9–11. doi: 10.1016/j.immuni.2010.01.003. [DOI] [PubMed] [Google Scholar]
- 23.Robb RJ, Munck A, Smith KA. T cell growth factor receptors. Quantitation, specificity, and biological relevance. J Exp Med. 1981;154:1455–1474. doi: 10.1084/jem.154.5.1455. [DOI] [PMC free article] [PubMed] [Google Scholar]
- 24.Saudemont A, Jouy N, Hetuin D, Quesnel B. NK cells that are activated by CXCL10 can kill dormant tumor cells that resist CTL-mediated lysis and can express B7-H1 that stimulates T cells. Blood. 2005;105:2428–2435. doi: 10.1182/blood-2004-09-3458. [DOI] [PubMed] [Google Scholar]
- 25.Bertolino P, Trescol-Biemont MC, Rabourdin-Combe C. Hepatocytes induce functional activation of naive CD8+ T lymphocytes but fail to promote survival. Eur J Immunol. 1998;28:221–236. doi: 10.1002/(SICI)1521-4141(199801)28:01<221::AID-IMMU221>3.0.CO;2-F. [DOI] [PubMed] [Google Scholar]
- 26.Wuensch SA, Spahn J, Crispe IN. Direct, help-independent priming of CD8+ T cells by adeno-associated virus-transduced hepatocytes. Hepatology. 52:1068–1077. doi: 10.1002/hep.23745. [DOI] [PMC free article] [PubMed] [Google Scholar]
- 27.Chinnadurai R, Grakoui A. B7-H4 mediates inhibition of T cell responses by activated murine hepatic stellate cells. Hepatology. 2010;52:2177–85. doi: 10.1002/hep.23953. [DOI] [PMC free article] [PubMed] [Google Scholar]
- 28.Schildberg FA, Wojtalla A, Siegmund SV, Endl E, Diehl L, Abdullah Z, Kurts C, et al. Hepatic stellate cells veto CD8 T cell activation by a CD54-dependent mechanism. Hepatology. 2011 Apr 12; doi: 10.1002/hep.24352. [DOI] [PubMed] [Google Scholar]
- 29.Bird JJ, Brown DR, Mullen AC, Moskowitz NH, Mahowald MA, Sider JR, Gajewski TF, et al. Helper T cell differentiation is controlled by the cell cycle. Immunity. 1998;9:229–237. doi: 10.1016/s1074-7613(00)80605-6. [DOI] [PubMed] [Google Scholar]
- 30.Laouar Y, Crispe IN. Functional flexibility in T cells: independent regulation of CD4+ T cell proliferation and effector function in vivo. Immunity. 2000;13:291–301. doi: 10.1016/s1074-7613(00)00029-7. [DOI] [PubMed] [Google Scholar]
- 31.Filippi CM, Juedes AE, Oldham JE, Ling E, Togher L, Peng Y, Flavell RA, et al. Transforming growth factor-beta suppresses the activation of CD8+ T-cells when naive but promotes their survival and function once antigen experienced: a two-faced impact on autoimmunity. Diabetes. 2008;57:2684–92. doi: 10.2337/db08-0609. [DOI] [PMC free article] [PubMed] [Google Scholar]
- 32.Karlmark KR, Weiskirchen R, Zimmermann HW, Gassler N, Ginhoux F, Weber C, Merad M, et al. Hepatic recruitment of the inflammatory Gr1+ monocyte subset upon liver injury promotes hepatic fibrosis. Hepatology. 2009;50:261–74. doi: 10.1002/hep.22950. [DOI] [PubMed] [Google Scholar]
- 33.Bataller R, Brenner DA. Liver fibrosis. J Clin Invest. 2005;115:209–18. doi: 10.1172/JCI24282. [DOI] [PMC free article] [PubMed] [Google Scholar]
Associated Data
This section collects any data citations, data availability statements, or supplementary materials included in this article.


